ILFS saga continue to get interesting. When Andy Mukherjee wrote https://www.bloomberg.com/view/articles/2018-09-13/india-s-il-fs-is-facing-a-lehman-moment in Bloomberg, I was actually taken back by the comparisons to Lehman Moment. I am a little skeptical even now but I think this crisis will not blow over so easily and there is a high possibility it might spill over on other lower rated corporates. They might see their bond spread widen in coming days or at worst they might be shut out of corporate bond/commercial paper market. Since rating agencies have also been caught on wrong foot it is extremely rare for AA+ or A1+ to directly go to default), they will also tighten their so called standards further.
It is important for regulators and rating agencies to determine whether ILFS is a case of cash flow mismatch and simply overextending or something else.
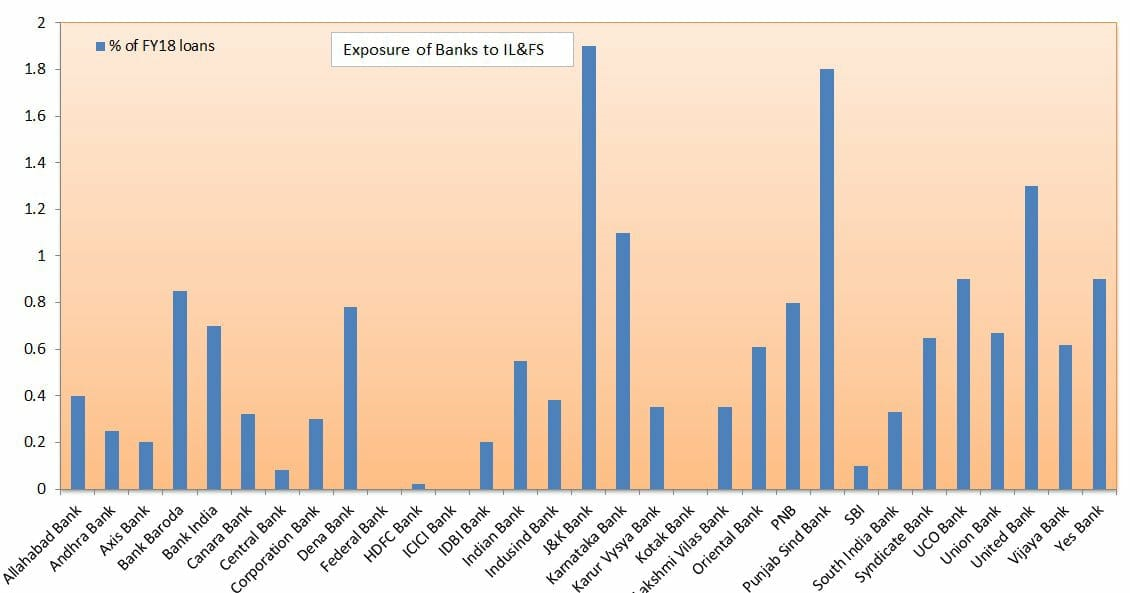
- The first chart is exposure of banks to IL&FS
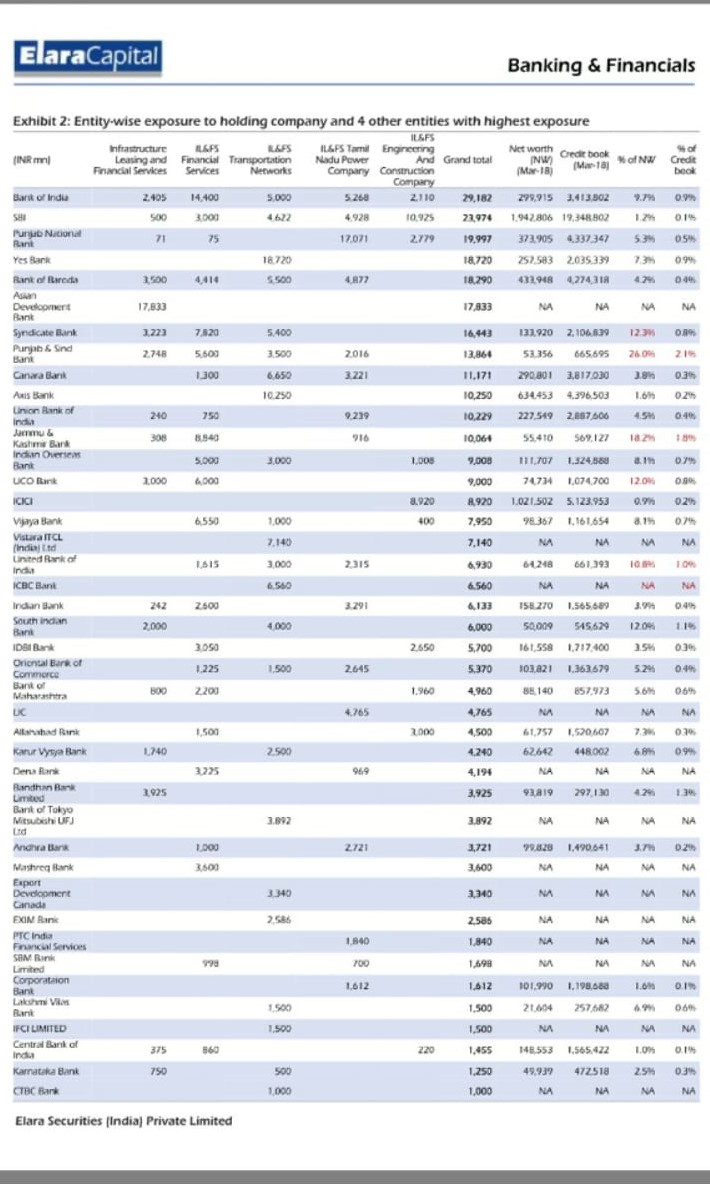
2. The following chart is more relevant. It shows ILFS ( plus 4 subsidiaries)exposure as % of networth and as a % of credit book.
Most of it is still standard asset in Banks books
3. This is the copy to exchange of ILFS default on its commercial paper obligation. Most Commercial papers are in mutual fund books (liquid/ ultra/short term fund)and historically banks used to lend more money to corporates to payoff their commercial paper obligations and the liabilities used to shift to banks from mutual funds why?
Because Default on commercial paper or tradeable bond attract more media and public scrutiny than a default on individual loans to banks. Banks used to evergreen those loans and push default in future (problem solved)
ilfs3
4. Nomura has done a good job of quantifying the ILFS exposure but I think there are still more contingent liabilities which will come out in next few days.
ilfs4