ECRI’s U.S. Weekly Leading Index (WLI) fell to 144.7 as WLI growth decreased to -4.4%, a 199-week low.
(The WLI is one of many ECRI leading indexes, including some with longer leads over cyclical turning points in economic growth)

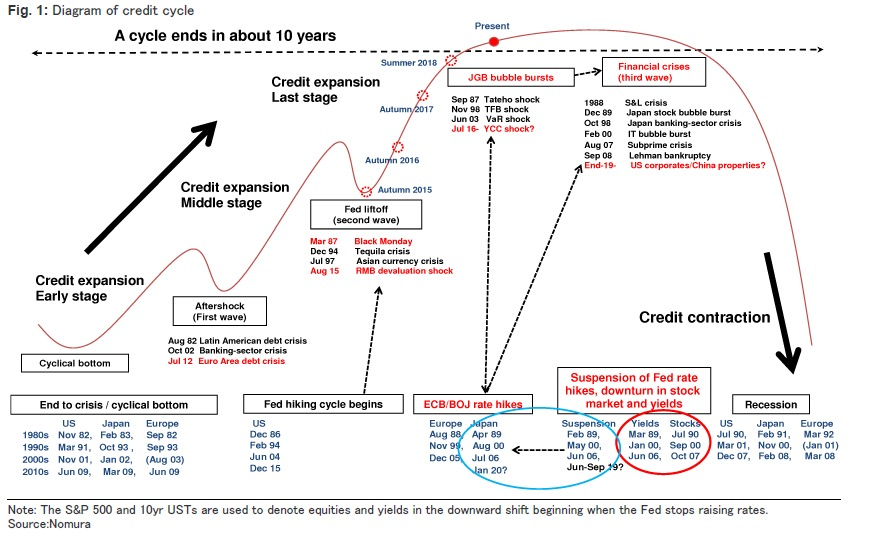
A cycle ends every ten years…. one ending now – Nomura
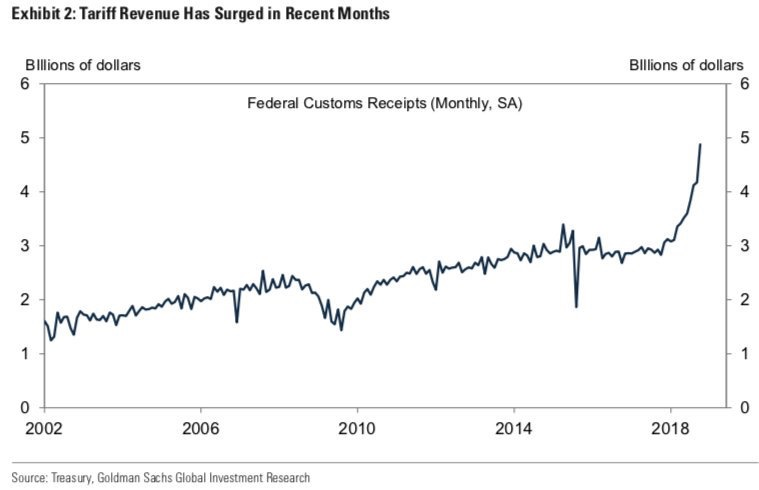
Tariff Revenue Has Surged in Recent Months (tariffs are stealth taxes on broke consumers)
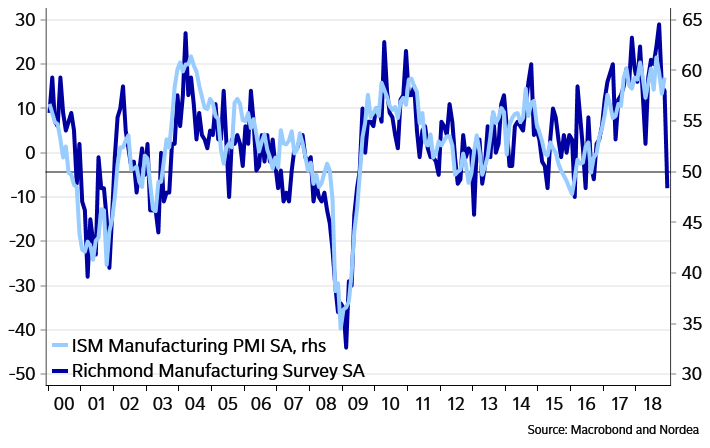
Would you want to tighten more given these charts?
The Richmond Fed is not the only indicator that points to below-50 readings in the ISM index ( below 50 is sign of contraction)three to five months from now – financial condition indices point in the same direction. Would you tighten further if you were the Fed and looked at these charts? At least it becomes much trickier than otherwise. Even though the ISM is not a particularly precise indicator of US GDP trends, it is worrisome if the ISM index drops as swiftly as indicated by some of our models by now.( Nordea)