Mehul Daya and Neels Heyneke are out with a fantastic technical report on global markets……..they write,Last year, global dollar liquidity contracted, and the dollar and emerging markets reacted to this contraction. This year will determine whether the tighter global financial conditions will continue to work their way into the bond and equity markets or if central banks will come to their rescue. A lot of research effort is spent on future Fed policy, but we believe the Chinese monetary system is the weakest link right now and that it needs to be monitored closely.
• We have been warning since early last year that deflationary, and not inflationary, forces remain the bigger headache.
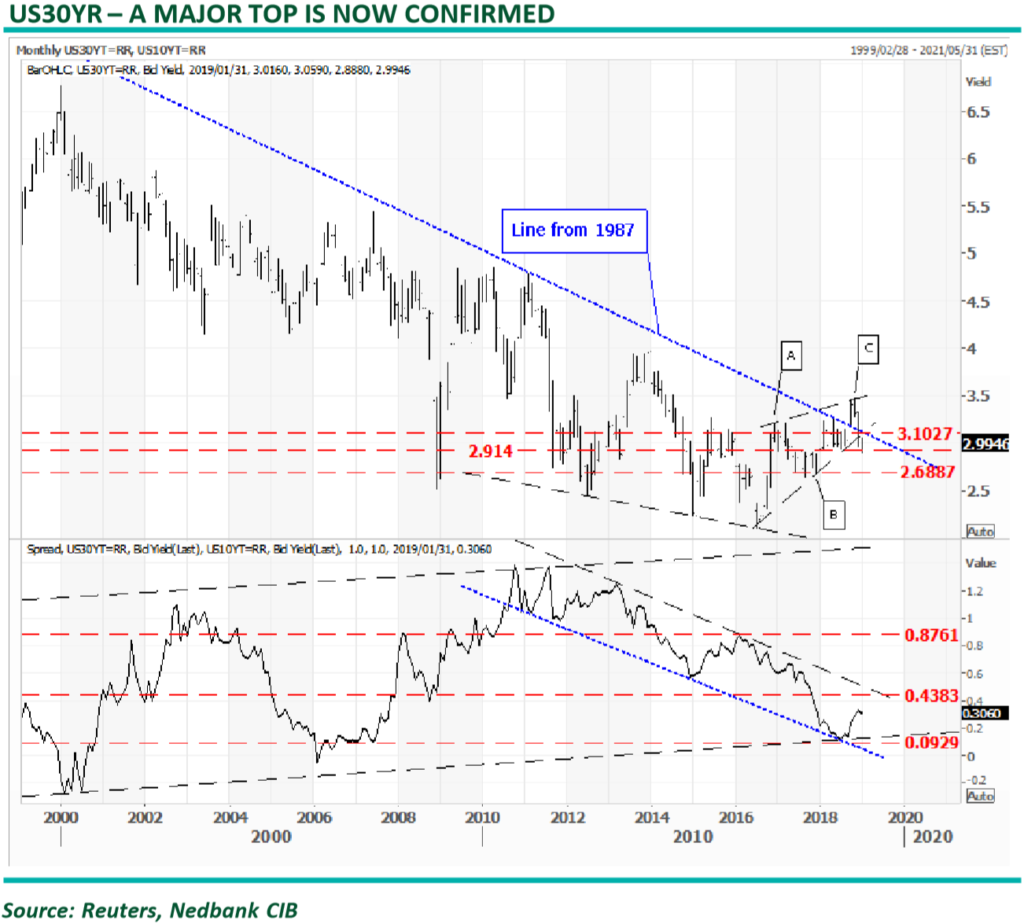
• The fact that the break out of the bull trend since 1987 has proved to be false on the US government 30-yr is a buy signal in itself. The break below 3.10% projects a move to 2.68%, with more downside potential after that.
• The 30-10yr spread remains in the bull trend that started in 2012 as QE programmes compressed term premia and volatility. A break above 43 basis points will indicate the markets are starting to price risk into the curve, which will not be good news for risk assets.
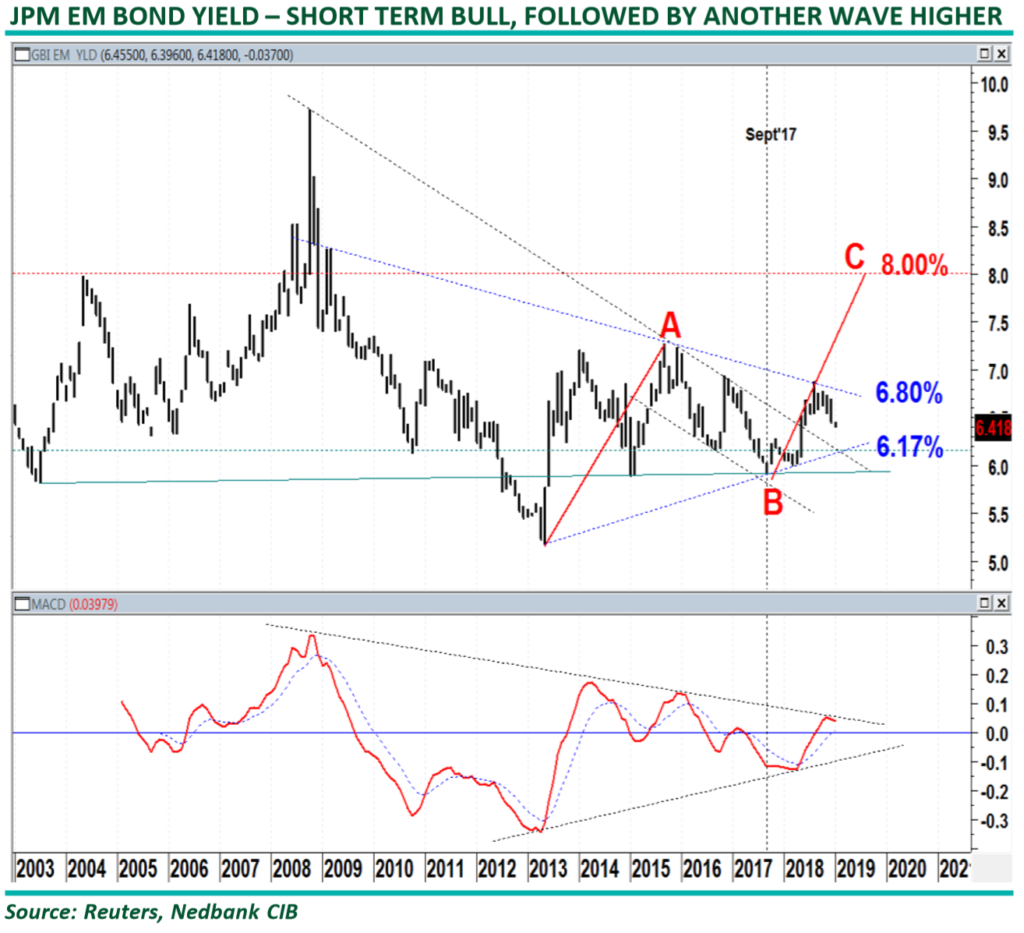
The JPM emerging market bond yield bottomed with the “Taper” statement in 2013. Yields peaked in early 2016 with the “Shanghai accord” and bottomed out in September 2017. This was several months before the risk-off started in other asset classes – in late January 2018, with the VIX sell-off. • Wave A was in the region of 2%, and in theory, wave C should also be 2%, targeting 8%.
• We believe the fundamental driver of this move will be the Chinese economy and, subsequently, a further contraction in global dollar liquidity. • We have had the view, since early last year, that a repeat of the 1998 SE-Asia is a likely outcome. This time, China will be the victim of the impossible Trilemma, which states that it is impossible to have all three of the following at the same time: a fixed foreign exchange rate, free capital movement and an independent monetary policy.
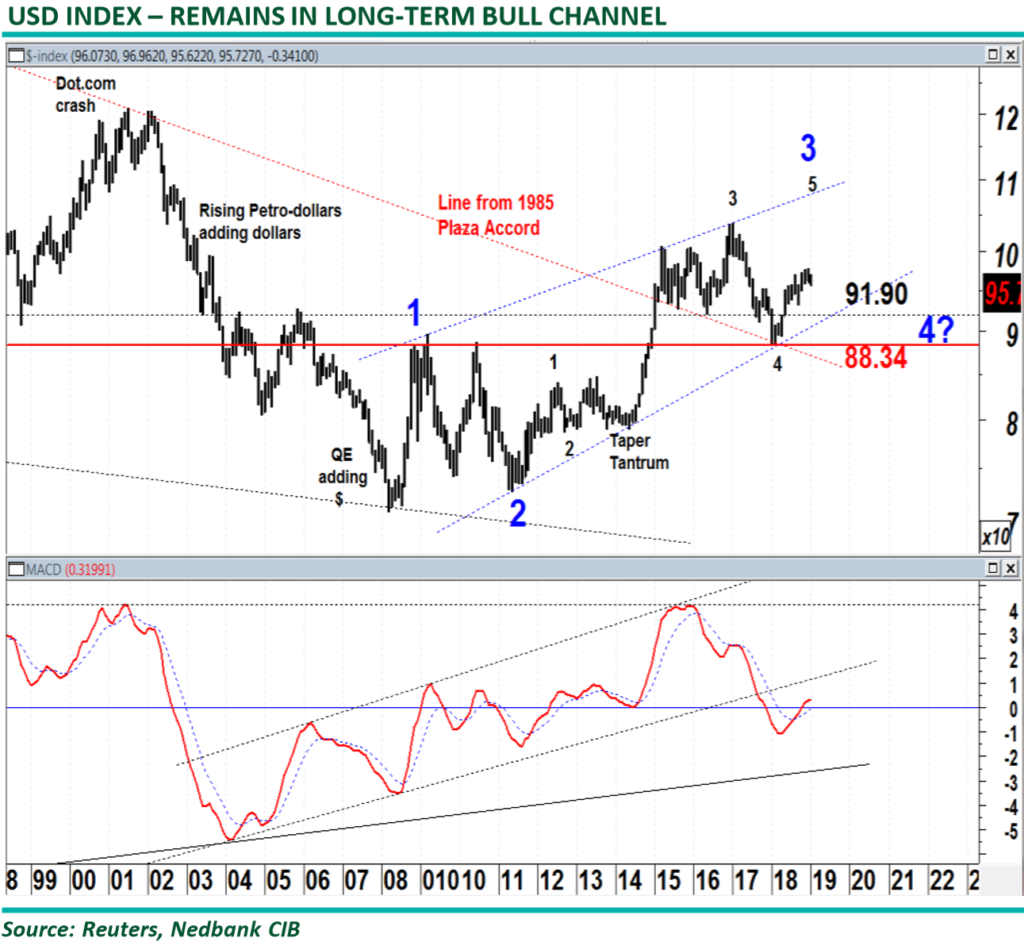
The dollar has been in a bull market since the GFC and rallied in early 2018 from the important support line from 1985 at 88.34. • We have written extensively over the last few years that interest rate differentials alone are not the only drivers of currencies anymore. The quantum of dollars in the system, stemming from Fed policy, developments in the euro-dollar system, global growth (velocity of money) and shadow banking activities need to be taken into consideration. • The dollar bull lost momentum during 4Q18, and a correction is playing out. The target levels for this correction are 93.09 and the neckline and support line at 91.90. • Only a break below the latter level, out of the bull trend since 2010, will force us to revisit our long-term bullish view on the dollar.
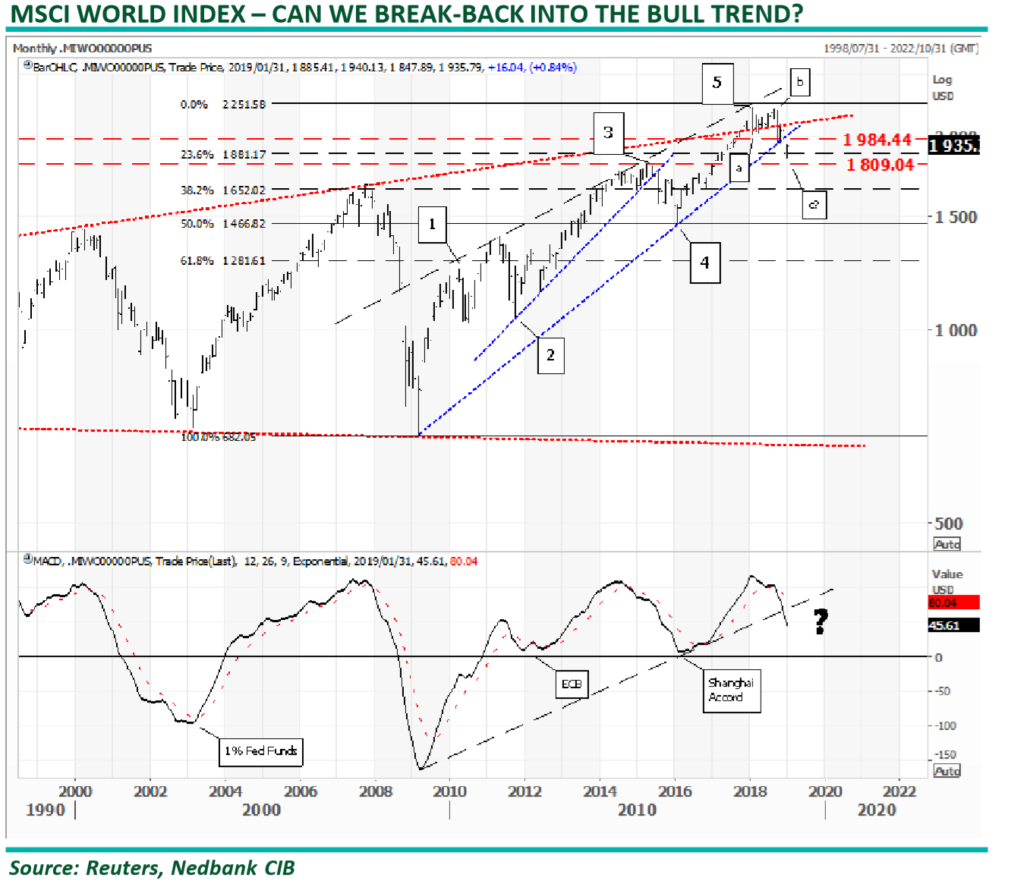
The performance of the US markets helped the MSCI World Index to remain above the resistance line through the highs since 2000. The break was, however, not sustainable, and the break back below the resistance and below the support line from 2009 is a bearish signal. At this point, the correction from the 1Q18 is still an ABC pattern, which indicates a correction phase. Any further downside move below 1,809 will, however, confirm that the market is trending to the downside, targeting the wave 4 low at 1,466. • The Shanghai Accord, however, managed to stop a bear trend from unfolding. There are many views that the central banks must reverse their tightening biases. That is surely possible, but we are sceptical about whether a new Shanghai Accord can be reached, as the global geopolitical landscape is quite different today vs that in 2016. • In a geared world of shadow banking and asset inflation, bear markets do not always start with the economy slowing down. In 1998, 2000 and in 2008, tighter financial conditions derailed markets, triggering an economic slowdown. The reason being, as asset prices fall, the re-hypothecation process slows down, triggering a major liquidity squeeze that works its way back into the real economy.
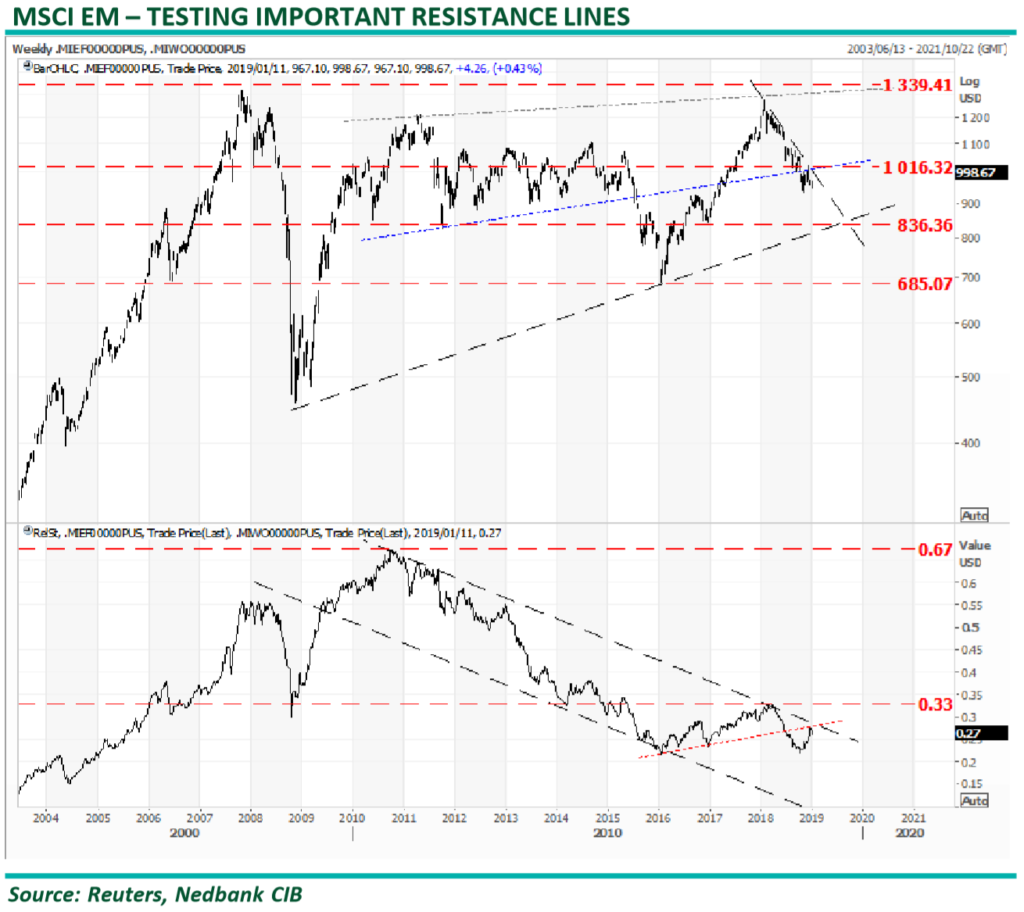
The MSCI EM has been in a bear market since the start of 2018. The EM equities bottomed out, along with the EM currencies, during 4Q18. However, EM equity markets failed to rally, as the US equity markets came under pressure. • The EM index is currently trading against an important resistance line at 1,016. It is crucial for the bull story that the EMs must accelerate through this resistance in the near future. • If the index fails at current levels, it would project further downside to the support line and previous low at 836. The JSE Top-40, in USD terms, is already consolidating against an equivalent support line to the 836line. • The bottom panel is the relative of EM over DM equities performance. The relative rallied within this well established bear channel during the riskon phase of 2016 and 2017 but turned down sharply during 2018. We believe the latest rally will turn out to be a goodbye kiss against the red neckline and expect the relative to turn down from current levels.