
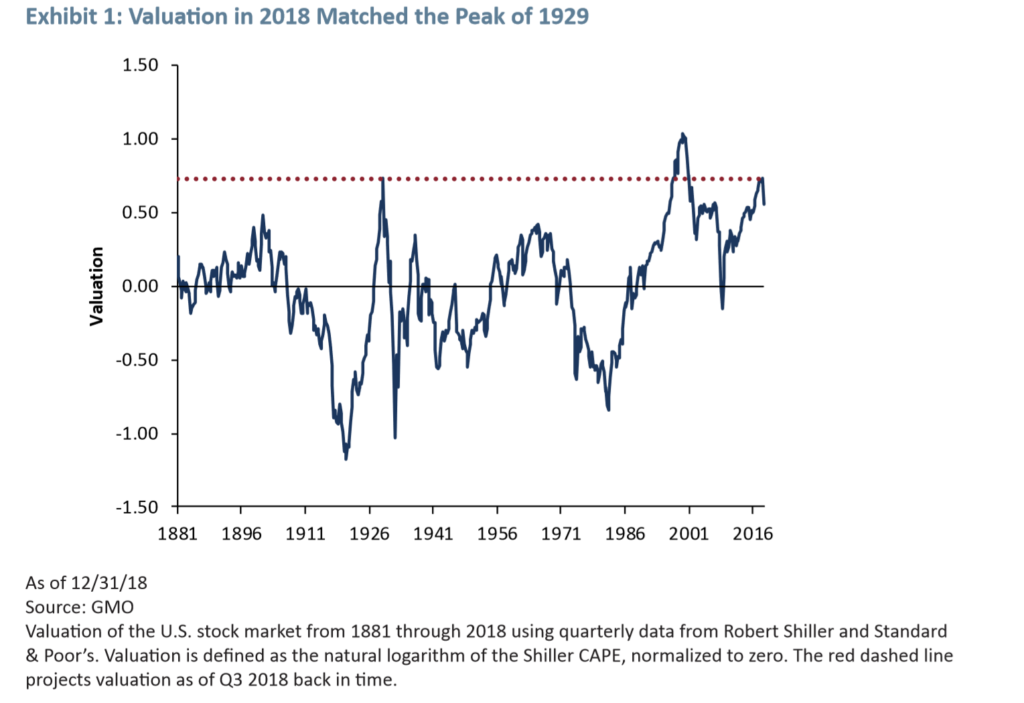
GMO writes in a white paper …Is the U.S. Stock Market Bubble Bursting? A New Model Suggests “Yes”
The paper warns “Own as little U.S. equity today as your career risk allows”
China liquidity injection at a record level. Inconsistent with a strong and healthy economy.

Probably a chart you should see

Last year the Indian government blamed the Rupee weakness on the US dollar .This year they might blame Rupee weakness on something else, but it is the incorrect monetary policy followed by the Reserve bank of India… Danielle

Care to comment on which side is the Indian monetary policy erring on? Too tight or too loose (for the Rupee)? Looking at 20 day data has very little utility – where does Rupee stand on yoy basis (or at least qoq basis)?
wherever the comments are from outside economists I write their name in bracket. I did show that chart because in the face of falling crude , indian currency underperformance was stark and moreover this is the quarter where we get highest amount of foreign currency inward remmittances
Tx. Point to be noted – crude has risen from its slow ytd. Still trying to understand monetary policy though. Looking at real rates, policy seems tight. But looking at foreign flows, and current 3m/2yr rates, rbi seems behind the curve. What is your thought?