Forget rate hikes. Is the FED already too late in cutting the rates.
The BLOOMBERG Bankruptcy Index (BNKRINDX) is +155% YTD.

German 10Y (BUND) looks sick. I think it is headed for negative yield again coupled with parity on Euro/Dollar.

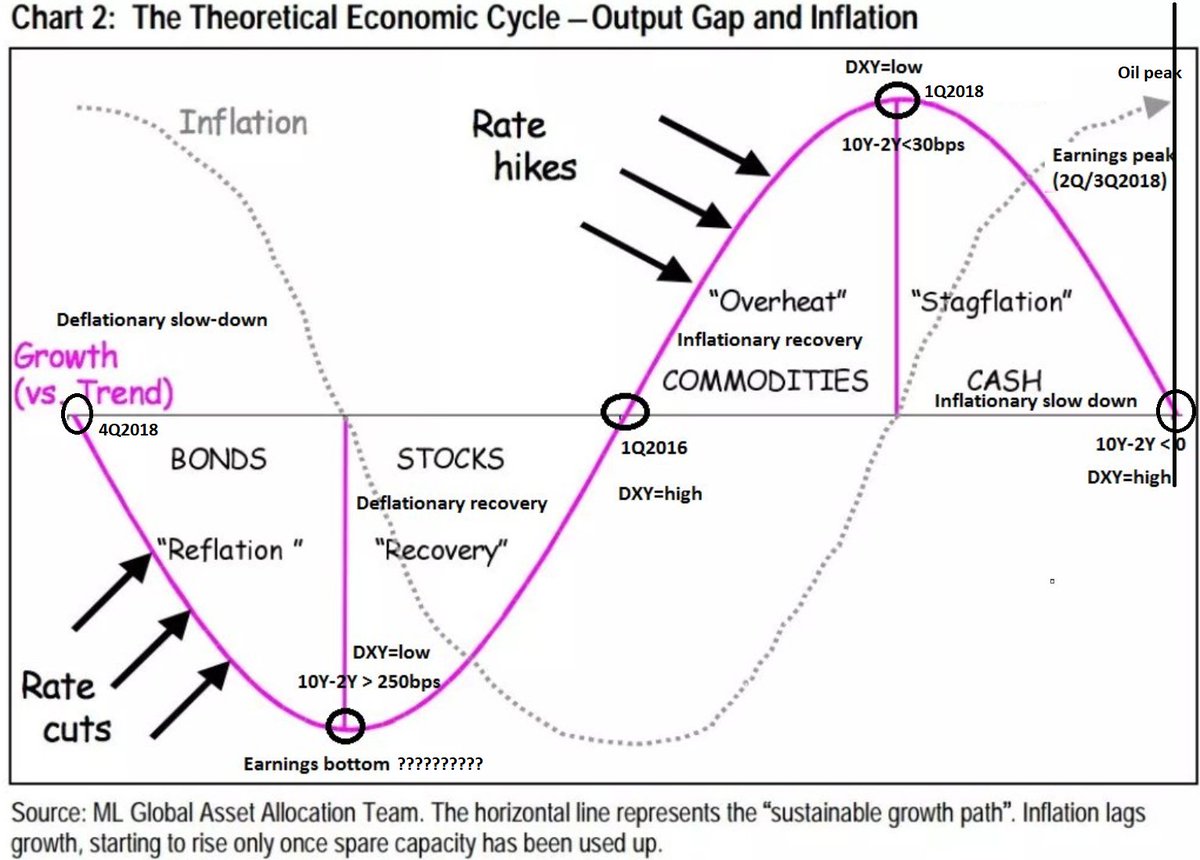
So, as expected in June2018 prediction oil has peaked around 3Q2018, so inflationary expectations. Earnings have peaked around 2Q/3Q2018 with much weaker expectations for future. We are entering rate-cuts period and market expects to go into recession starting 1Q/2Q2019..@analyst_G
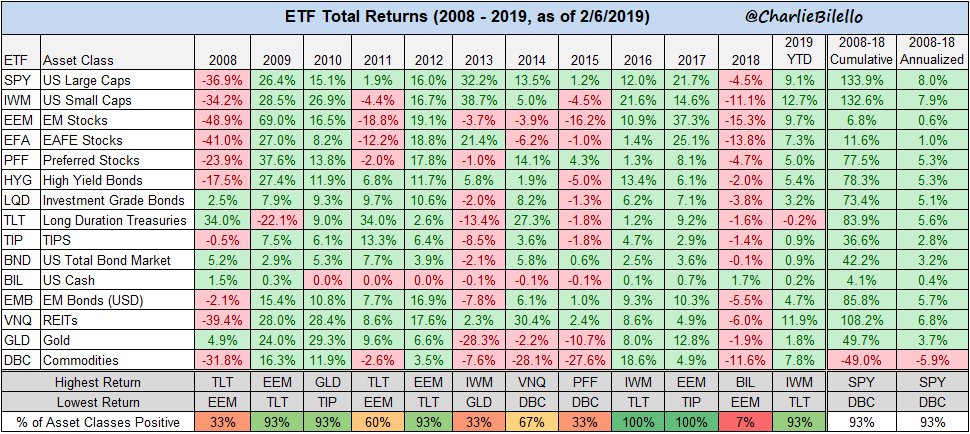
In 2018, out of 15 major asset class ETFs, only 1 finished positive (Cash). In 2019 thus far, only 1 is negative (long-term Treasuries)… TILL NOW
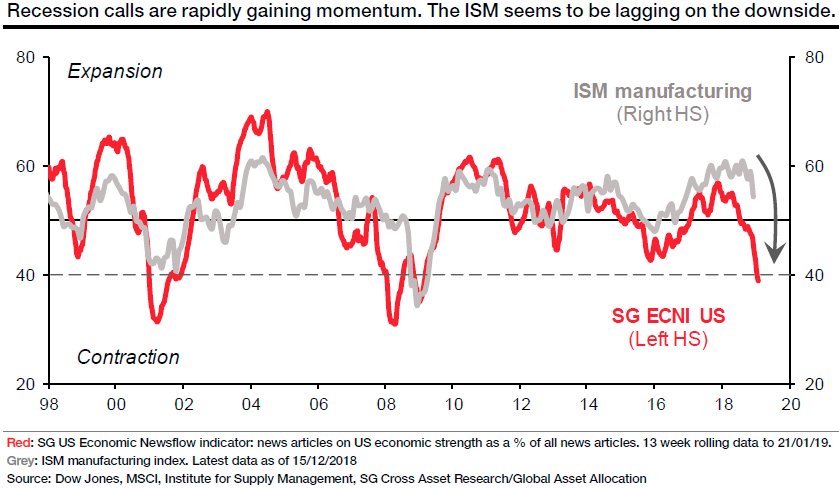
Severe damage to global growth has been spotted – prepare for a rough ride in the months ahead. I don’t think the policies were/are in place by CBs to counter this rapid slowdown. Any monetary policy maneuver by CBs work in 4 to 6 months lags. Alastair Williamson
I will Gladly will take the other side of this

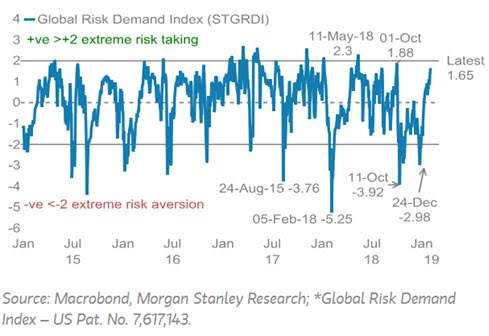
Risk appetite soars….
Almost 40% of the yield curve is now inverted from the 30-year to overnight Fed Funds Rate. This is the same level as the start of the Tech Bubble and Housing Bubble collapses in 2000 & 2008 The debt market knows all. Via @TaviCosta

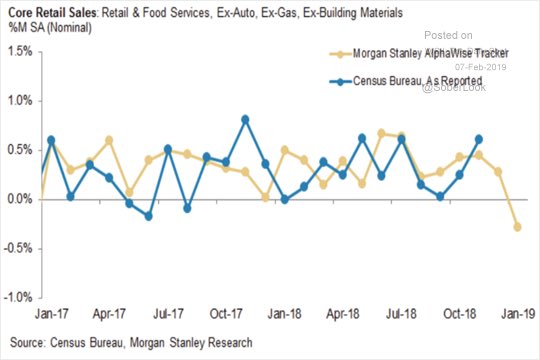
After a relatively strong holiday shopping season, retail sales weakened sharply in January…see @MorganStanley retail sales tracker @SoberLook
Hey,
Enjoying the “Charts that Matter” Posts. Your site is a hidden gem. I found it by googling Macroinsiders PDF and found the Bubble-Watch pdf by Julian Brigden. I assume you’re a Realvision subscriber?
Cheers