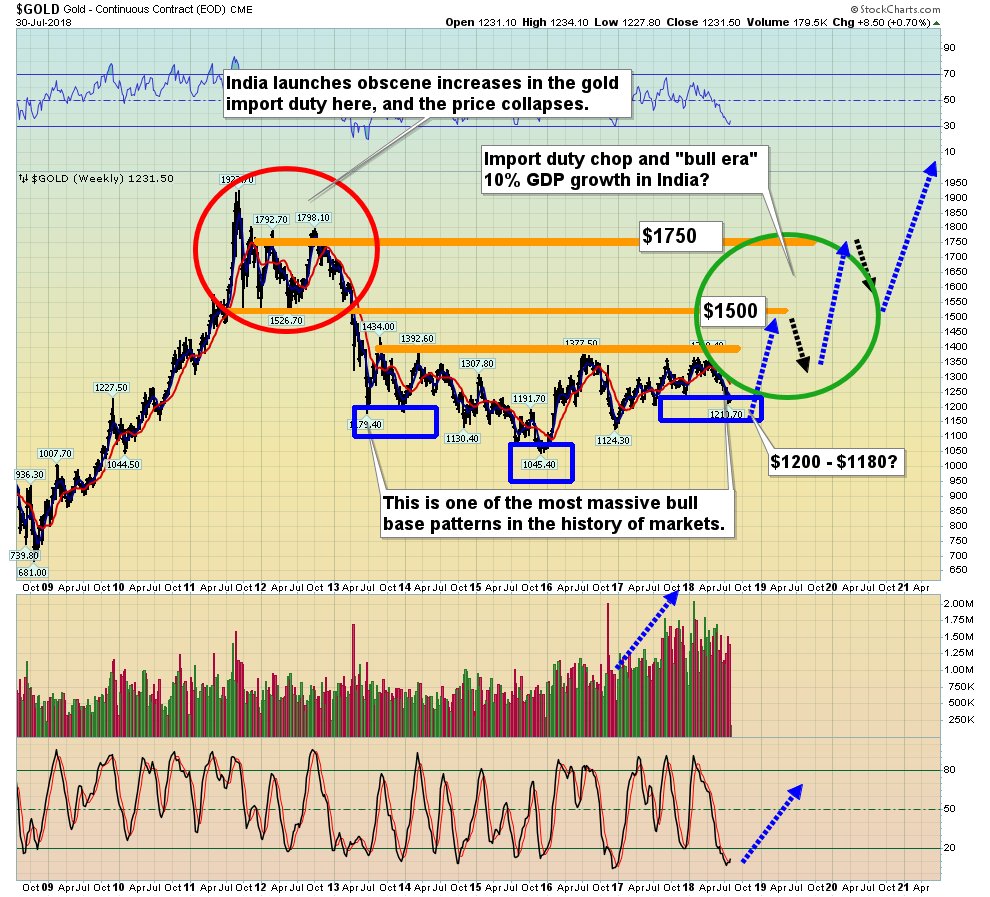
Edward Gofsky write “Big Picture, this is a great chart of the bullish scenario for gold . I am personally waiting until gold gets over $1400 and silver over $21 before I get aggressive. If this does play out in the future it could be a massive 10 year {C&H}“
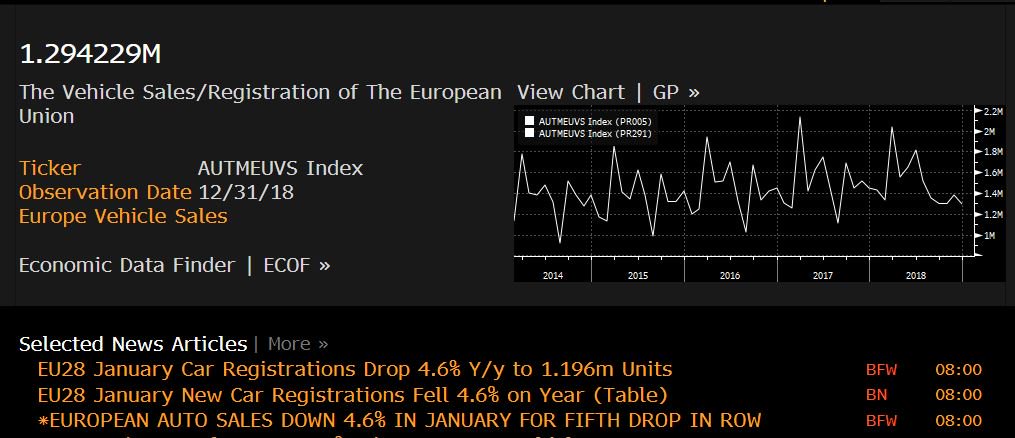
Eurozone slowdown. This is what the European Commission called “robust recovery”? European car sales plummet in January after five months of bad data.
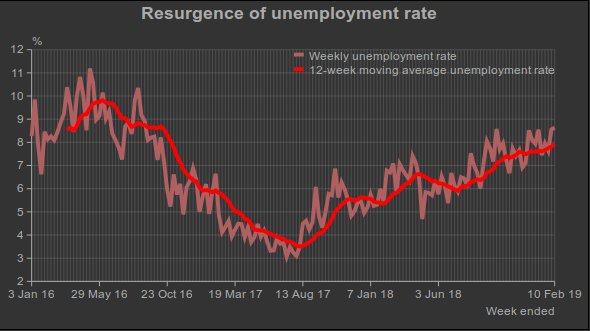
India Kissing Goodbye to Demographic Dividend- CMIE
India’s unemployment rate continues to rise. It has been rising steadily since July 2017 when it had reached its recent low of 3.4 per cent. The relentless rise in unemployment led to it peaking at 7.4 per cent in December 2018. Then it fell to 7.1 per cent in January. But faster-frequency estimations such as the weekly estimates and the 30-day moving average suggest a resurgence of the unemployment rate in February.https://bit.ly/2DuBWzd
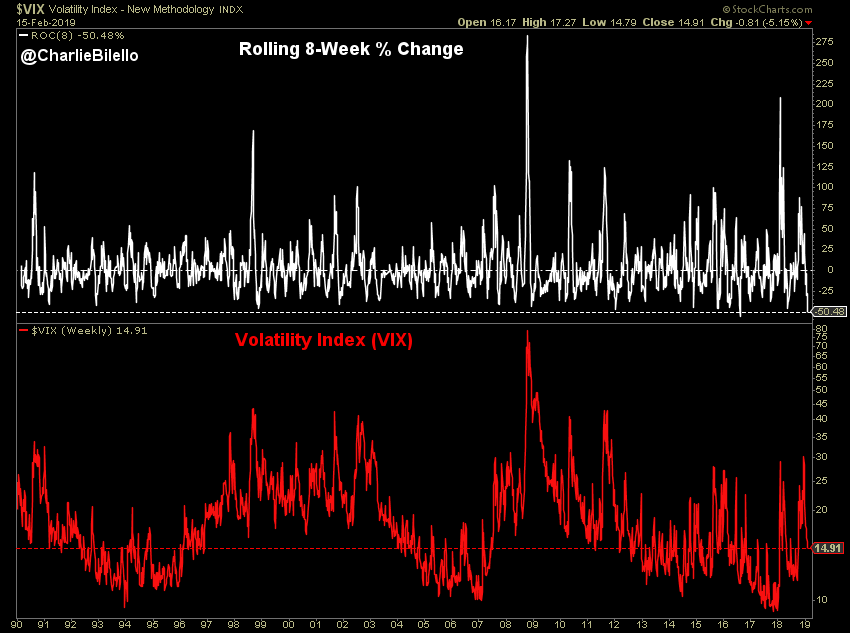
The Volatility Index has been cut in half over the past 8 weeks, the 2nd largest 8-week decline in its history.
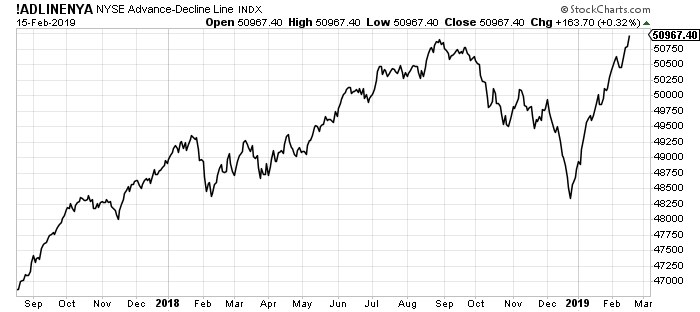
But the breadth is too strong. Probably the best breadth in Developed world market. What am I missing?