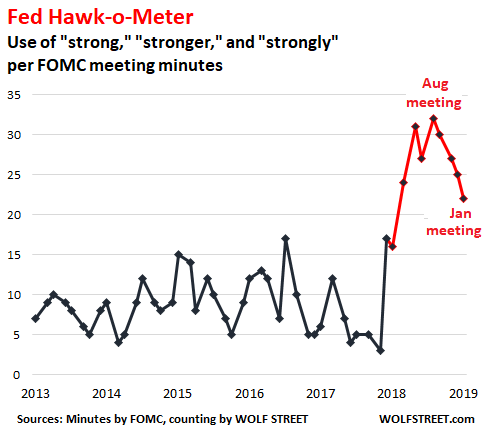
In the minutes of the January 29-30 meeting, released this afternoon, the mentions of “strong,” “strongly,” and “stronger” edged down for the fourth meeting in a row, this time by three points, to 22. The Hawk-o-Meter has now backed off quite a bit since the August 2018 high – when the Fed was rubbing it in that it would raise rates four times in the year – but it is still in outlier territory and redlining.
The G7 GDP volatility continues to trend lower.

A UBS tracker puts global growth at the weakest in a decade, with Germany & Japan seeing the biggest slumps in manufacturing

Nice chart showing the money companies spent during last 10 years on CapEx ($6.4T), buybacks ($4.9T) and dividends ($3.4T)
