By Apra Sharma
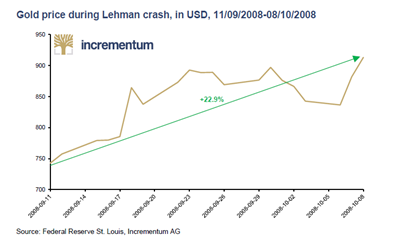
Money is most vulnerable to level of public trust. Federal Reserve under Paul Volcker restored confidence through a restrictive monetary policy that led to high interest rates which is still unparalleled today. In 2008 – 09, the tides turned as global credit crisis eroded confidence which was intact since 1980s.
As monetary asset, gold can look back on asuccessful five-thousand-year history in which it was able to maintain its purchasing power over long periods of time and never became worthless. Gold is the universal reserve asset to which central banks, investors, and private individuals from every corner of the world and of every religion and every class return again and again.
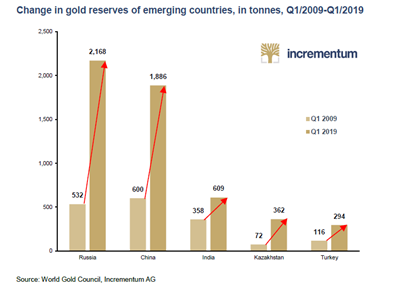
The steady buying of gold and the repatriation of central bank gold clearly indicate growing mutual distrust among central banks. An example is the recent tenfold increase in the Hungarian gold stock. The official announcement of the Hungarian central bank on its first gold purchases since 1986 states: “In normal circumstances, gold has a confidence-building feature, i.e. it may play a stabilising role and act as a major line of defence under extreme market conditions or in times of structural changes in the international financial system or deep geopolitical crises. In addition, gold continues to be one of the safest assets, which can be related to individual properties such as the limited supply of physical precious metal, which is not linked with credit or counterparty risk, given that gold is not a claim on a specific counterparty or country.”
Commodities remain the exception and still do not participate in the ‘everything bubble’. The extreme relative undervaluation of commodities compared to the stock market becomes evident in the next chart.

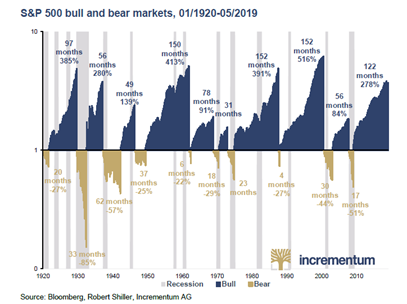
As long as the equity market party continues, trust in the credit-financed growth model seems intact. But how sustainable is such an upswing?Popular trust in the idea that monetary policies can sustain growth and employment and that central banks have inflation under control will be seriously tested in the next recession.
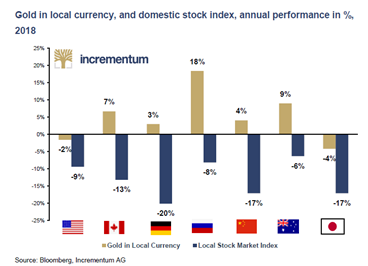
In terms of performance, USD terms gold generated an unsatisfactory return in 2018, declining by 2.1%, while it gained 2.7% in euro terms.
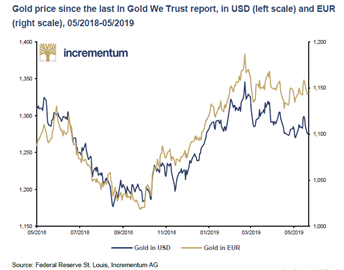
The world gold price is now not too far from its October 2012 high of 1,836 USD (monthly average). Spread between world gold price and the gold price in US dollars has tightened since 2017.

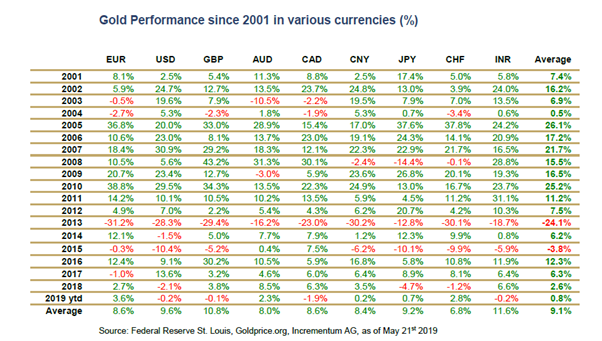
2018 as a whole was positive for gold in most world currencies. Only the (supposed) safe-haven currencies (USD, CHF, JPY) recorded (slight) losses. The average performance in this secular bull market remains impressive. The average annual performance 2001 to now is 9.1%. Despite significant corrections, gold was able to outperform virtually every other asset class and above all every other currency during this period. Since the beginning of 2019, the development has been relatively unspectacular. The average plus is 0.8%.
The chart also provides impressive evidence that it is advisable to regularly accumulate gold (“gold saving”) by harnessing the cost-average effect.
A strong US dollar does much less damage to the gold price than a weak US dollar does to gold. Gold always moves out of countries whose capital stock is declining and flows into countries where capital accumulation is taking place, the economy is prospering, and the volume of savings is increasing.
However, it appears that signals of a US recession are slowly increasing. The Federal Reserve’s recession indicator currently indicates a recession probability of 27.5% for April 2020.
The S&P 500 was comfortable at 9% in the first three quarters of 2018, before a sell-off started in October and culminated in December emerging as its weakest performance since the Great Depression. This seems particularly significant as Q4 usually has the best seasonal performance. On a sector basis, only 7 of the 121 industry groups in the S&P 500 reported positive performance. At the top: gold mining stocks gained 13.71%!
This comparison clearly confirms gold (and mining stocks) as a portfolio stabilizer.Gold performed poorly compared to the S&P 500 in those years when the S&P posted very high gains. Gold, on the other hand, recorded the highest relative gains compared with the S&P in those years in which the S&P did poorly – with the exception of the special year 1979.
Rising inflation rates generally mean a positive environment for the gold price, while falling but positive rates (disinflation) represent a negative environment. Rising price inflation coupled with mounting economic risks would probably mean the perfect storm for gold: stagflation. At the moment, however, the consensus view is that this seems an almost impossible scenario.
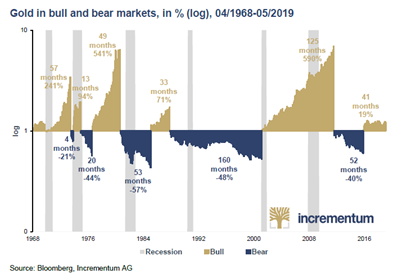
Like any price, the price of gold depends on the assessments of market participants. Gold, in its capacity as a hedge against crises oftrust is directly dependent on the level of public trust. The value of the US Treasury’s gold holdings has historically traded in a band between 20 and 140 percent of the monetary base. Currently, the percentage stands at 9%, which clearly indicates an extreme undervaluation of gold. If you look at the gold bull markets of the last 50 years, you can see that even in its weakest upward period, gold was able to gain 71%.
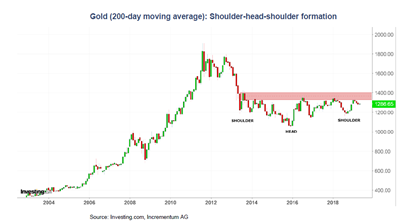
Technical analysis shows that the impulsive rise from USD 280 to USD 1,920 has been corrected since 2011. As part of this corrective movement, an impressive inverse shoulder-head-shoulder formation has been forming since 2013, which could explosively resolve upwards.Currently, however, the price has already failed several times on the neck line in the resistance range of USD 1,360-1,400. If the gold price were to break through this resistance zone, the next target would be almost USD 1,800, as calculated on the basis of the distance from the head to the shoulder line, projected upwards.
A rising stock market usually goes hand in hand with a falling gold/silver ratio, i.e. an outperformance of silver compared to gold. However, in 2012 this correlation broke down.
The silver price could also be interpreted as a sentiment indicator for gold.Strong bull markets for silver usually only happen in the course of risinggold prices, because investors seek higher leverage and end up with mining stocksor silver. With the gold movement still meandering, silver is likely to wait for thenext breakout attempt of the gold price before gaining trend strength and relativestrength to gold. The ratio of 88 clearly shows that sentiment in the precious metals space is currently at rock bottom.
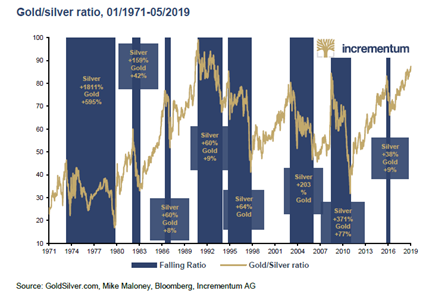
The above chart shows that the G/S ratio is subject to large fluctuations over time. Around 1980 we can see a low point at a ratio of 16, while in 1991 it almost reached the 100 mark. At the moment, it seems that the ratio wants to test the highs from 2008 at around 87. The risk of price declines appears to be limited at this historically extreme relative valuation.However, silver remains dependent on the price movements of gold, and bullish momentum seems unlikely in the medium term.
The past 12 months have shown that the seemingly invulnerable economic upswing has begun to crack deeply.The worldwide boom, driven by low interest rates and a ceaseless expansion of credit and money, now stands on feet of clay. In our opinion, the currentlyhigh trust granted into the skills of central bankers and the supposed strength ofthe US economy are the main reasons for the somewhat weak development of theyellow metal. If the omnipotence of the central banks or the credit-driven recordupswing are called into question by the markets, this will herald a fundamental change in global patterns of thinking and help gold to old honours and new heights.