WSJ: “Families Go Deep in Debt to Stay in the Middle Class”
This is a great chart on growth of assets and Liabilities. I think this will be true for lot of developed countries.

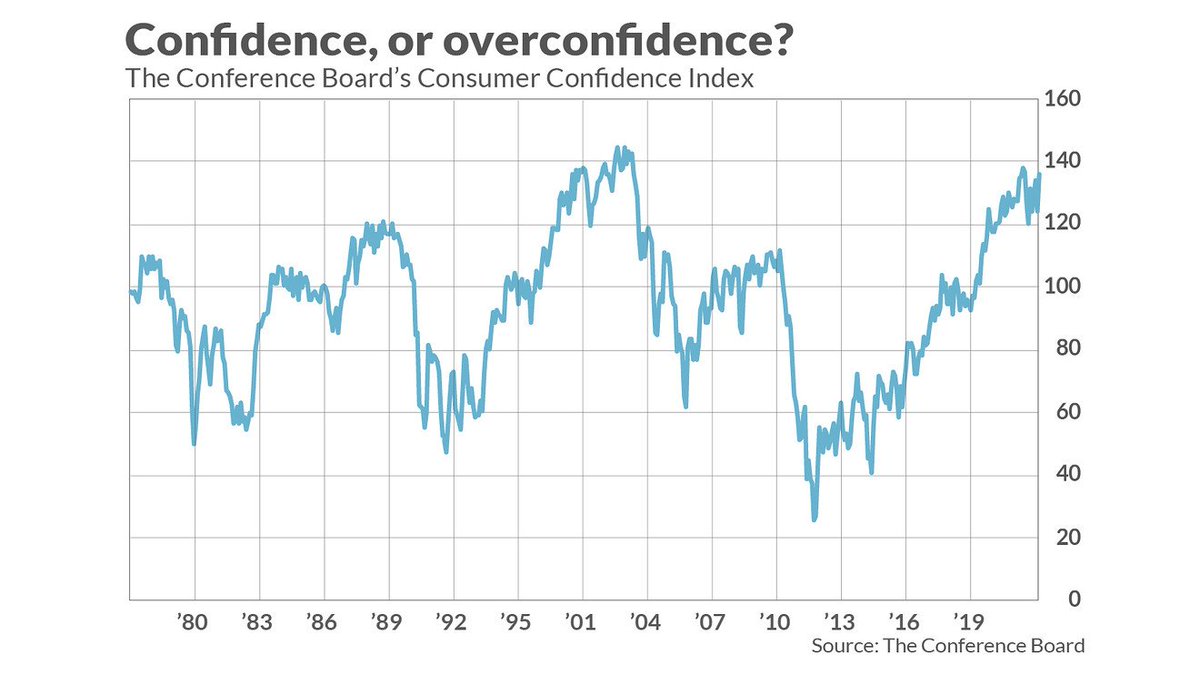
Lagging indicator
“This chart plots the CCI’s monthly readings back to 1977. The highest readings occurred in early 2000, at the top of the internet bubble. I need not remind you what came next.” (link: https://on.mktw.net/2SY8ubU) on.mktw.net/2SY8ubU
why equities are resilient
With interest rates falling and dividends ticking higher, income-producing stocks will be a good hunting ground for fixed income investors… (link: http://bit.ly/2ZoKlO8) bit.ly/2ZoKlO8 – B. Rollins @bespokeinvest
@bespokeinvest: Nearly half of S&P 500 components have a higher yield than the 10-year, and 25 yield more than 5%.

J.P. Morgan thinks the 10-year U.S. Treasury yield could be headed toward zero…

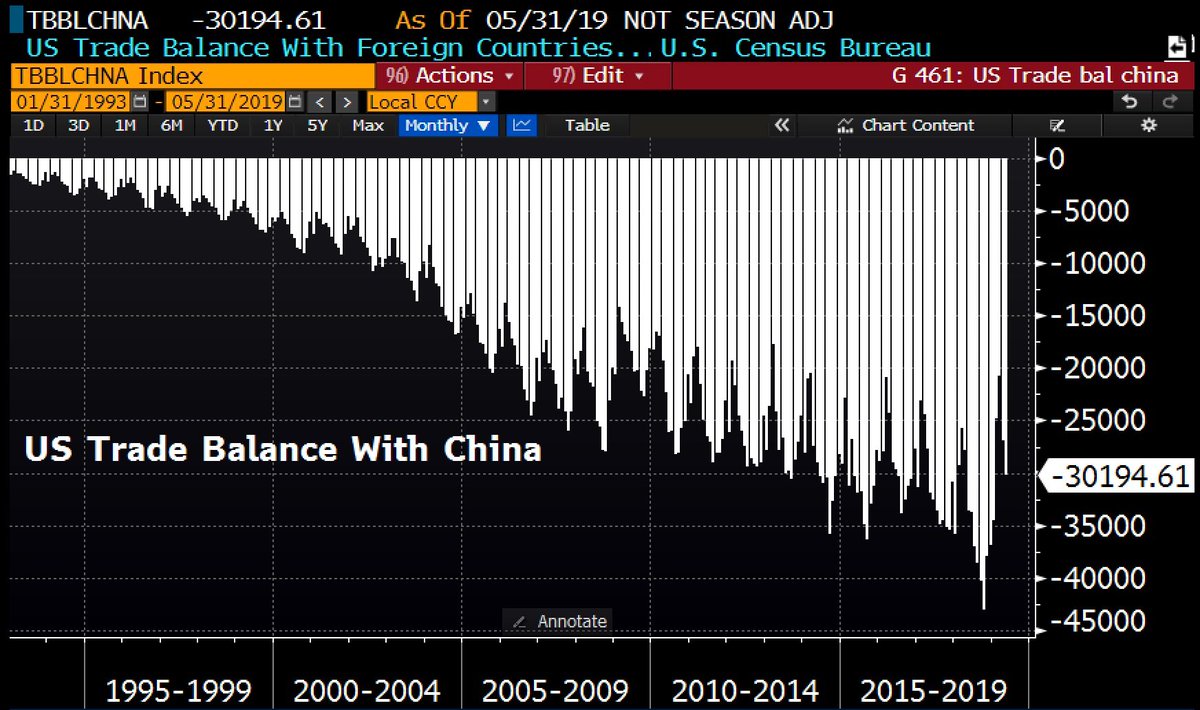
Tariff Man strikes again
US President Trump says US to place new 10% tariff on remaining $300bn in Chinese imports amid slow-moving trade talks, effective Sept 1.