Excesses

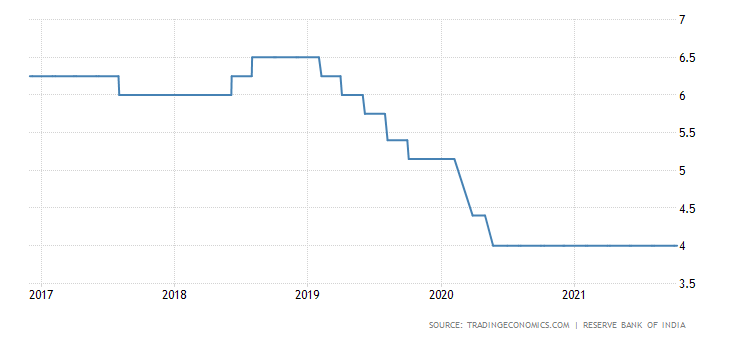
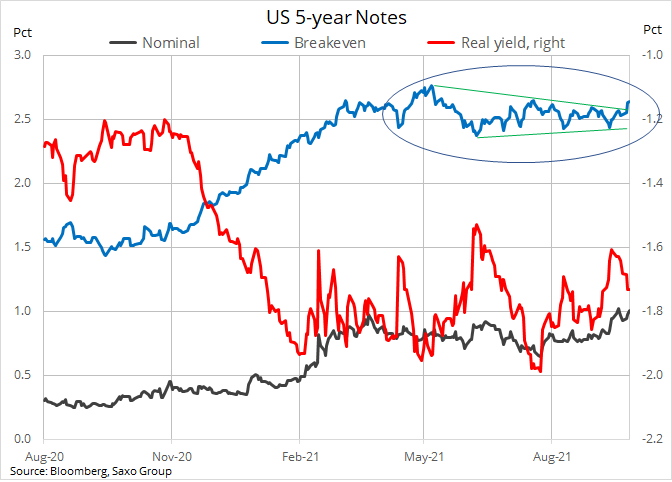
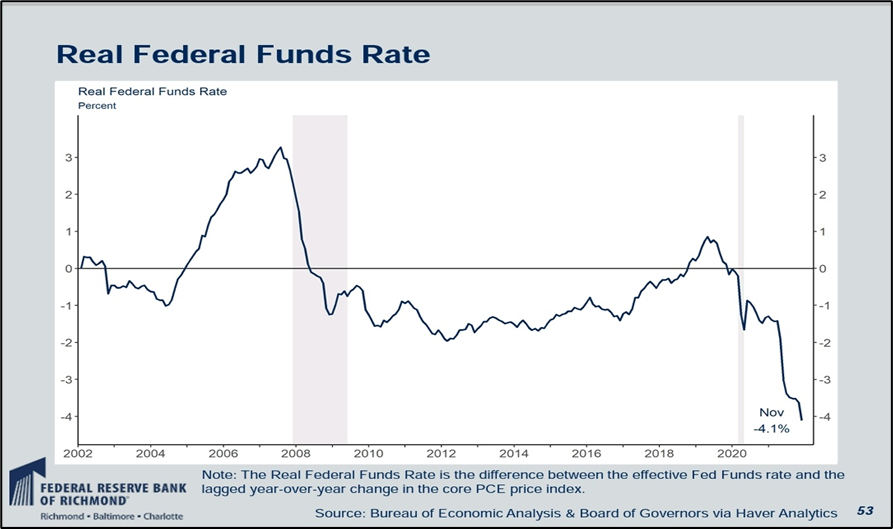
The risk-free rate is very low. As the joke goes, the risk-free return has turned into return-free risk.

How Global Markets have moved in 2021?

  • Total assets of the five major central banks (Fed, ECB, BoJ, PBoC and BoE) rose from at an average annualized rate of 32% for each of past two years.
  • US M2 money supply has increased at an annualized rate of 20.2%, for nearly two successive years, and now stands at over 90% of GDP, having started the millennium at 44.4% of GDP.
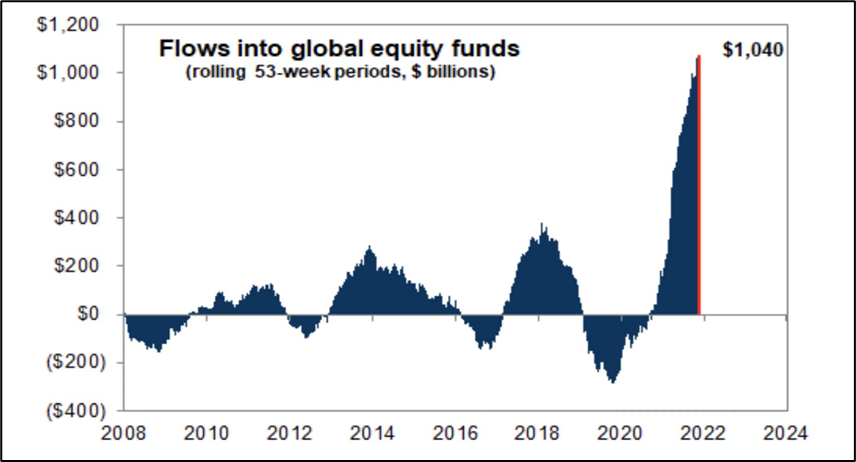
  • Resultant effect of excess liquidity – Global inflows into equities have surpassed $1tn in the past year, exceeding the combined total from the past 19 years – Goldman

US takes the cake in Equities

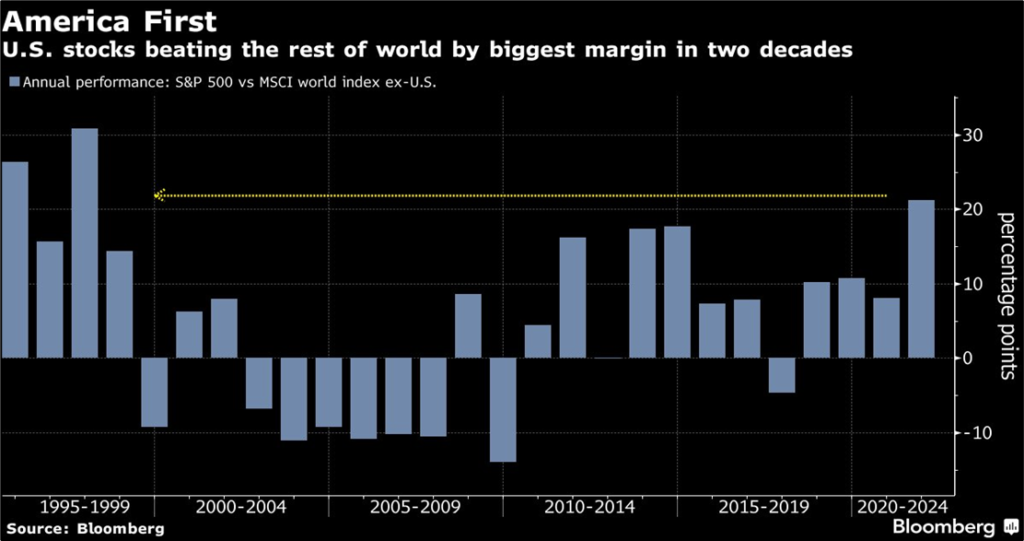
U.S. was the winner amongst major nations attracting maximum investor inflows; clearly driven by massive liquidity infusion and recycling of flows to equities in a negative real rate environment.

US stocks are beating rest of world by most in 2 decades. The S&P 500 has surged 25% YTD compared with 3% gain from the MSCI All-Country World ex-US Index.

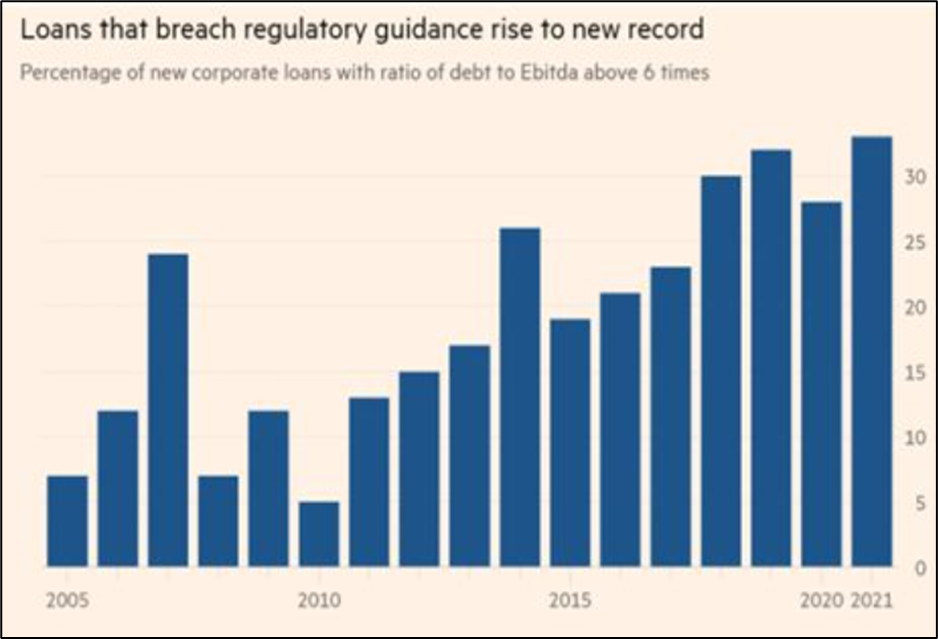
Capital misallocation at its highest level

Excess liquidity is keeping the zombie companies alive

There is a twist in the tale

The U.S. equity market has outperformed the rest of the world dramatically, since the last peak of 2008 on an index basis. It has gone from 100 to over 300. Whereas the world index just went from 100 to about 115.

Here comes the differentiator – FAAANM (Facebook, Alphabet, Apple, Amazon, Netflix and Microsoft) stocks from early 2008 onwards have gone up 14-fold; whereas, the other 494 S&P 500 stocks went up from 100 to 215. World markets haven’t seen anything like it and not even Japan was as excessive.

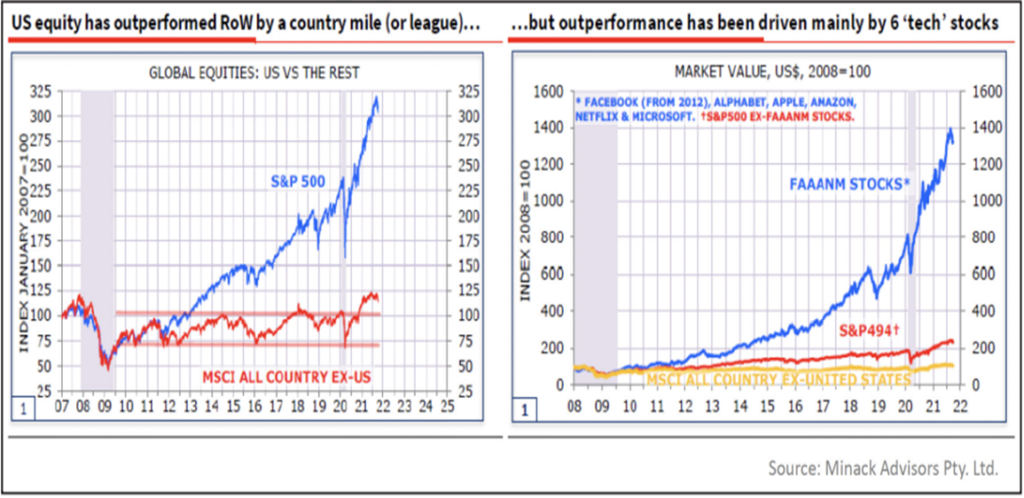
Money (excess liquidity) moved into US tech rather than US Government bonds

What happened to SPX back in 2018 when real fed funds went positive? After peaking in Oct’2018, markets corrected ~17% till Dec’2018 in response to rising real interest rate.

……but with a pinch of salt

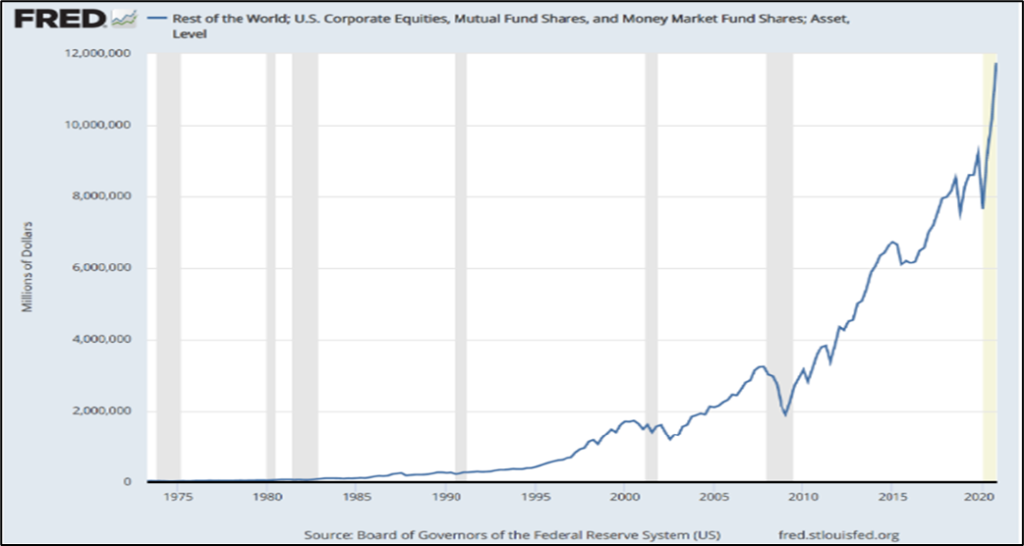
Historically, U.S. Treasuries (USTs) have been the go-to asset of foreigners to hedge global portfolios in/for turbulent times. In March 2020, this was violated and since then foreigners continued to sell USTs. Infact since 3Q14, foreign/international investors have stopped buying sufficient USTs, buying only ~$900 billion of $11 trillion in UST issuance in that time.

So, what changed the world to move away from ‘risk free asset’ (or call it return free risk)

Global Central bankers (to manage reserves) have been turning to new (riskier) investments to compensate for collapse in bond yields. Historically, foreigners bought USTs to sterilize USD outflows & maintain currency stability; but in recent years (specifically post 2020 UST illiquidity crisis), they’ve started switching to U.S equities to sterilize USD outflows.  

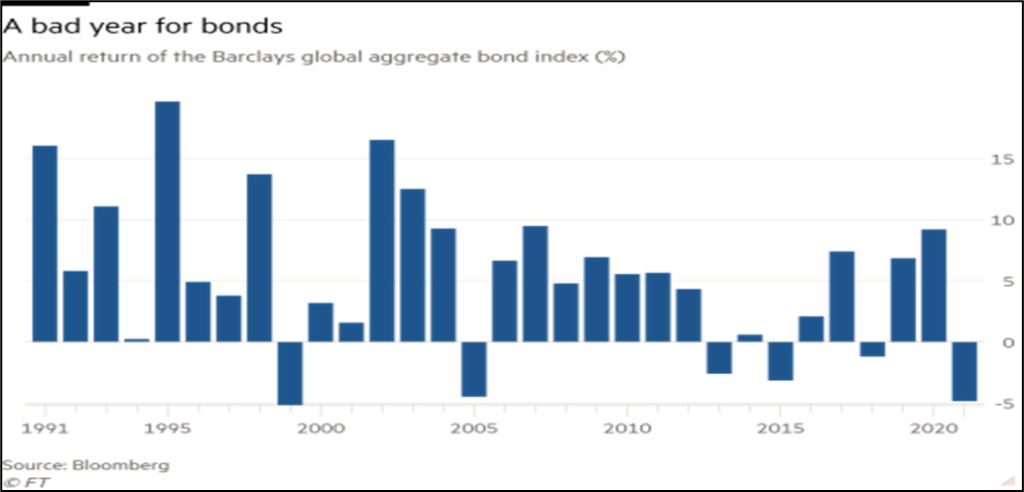
Making it an extremely volatile and negative yield for Bond holders

Barclays global aggregate bond index: -4.8%. Treasury investors are losing more money than they have in four decades since 1980s, once inflation is taken into account.

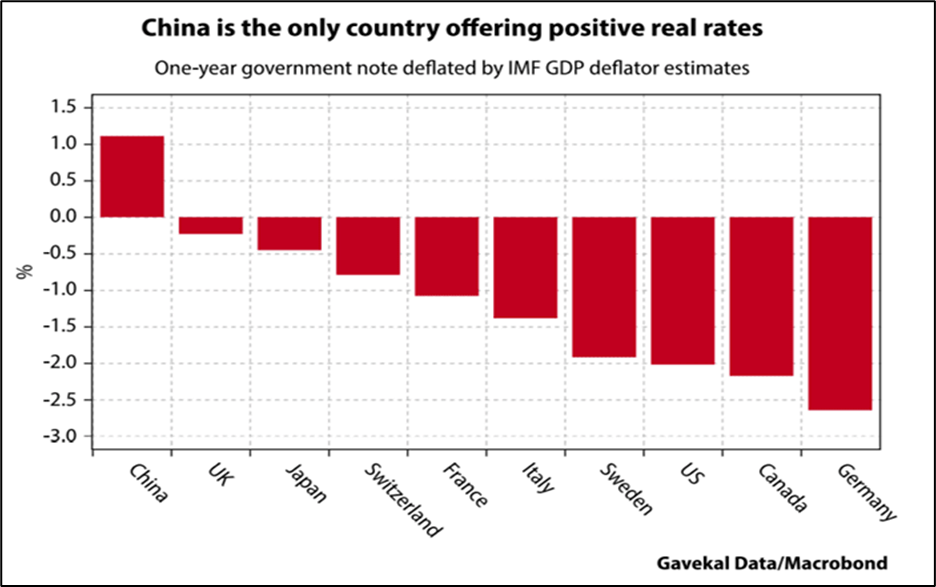
Except China – China takes the cake in Bonds

China is the only major country with positive real interest rate attracting savers since past 2 years. But this is turning to be a nightmare for borrowers/corporates/developers with interest outgo more than the inflation in a looming Debt scenario, leading to defaults. ‘Positive Real rates leads to defaults.’

Is this leading China into easing policy rates?

Still wondering ‘Why’ were markets so strong this year?

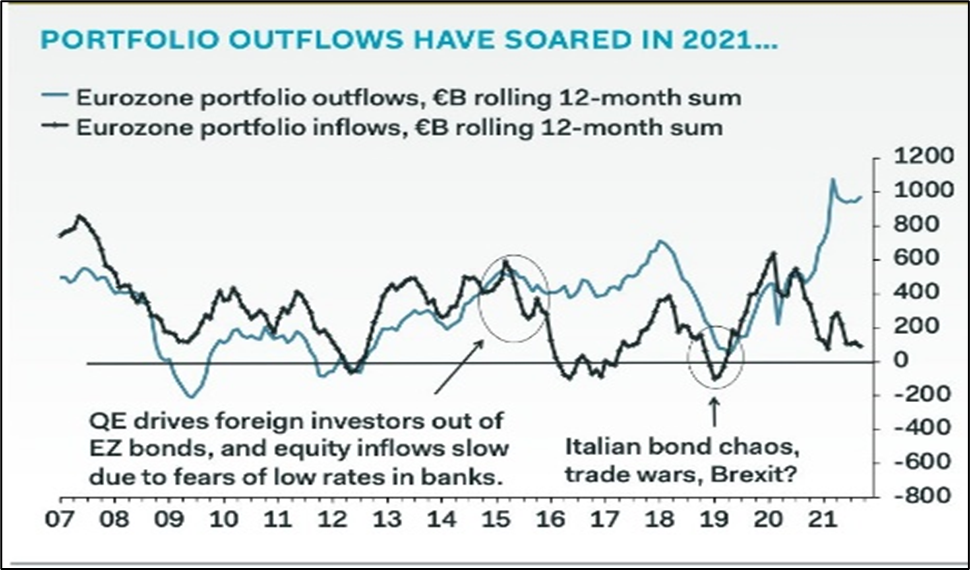
Europeans have recycled almost half trillion in US stocks

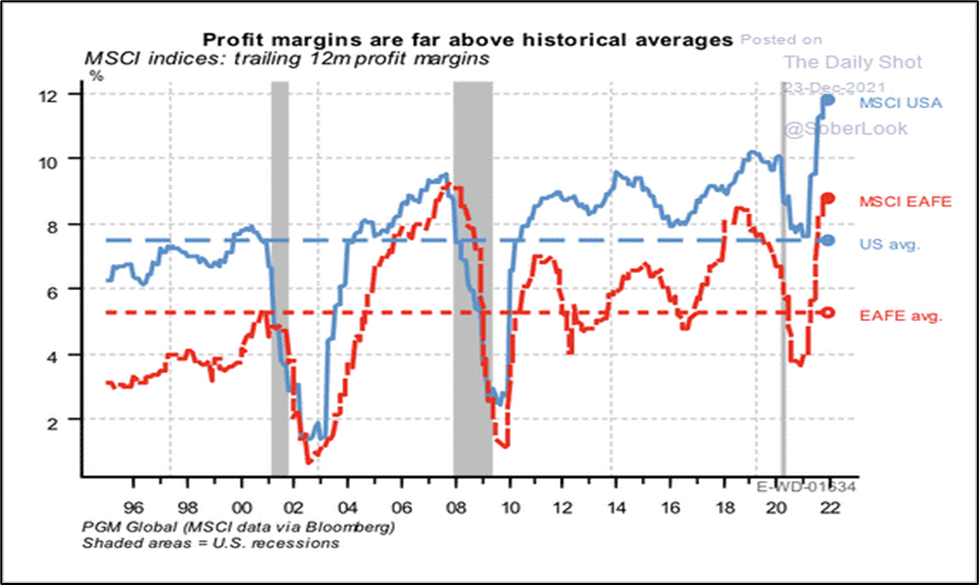
What will normalize these fiery markets?

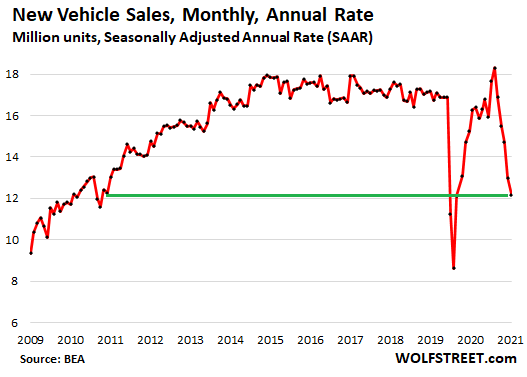
Strong markets have been supported by higher margins. As liquidity tightens and low-cost inventories runoff, we should see margins normalize.
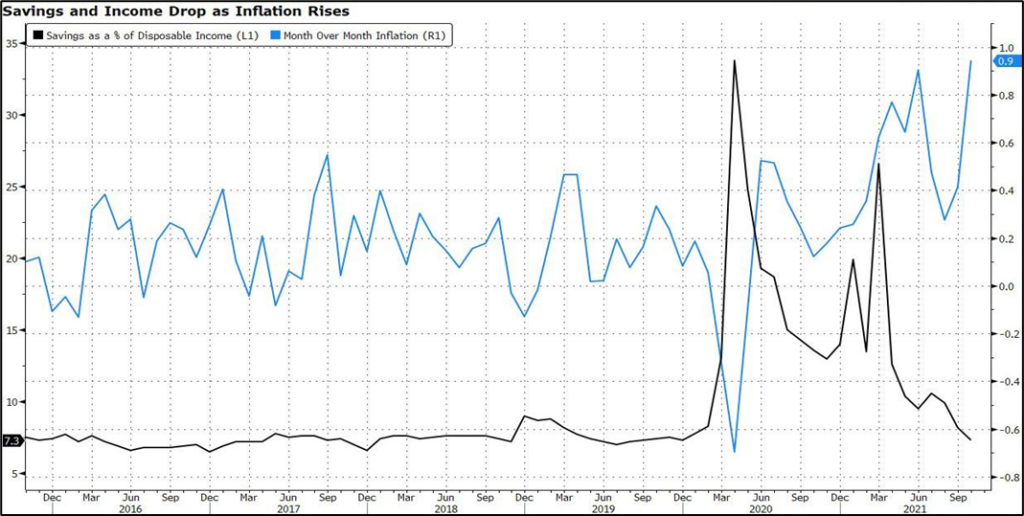
‘INFLATION’

US saving rate is now at pre pandemic levels of 6%. Rising supply side driven inflation coupled with drop in cash reserves has vast implications for the working class and could dampen consumer spending, a large share of economic activity/GDP.

Good Inflation = Demand driven; Bad inflation = Supply driven

Higher inflation is a politically unacceptable scenario, pushing central bankers to expediate the pace of rate hike.

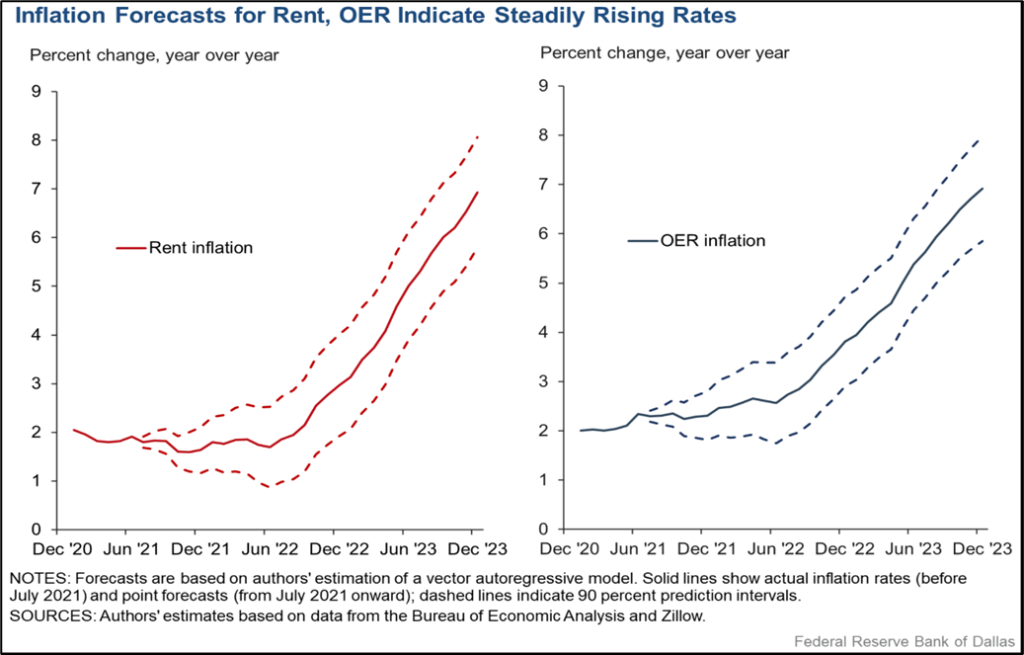
Inflation is moving from financial assets to real economy

Headline inflation might soften next year but Core inflation will keep rising. This is important as core inflation is considered a prime indicator of underlying long-term inflation and impacts rising prices on consumer income & investments. Dallas FED just predicted 7% Rent inflation by 2023. Rents are 40% of US CPI index.

Ultimately, it’s all about ‘Liquidity’ flows

Only thing that will vary amongst nations is the quality of liquidity added to the system.

China easing at a time when world markets are tightening will add “responsible” liquidity and US will withdraw liquidity given inflation fears. This tale of reversing tables will drive volatility across asset classes in the quarters ahead.

What if Liquidity turn into Headwind from Tailwind

Liquidity projections of Central banks warn of a Sharp slowdown in 2022 led by tapering and eventually translating into rate hikes.

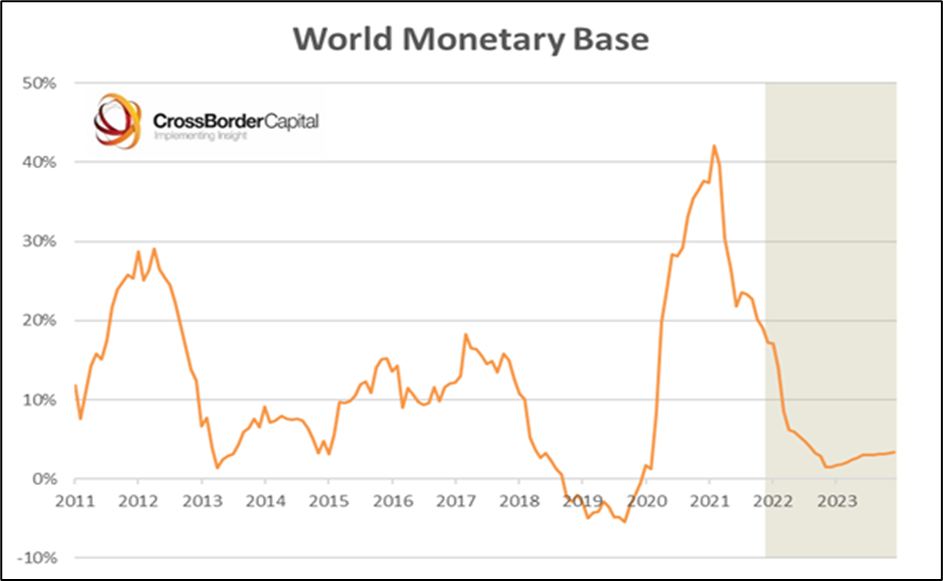
Leading to liquidity situation dramatically different from that seen in 2021

US treasury spend $1.5 T in 2021 by drawing down on cash balances. In 2022, they will rebuild their balances to $500 B. That means they are going to soak out of the system about $400 billion.

A renewed dose of QE or a ‘Powell Put’ seems the inevitable remedy for the next stock market sell-off. In short, future growth of global liquidity has seemingly become institutionalized by these debt burdens.

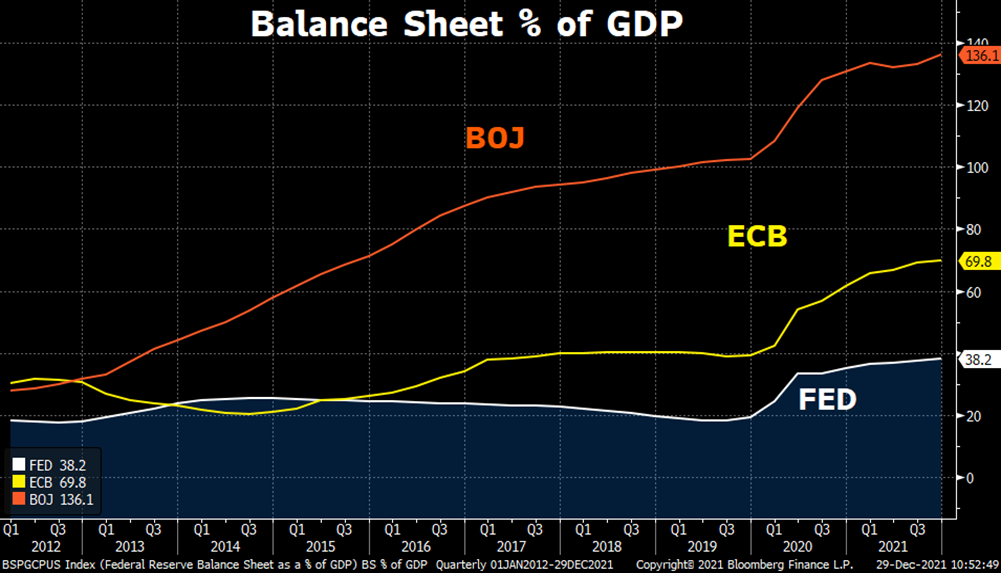
Divergence amongst Central Bankers on Monetary policy way ahead

Significant differences between the US and Eurozone, could open up major policy divergence between Fed and ECB policy over the coming years, with the fed funds rate rising; while, the ECB is not expected to raise interest rates and continue liquidity easing. Interestingly Japan has been growing at the pace of economic output since Sep 2020.

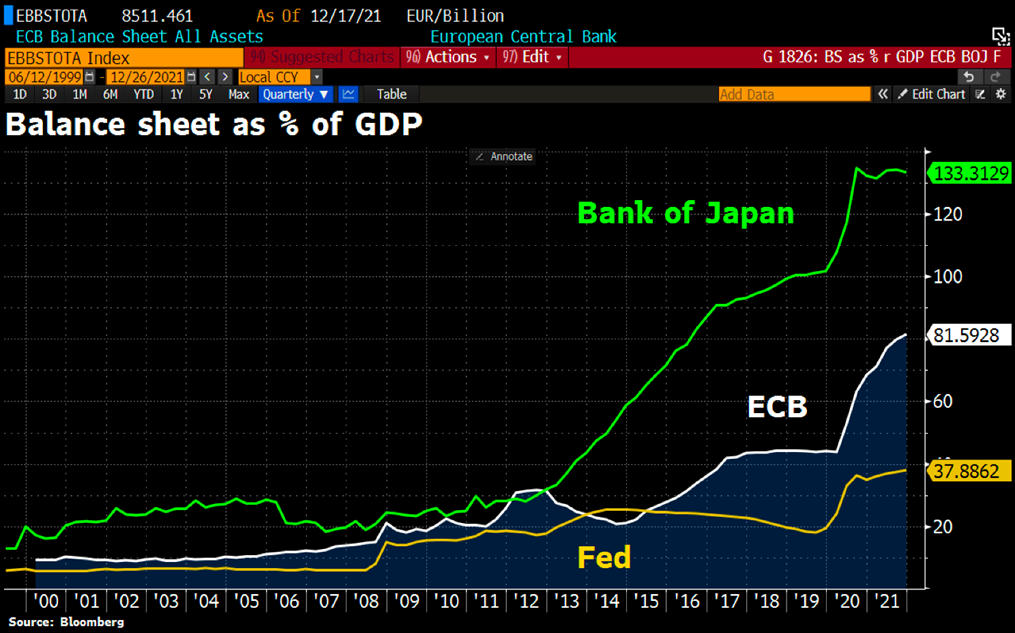
BOJ and Fed have started to flatten out. ECB will start flattening by second half of 2022.

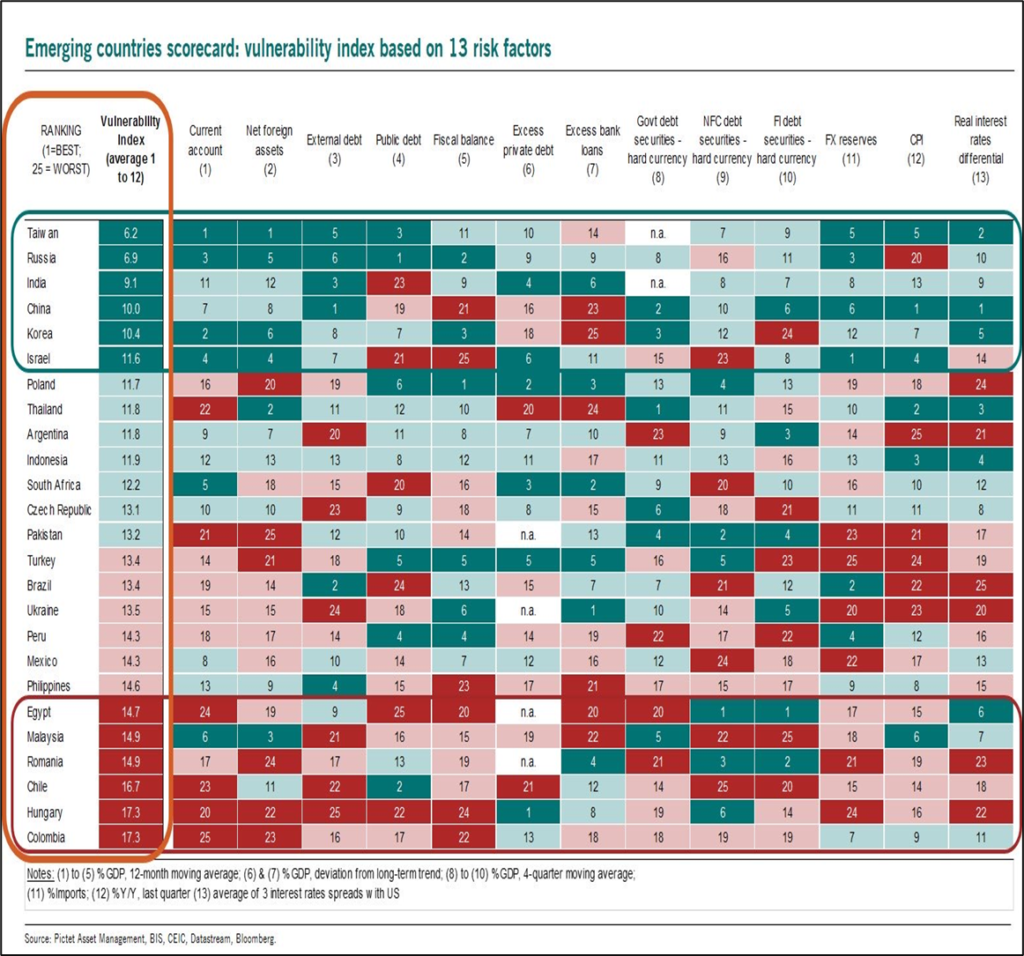
Emerging Markets’ vulnerability to Fed tightening

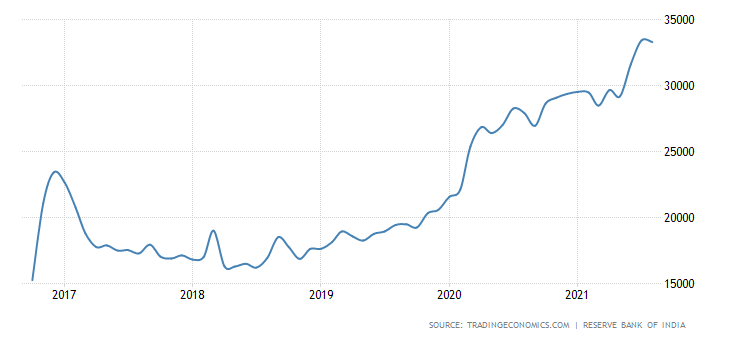
Markets globally get affected when the interest rates are hiked in the US. Amongst all major Emerging markets, India seems to be fairly insulated on the basis of vulnerability index.

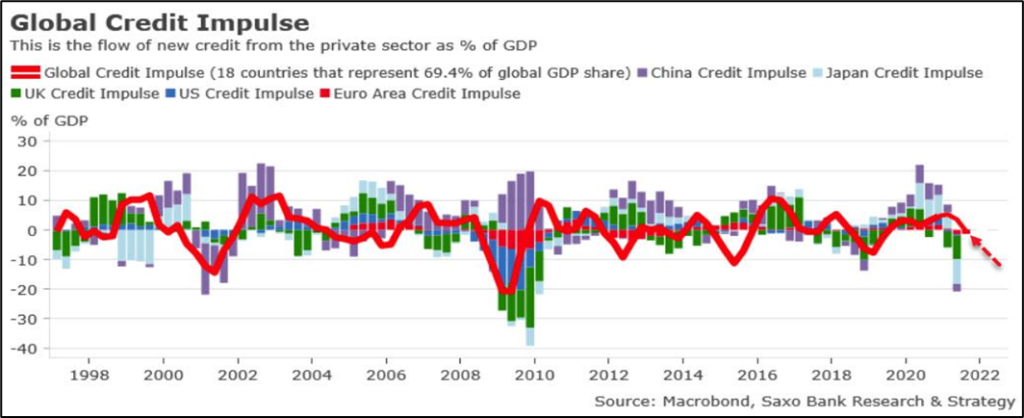
In an era where most economics are tracking a negative Credit impulse

The global credit impulse is now in contraction territory, running at minus 1.3 % of global growth (Saxo bank). When the credit impulse is negative, expect that growth will cool down significantly in the next six to nine months afterwards. Will we see turnaround in credit cycle for countries like China, Japan etc.?

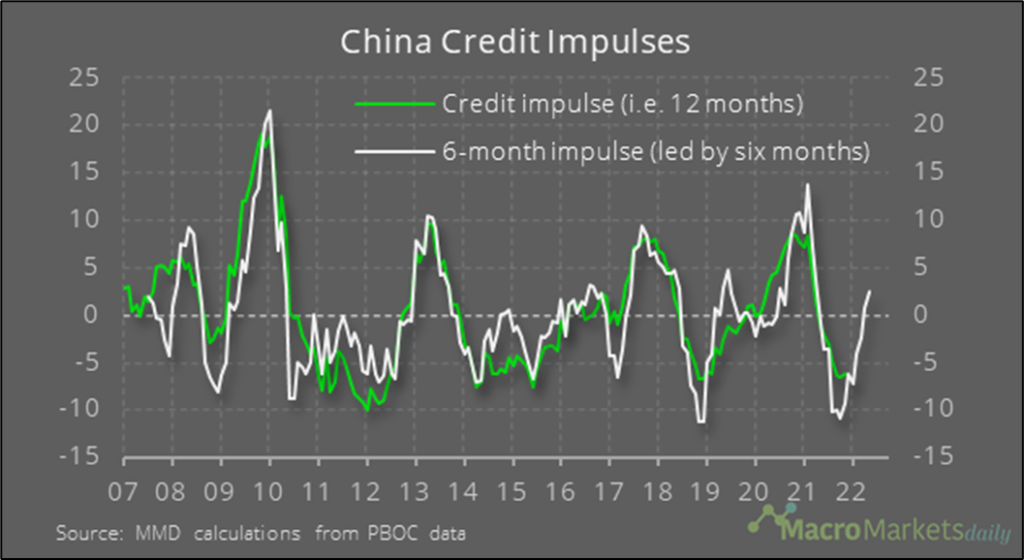
China is slowly showing ray of hope: Positive expected Credit impulse + Monetary easing = ‘Growth’?

Bloomberg’s China Credit Impulse finally ticked higher this November. PBOC has started easing monetary policy and pledged healthy credit growth rates; which is expected to reflect on Global GDP. There is a strong correlation between credit impulse and investment growth, the rise in credit impulse may help push the growth of real investment in the near future.

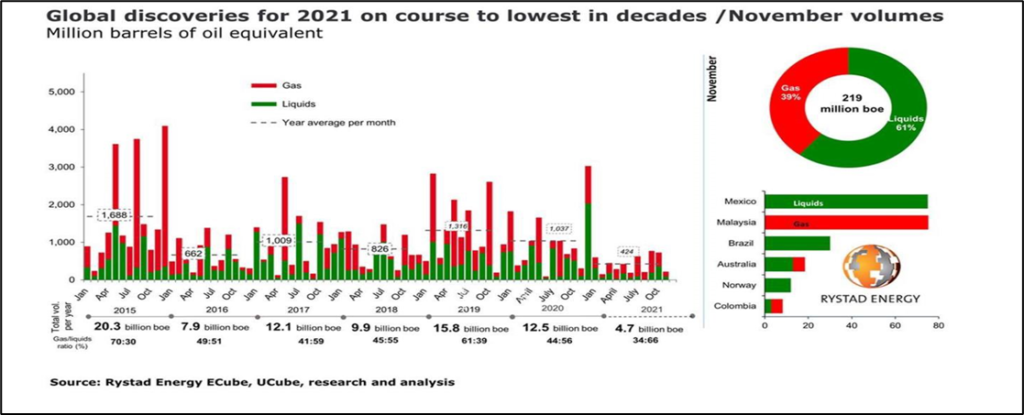
With rising Oil prices acting as a major headwind to global growth

2021 sees oil and gas discoveries sink to lowest level in 75 years. Supply constraints will lead to higher energy prices. Saudi Arabia said global oil production could drop 30% by the end of the decade due to falling investment in Fossil fuels. The resultant could be an ‘Energy crisis.’

What could lead Oil to $200 by 2024? The rise will not be demand driven but due to supply side/productivity issues. We have had a 12-year bear market in commodities, and therefore we have had a tremendous underinvestment, leading to structural shortage in supply.

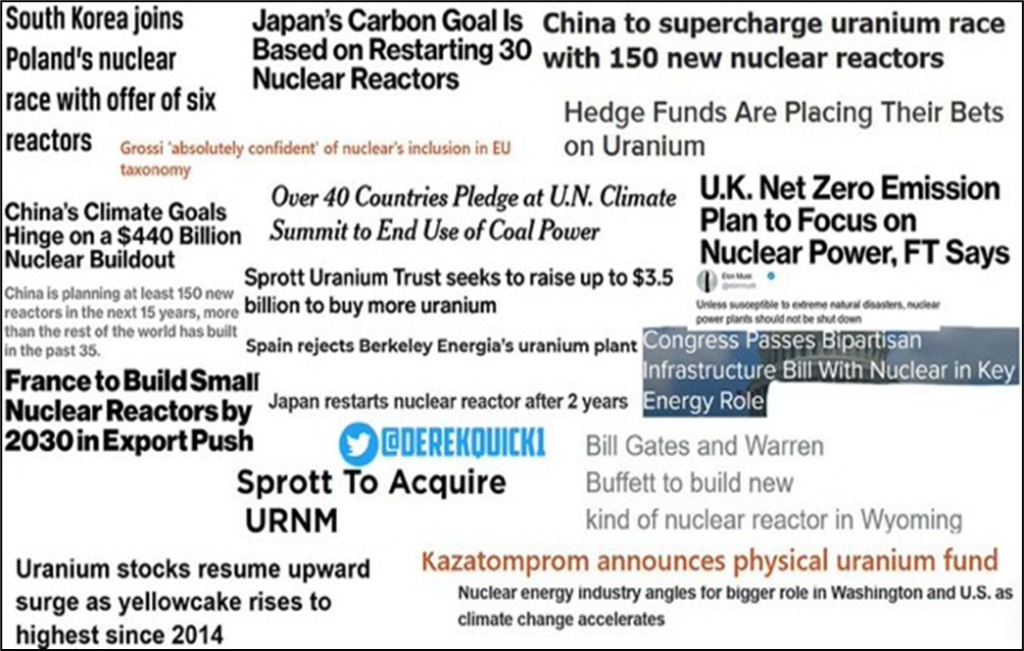
And continued Shift of focus to Clean & Green Energy as an Investable Asset

Europe will most likely be adding nuclear energy in its Taxonomy

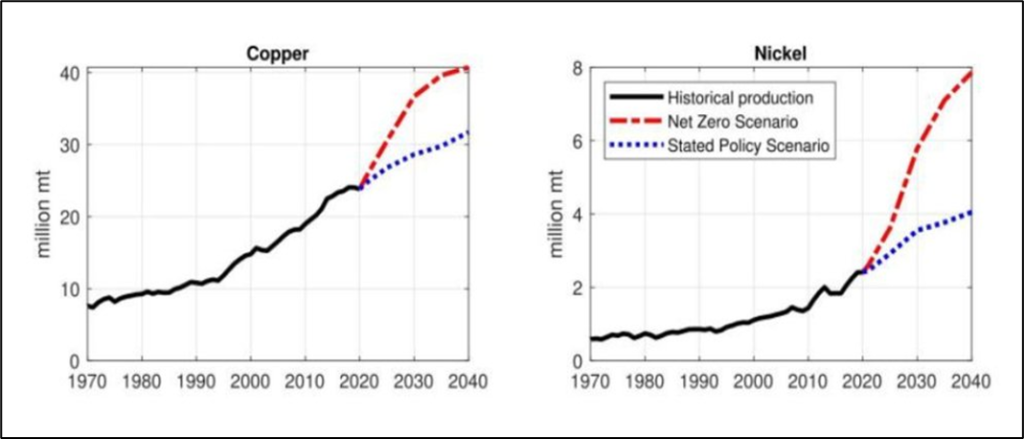
Providing impetus to demand prospects for Copper & Nickel under Net Zero Emissions scenario

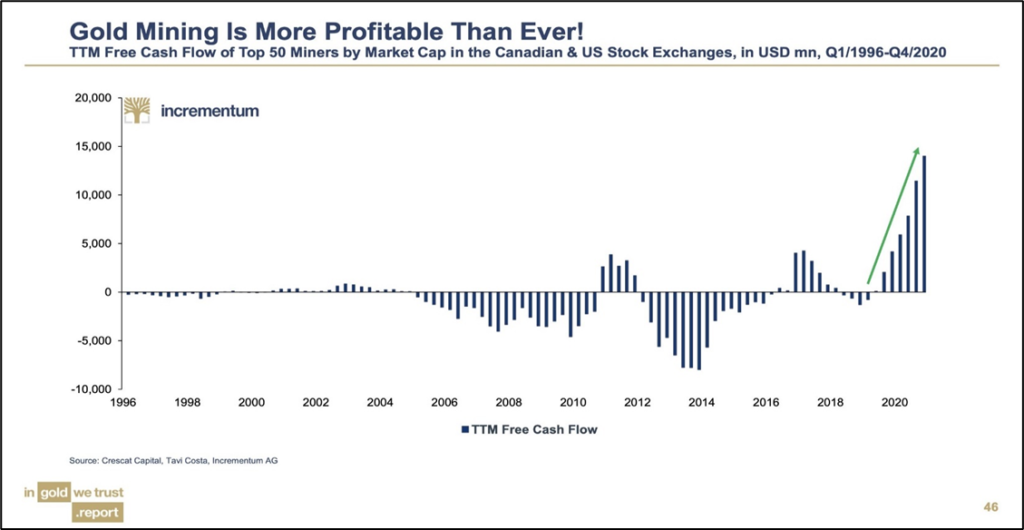
In a separate world, Gold continues to shine…atleast in cash flow terms

Gold miners are producing higher free cash flows than ever. Will be lead to increased buybacks or dividend prospects?

Global Markets Outlook

  • Inflation has emerged as the key risk for the global economy. Inflation, it said, has clearly been more persistent and more broad-based than what the Fed and most market participants, had anticipated it to be. This has led to increasing market expectations that monetary policy globally is set to become tighter.
  • Global liquidity situation will be interesting to watch as central bankers tighten in response to inflation fears and China goes for ‘responsible Easing’ liquidity scenario.
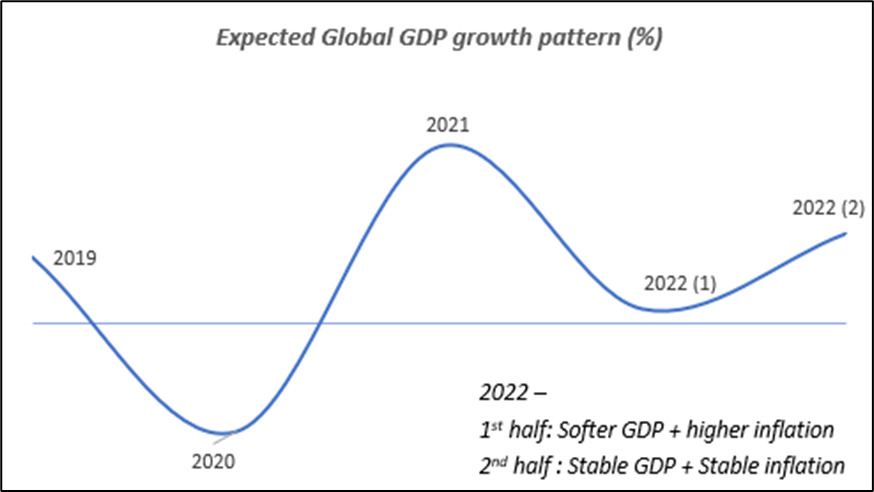
  • Volatile H1 2022 with chances of drawdown exceeding 10% as Central Bankers try tightening the Liquidity. 1st half of 2022 may witness low growth in global GDP with recovery being witnessed in the 2nd half given strong baseline effects.
  • High growth stocks to underperform in a US rate hiking cycle with inflation scares leading to investors rotate away from high-multiple tech stocks and into sectors that hold up better in a rising rate environment. Those include financials, energy and consumer goods, as well as industrials and real estate.
  • Corporate bond spreads and Emerging bonds will start underperforming US bonds due to Fed Tapering.
  • As base line inflation effects fades in 2022 and GDP growth flatlines, one might see Fed tempering its Hawkishness in response to low growth.

Active Vs. Passive & The Simple Reasons You Can’t Beat An Index

via realinvestmentadvice.com

The Differences Between You And An Index

While Wall Street wants you to compare your portfolio to the ‘index’ so that you will continue to keep chasing an index, which keeps money in motion and creates fees for Wall Street, the reality is that you and an index are very different things. This is due to the following reasons:

1) The index contains no cash, 

If you maintain cash for expected expenses, taxes, or any other reason, your performance will lag the benchmark index. 

2) The index has no life expectancy requirements – but you do.

While it may sound great that if you just hold an index long-term you will generate 8-10% annual returns, the reality is that your investment horizon between accumulation and distribution fall within one “full-market” cycle. Start on the wrong end of a cycle (high starting valuations) and the end result will be far less than advertised.

, Active Vs. Passive & The Simple Reasons You Can’t Beat An Index

3) The Index does not have to compensate for distributions to meet living requirements.

At the point in life when you begin withdrawing money to live on, performance is affected by the withdrawals against the value of the portfolio.  (Read more here)

, Active Vs. Passive & The Simple Reasons You Can’t Beat An Index

4) The index requires you to take on excess risk.

Cullen Roche once penned a salient point:

“Benchmarking is a pernicious thing in financial circles. Not only because it disconnects the way the client and a fund manager understand the concept of ‘risk’, but also because the concept of benchmarking seems to be misunderstood.”

Risk is rarely understood by investors until it is generally too late.

Chasing the S&P 500 index requires you to have your portfolio fully allocated to equity risk, at all times. This vastly increases the “risk profile” of the portfolio which may not be optimal for investors approaching, or in, retirement. (Read more here)

, Active Vs. Passive & The Simple Reasons You Can’t Beat An Index

5) It has no taxes, costs or other expenses associated with it.

As noted above, an index does not have to pay taxes on realized gains and dividends, does not have management fees, or other expenses which must be covered. All of these items will lead to underperformance from one year, to the next, versus an index.

6) It has the ability to substitute at no penalty.

In an index, if a company goes bankrupt, the index simply takes it out and substitutes another stock in its position. The index value is then adjusted for the “market capitalization” of the new entrant and the index resumes. However, in your portfolio, given you only have a “finite” amount of capital, when a company goes bankrupt, or losses the majority of its value, you have to sell that stock at a loss and buy the replacement with whatever is left or add more capital.

full article below

Active Vs. Passive & The Simple Reasons You Can’t Beat An Index

Who is right… retail buyers or Market?

“Monthly inflows through the systematic investment plan (SIP) route reached a new high in November to over Rs 11,000 crore as retail investors continued to put their money in mutual funds (MFs) through this. The record monthly inflows came despite a volatile equity market during the month with the number of outstanding SIPs now at 4.8 crore, also an all-time peak.” Economic Times

But

HDFC Asset Management stock price hits 52 weeks low

Aditya Birla Asset Management also hits 52 week low

Nippon India Asset Management stock price.. not far from 52 week low

All time high flows into mutual funds but listed mutual fund stock price hitting 52 weeks low. Hmmm…..

Fed Policy ,George Soros and Emerging Markets

Jack Schwager’s trader-interview book The New Market Wizards,includes an interview with Stanley Druckenmiller. Druckenmiller in my view is a smart investor and is not shy to talk about his trades.

One idea in particular caught my attention. Druckenmiller tells Schwager that:
I never had more conviction about any trade than I did about the long side of the Deutsche mark when the Berlin Wall came down. One of the reasons I was so bullish on the Deutsche mark was a radical currency theory proposed by George Soros in his book, The Alchemy of Finance. His theory was that if a huge deficit were accompanied by an expansionary fiscal policy and tight monetary policy, the country’s currency would actually rise. The dollar provided a perfect test case in the 1981-84 period. At the time, the general consensus was that the dollar would decline because of the huge budget deficit. However, because money was attracted into the country by a tight monetary policy, the dollar actually went sharply higher. When the Berlin Wall came down, it was one of those situations that I could see as clear as day. West Germany was about to run up a huge budget deficit to finance the rebuilding of East Germany. At the same time, the Bundesbank was not going to tolerate any inflation. I went headlong into the Deutsche mark. It turned out to be a terrific trade.

Today United states is almost in a similar situation. Covid 19 and a new cold war with China has presented an opportunity to the US to Build Back better and Fed policy has been generally been supportive of the US fiscal policy although they had started tapering their QE in Nov 2021.

as Michael Lebowitz writes

Over the last few months, the Federal Reserve has taken on a more hawkish tone. Economic activity is more robust in the U.S. than in most of the world, and its inflation rate is higher. The justification for halting QE and raising rates is palpable. The currency markets are signaling through a stronger dollar, the Fed will remove emergency accommodations quicker than most other nations.

As a result, the U.S. dollar index has appreciated 7.7% this year to date. The list below shows how much selected currencies depreciated against the dollar over the same period.

As the dollar appreciates, foreign borrowers of U.S. dollars need more U.S. dollars to pay the loan’s interest and the principal. When borrowers raise the dollars required to meet their obligations, they cause further dollar appreciation. At times, especially during a crisis, when many borrowers are forced to take such actions, a global run on the dollar occurs and pushes the dollar significantly higher, worsening problems for dollar borrowers.

Federal Reserve today increased its hawkishness further and has indicated tightening the liquidity and will stop doing QE altogether by early 2022. Whereas its European, Japanese and Indian counterparts will still continue to expand their Balance sheets, while the US fiscal deficit is set to surge further following a new Build Back better bill.

Conclusion

This creates a lethal cocktail of rising US deficit which needs to be funded by Bond market without any helping hand from Federal reserve. This as Druckenmiller suggested above ,should be further supportive of US dollar. Emerging markets would need to sacrifice their future growth due to this change in Fed policy and raise rates more than required/ tighten domestic liquidity or face higher currency and interest rates volatility.

Indian Equity Markets are simply following the LIQUIDITY

Let me explain why Indian markets continue to be on a tear

India’s GDP (trend growth) has bounced back in 2021 after covid bump of 2020. This economy will fully recover by 2023.

But look at the RBI repo rate. RBI cut repo rate by 100 bp last year and has not started reversing any of the emergency rate cuts.

Also look at the RBI balance sheet. RBI not only cut the rates but increased its B/S by 75% in last 12-18 months. This is RBI effectively funding govt deficit and keeping an artificial lid on interest rates which govt should pay on its borrowing. This is effectively increasing the liquidity in the banking system without any addition to the productivity of the Indian economy.

This ( excess liquidity) money can either go for business activity or it can go to where it can find instant gratification i.e Stock markets. No surprise that this money went into equity markets. Foreign inflows were also positive during this time and more so after china crackdown on its tech sector. Some of this foreign money left china and came to India.

but bond market ( which is the first one to revolt against excessive money printing) is already saying enough is enough and threatening to raise the interest rates for you, me and govt. Indian 10 year bond yield touched 1 year high this week.

Indian currency INR is also now getting annoyed at this excess liquidity in the system lately. The chart below is only of last 3 months.

Conclusion

Indian Central Bank was instrumental in creating this liquidity which as I mentioned above did not go in creating jobs or increasing productivity. It went into the asset markets which is threatening to get out of control if RBI does not immediately increase the cost of money.

As chuck prince once said “As long as the music is playing, you’ve got to get up and dance.”…I would only suggest that dance near the door.

what I read-6th Oct

The US Budget deficit for 2020 is estimated at $3.3B, which is 50% of its projected expenditures. This is scary in the context of Bernholz’ observation that all major hyperinflations “have all been caused by the financing of huge public budget deficits”.(https://twitter.com/TuurDemeester)

Image

10% yield on a 2-year debt. But the principal and interest will be in the Brazilian Reals.

Image
The CEOs that went big were the ones that showed more signs of narcissistic behaviour. And while the study measured narcissism in different ways all of which had similar outcomes, one easy way to measure it is to listen to the CEOs during earnings calls (or rather, analyse the transcripts of these calls). Narcissistic CEOs use more personal pronouns that point to them like ‘I’, ‘my’, ‘mine’ than personal pronouns that point to a group or other people. The higher this ratio of first person personal pronouns to all personal pronouns is, the more likely it is that a CEO will try to engage in dumb outsized acquisitions that will lead to lower shareholder value.https://klementoninvesting.substack.com/p/hold-my-beer

I have, for a very short duration worked under this personality and I totally subscribe to the article

Chart, line chart

Description automatically generated

Signs of life in US Breakeven (inflation) yields as they finally react to surging energy prices. No reaction in gold despite the accompanying drop in real yields. https://twitter.com/Ole_S_Hansen

Image
The overall trade deficit in goods and services in US hit a new all-time worst in August of $73 billion. The trade balance in services deteriorated to a surplus of only $16.1 billion, the lowest since 2011, while imports of goods reached the worst ever $239 billion, and exports of goods edged up to a record of $150 billion, thanks to $33 billion in exports of crude oil, petroleum products, natural gas, natural gas liquids, products from the petrochemical industry, and coal. (Just Keeps Getting Worse: Services Trade Surplus, the American Dream-Not-Come-True, Worst in 10 Years. Imports Worst Ever. Trade Deficit Worst Ever | Wolf Street)

What I read today-5th oct

1.New Vehicle Sales in US Plunge as Prices Soar amid Supply Chain Chaos, Chip Shortages, and Depleted Inventories

New Vehicle Sales Plunge as Prices Soar amid Supply Chain Chaos, Chip Shortages, and Depleted Inventories | Wolf Street

2.The Bloomberg Commodity Spot Index, a basket of 23 energy, metals and agricultural raw materials contracts, jumped to an all-time high on Monday, surpassing its 2008 and 2011 peaks set during the commodity super-cycle (Bloomberg)

Image

3.Everybody’s going to be disciplined, regardless whether it’s $75 Brent, $80 Brent, or $100 Brent,” Sheffield said. “All the shareholders that I’ve talked to said that if anybody goes back to growth, they will punish those companies.”

“I don’t think the world can rely much on US shale,” he said. “It’s really under Opec control.”( pioneer CEO US shale patch biggest operator)

https://www.washingtonpost.com/business/energy/the-less-popular-oil-gets-the-more-it-costs/2021/10/04/5ad85ae2-2527-11ec-8739-5cb6aba30a30_story.html?variant=45bcfc8a951d56c3

4.There are two things that always happen at or prior to the start of a boom-to-bust transition for the US economy. One is a clear-cut widening of credit spreads and the other is pronounced weakness in the Industrial Metals Index (GYX) relative to the gold price. These indicators have sometimes warned incorrectly that a bust was about to begin, but they have never failed to signal an actual boom-to-bust transition in a timely manner. Clearly, neither of the indicators that in the past have always warned prior to the start of a boom-to-bust transition for the US economy is close to triggering. This means that the economic boom* that began during the second quarter of 2020 remains in full swing.

https://tsi-blog.com/2021/10/

5.The economic results of this new focus will be: ever-bigger government, more intrusive regulations, supply chain disruptions, inflation, no price discovery, a general hard swing to the left in the western world and―not least―the increased “channelling of capital” into small pockets of investable resources and assets. This could be the 1970s all over again, except this time it’s all about the political imperative of the decarbonisation of the economy, whatever that means for real growth.

https://www.home.saxo/content/articles/quarterly-outlook/this-time-is-different-05102021

This time is different

by steen jakobson via saxobank

Throughout history, rich and poor countries alike have been lending, borrowing, crashing―and recovering―their way through an extraordinary range of financial crises. Each time, the experts have chimed, ‘this time is different’, claiming that the old rules of valuation no longer apply and that the new situation bears little similarity to past disasters.” Carmen Reinhart & Kenneth Rogoff: This Time is Different

The 2011 Reinhart and Rogoff book This Time is Different is a valiant effort by two academics to identify what preconditions, especially in terms of the levels of accumulated national and external debt relative to GDP, would set a nation on the road to an inevitable crisis. The exhaustive research in the book drew on data from 66 countries across five continents. The implication was that in 2011, major developed markets were well on their way to a new crisis as the policy response to the global financial crisis saw the massive build-up of additional and “unsustainable” debt. But since the publication of the book, the advent of multiple rounds of QE have at least severely delayed, if not disproved, their entire thesis. 

But the size and nature of the pandemic policy response will show that this time, inflation outcomes really will be very different from anything we have experienced in decades, even as the overall Reinhart and Rogoff point that debt build-ups always lead to serious trouble will eventually prove correct. That’s because at such high debt levels, monetary policy no longer gets traction now that we are at the effective zero bound for rates. To avert an immediate crisis, the pandemic response brought fiscal stimulus on the scale of war mobilisation, supporting basic incomes and MMT-like direct transfers to nearly every sector of the economy. It was a massive demand stimulus at a time when the economy was shutting down the supply side to deal with the virus. And even as we open up from the pandemic, the new fiscal dominance will continue as we face three generational challenges simultaneously: inequality, infrastructure, and climate change policy, or the green transformation. 

The economic results of this new focus will be: ever-bigger government, more intrusive regulations, supply chain disruptions, inflation, no price discovery, a general hard swing to the left in the western world and―not least―the increased “channelling of capital” into small pockets of investable resources and assets. This could be the 1970s all over again, except this time it’s all about the political imperative of the decarbonisation of the economy, whatever that means for real growth.

Decarbonisation is needed, absolutely, but the current palette of technologies doesn’t fit the bill, as solar and wind scale poorly because of intermittency. Even worse is the too-readily accepted shift to lithium-ion battery powered electric vehicles. The wind turbines in Europe are being forced to stop when the wind is strong as the grid network is unsuited for peak input. And even if some energy storage option was available, there may not be enough of the key industrial metals to achieve this.

In short, our basic problem is that the physical world is too small for the aspiration and visions of our politicians and environmental movements. The more we decarbonise under the present model the more we metallise the economy. The marginal demand output change on metals under the assumption of 30% of the car fleet being electric in 2030 is 10-20x of current levels. The supply chains, meanwhile, are inelastic due to a lack of support for permitting, board approval, and lack of capital flowing into the “dirty” production side of the equation due to ESG priorities.

The “new black” in investing is ESG, in particular the E (environment), which is everything that touches the green transformation. Money continues to flow into ESG priorities and companies are in a rush to get with the program as a key driver of business and accessing capital. That’s excellent news, except for the fact that the ESG landscape is at best not very well defined, not rule based and often arbitrary. This will not however change what is my chief message to customers and policymakers:

ESG is the biggest political project ever. 

The ESG push and related green transformation effort have so much political capital behind them that failure is simply not an option. The best analogy to me is the euro. I happened to be a student under Professor Niels Thygesen when he was authoring the Delors Committee report in 1988/89, preceding the introduction of the euro and outlining the path to Economic and Monetary Union. We all knew the EMU/euro was born without a proper foundation (fiscal union), that no currency union has survived the test of time and that the stronger nations would “dilute” the weaker ones. Despite this we all underestimated the political capital invested. As with the green agenda and ESG, it had to be a success. The doubt disappeared during a speech by ECB president Mario Draghi at the Global Investment Conference in London on July 26, 2012, during one of the worst phases of the EU sovereign debt crisis, when he said, “Within our mandate, the ECB is ready to do whatever it takes to preserve the euro. And believe me, it will be enough”. 

I compare the present agenda/driver to that same political ideology. The ESG and green agenda will prevail, if only because it will have unprecedented political will and capital behind it. ESG will be 50 trillion USD business in 2030 according to Bloomberg Intelligence by 2025. (For comparison the US GDP is 23 trillion USD per year)

It is the biggest “whatever it takes” commitment and it’s global too, with China joining with their 2050 decarbonisation plan.

The ESG and green transformation is simply the single largest policy bet ever undertaken, and the main consequences will be inflation and ever lower real rates. Inflation in this case will be a function of the physical world not able to deliver the supply relative to the quantity of money and demand, and negative real rates tell us the future is one of low real growth through low productivity growth.

We investors need to embrace, understand and act on this. There are two major assets classes that will do well under this regime: Government-sanctioned assets, and assets with price discovery. This means green and, ironically, commodities have the best odds of producing long-term excess returns. 

This does not mean the projection from here will go from one success directly to the next. Au-contraire: the present model of negative real rates as a funding source for unproductive changes to society will lead to some sort of breakdown. This will however only lead to ever more funds and subsidies for the same failed transition. Eventually, we have to hope, new energy sources will come to the rescue (fusion energy?) with vastly superior outputs per invested unit of energy and per invested dollar. For now though, money talks.

In conclusion, negative real rates are a function of our economic model not being productive into the future. The more we continue to pursue a sub-optimal model for our otherwise noble objective of a cleaner, better and more just future, the lower real rates will go, and the more unequal society will be, blocking the path to a real vision for the future. 

A vision needs to be built on productive societies pushed forward by better education, basic research as a central part of fiscal spending, and rules-based international cooperation that gave us a vaccine against Covid, genome mapping, the internet and so much more. The sad thing is that we have never been further away for this “turn for the good”. 

So again, this time is different as a new inflationary era is upon us―one unlike any of us under the age of at least 60 can remember. But what is not different is that this is the last phase of the process started under Greenspan in 1998 where policymakers interfere ever more deeply into the economy. First it was central bankers bailing out the system, now it is governments trying to force outcomes regardless of their productivity. This has brought zero policy rates and now heavily negative real rates. We need to realise that negative real rates are a doom loop and that we won’t really move toward that bright future we all want to build until real rates move up and turn positive.

GAS ON HIGH

by Charles Russell

“Gas markets are on red alert…prices are up 250% since January. On an energy equivalent basis, gas prices are now the most expensive fossil fuel, on par with gasoline prices when oil was over $100 a barrel…we have to ensure that the climate crisis does not turn into an energy crisis. The thing I am the most concerned about as prices and volatility trend higher over the coming years that it does not undermine public support for climate progress. Once we lose public support, that is a very hard thing to gain back”Joseph McMonigle, Secretary-General of International Energy Forum. September 21st, 2021.

A somewhat alarming statement from the Secretary-General of the IEF, but not entirely misplaced in our opinion. Cheap gas has been a boon for affordable electricity, cheap industrial goods, and the reduction of atmospheric emissions.[i]

Gas prices in Europe have hovered between $4-$8/MMBtu over the last few years. For gas-powered generation assets that feed the power markets, this translates into an electricity cost between $25-$56/MWh. A reasonably affordable range and not atypical of actual power prices in wholesale markets over the same period.

As gas prices exploded higher to $15/MMBtu in August and upwards of $20/MMBtu in early September, the marginal cost of production for gas generators (and thus price they can offer their power at) stood well above $100/MWh.

Typically, there is enough diversity and redundancy in the power supply stake to absorb fuel price shocks – when prices go up, another generation unit becomes more economical. Thus, the realized power price does not follow in lockstep when a single fuel source’s price increase (or decreases). Renewables, which we are long-time investors in and believe have a time and place, have been proposed as a universal solution to our electricity needs; the drawback of the universalist assertion is decreased diversity in the power stack, enfeebling the entire system.

The UK has unfortunately found itself on the wrong side of this dynamic lately. With abnormally low levels of wind at the beginning of September, the total power supply dropped. As coal and nuclear are being phased out, gas remains the only one-demand energy supply. Gas generation ramped up (as gas prices were hitting all-time highs), which meant that the power price was (and is) becoming the fuel increasingly on the margin. It sets the price if it’s required to meet demand and there are no cheaper alternatives.

A further wrinkle is that less efficient gas units are likely to be dispatched under a power-constrained scenario. “Peaking” gas units are typically less efficient due to their stop/start characteristics, the age of the asset, or some combination of both.

The blue line in the chart below graphs the marginal cost of production for a gas unit under different gas prices, holding the unit’s thermal efficiency constant. As we hit August 2021 and gas prices climbing from $15 to $20/MMBtu, we have modeled out what an equivalent cost of production (and thus power price assuming it’s the fuel source on the margin) would be for efficiency figures typical of older gas units meant to serve peak demand.

Picture1-4

The implications here are important. The surge in gas prices halted CF Industries fertilizer operations in the country, prompting food scarcity concerns and calls for a three-day workweek– a maneuver not seen since a previous energy supply concerns in the 1970s. British Steel has pressed pause on operations periodically as prices are “spiraling out of control,” and absorbing the cost is too punitive. Just yesterday, Europe’s largest zinc smelter announced it was curtailing production due to electricity costs. 

The parabolic move in power prices seen in the UK and Germany today will likely moderate back to more reasonable levels shortly. However, we are concerned that these events will become more frequent with a greater persistence of consequences as society attempts to rapidly remove traditional energy sources while paying a little homage to availability, reliability, and cost. In short, as society makes more economically unsustainable decisions in pursuit of environmental sustainability, the environmental sustainability we desire becomes increasingly unsustainable.

Historically, decreasing energy availability and increasing energy cost are a bad recipe for economic productivity. Tension is already evident. Poland is keeping a coal mine active, despite a €500,000 per day fine from the European Union for failing to force a shut down on an accelerated timeline. The mine fuels a power station that supplies 7% of the country’s electricity. The Polish government is not willing to threaten energy security or its economy (and likely social cohesion), even at a steep penalty, until they have a carbon-neutral solution in place.

The root cause of the issue described above is the decontextualization of climate change and environmental concerns from the economic and social reality in which those challenges have meaning for people. Environmentalism’s significant failure is its reductionist drive, leading to simplistic solutions for complex problems within an adaptive and ever-changing societal system. By failing to think about the electricity system as a part of a larger interconnected system, that must be considered not only in its parts but also in the whole, the drive to decarbonize creates unintended consequences. As pressing an issue as climate change may be, no issue is so pressing that an unstable solution, what one might call an unsustainable solution, makes sense.

https://insights.massifcap.com/blog/gasonhigh?utm_campaign=Blogs&utm_medium=email&_hsmi=163151456&_hsenc=p2ANqtz–EHCbnIVLNQn65n1cDHlYmJnC2kZh17f4cPVEVG3qF9VlMctH0dXBoELFyJNtKECWyV003KXMqRCY74xmYAAuE17HTsw&utm_content=163151456&utm_source=hs_email

When The Levee Breaks…

By Kuppy via Adventuresincapitalism

September 20, 2021

To a man with a hammer, every problem looks like a nail. To the Federal Reserve, every problem is met with more liquidity. Unfortunately, the Fed has very little control of where this liquidity goes. First, it went into equity markets, fueling an outright equity bubble. Then it overflowed into PE and VC, creating bubblicious demons there as well. Then it overflowed into meme stonks and shit-coins. Not content with the damage they wrought on the financial economy, the liquidity began overflowing into the real economy. There’s currently an epic housing bubble, leading to increasing wealth inequality and polarization.

Now, this liquidity is overflowing into the everyday economy—assuming you can even find the item you seek. In the past, only hard money weirdos complained about the gradual creep of inflation—now everyone feels it and has their own story. Everyone is painfully aware that inflation is present and is likely to stay.

Coincidentally, this is all happening at a time when the government is actively destroying the normal supply response to higher pricing. You want more labor? Nope, there’s stimmies. You want to keep your existing employees? Nope, anyone un-vaxed must quit. You want to add a facility? Nope, permits take years. You want to finance growth? Nope, they only finance ESG projects. The free market is an interplay of supply and demand. If you restrict supply and stimulate demand, eventually pricing responds.

For the past few months, I’ve been joking that the Fed will keep going until something breaks. Of course, in the Fed’s jaded minds, they’re worrying about the left tail (downside equity risk) and they’re continuing to flood the market with liquidity. What if the Fed is now the cause of the left tail risk? What if the right tail (parabolic upside commodity action) caused by this liquidity is what actually breaks the market? What if the Fed has finally added too much liquidity? Maybe the levee is going to break.

Back in June, I wrote about how ESG = Energy Stops Growing. It’s already starting to play out. Look at what European electricity prices are doing. Now assume this happens to gasoline and diesel. Consider what happens if it is a cold winter. Could natural gas go crazy? Propane. Ethane. Heating Oil. They’re all waking up. These are the feedstocks for everything in our lives. The whole periodic table is going mental. There’s even food inflation—the sort of inflation that gets very political. The inflation is everywhere that the government gets in the way of supply while increasing demand.

After decades of irrelevance, inflation is about to matter again. Energy is the big dog, but wage growth is also here to stay—it will impact margins and eventually get imputed into earnings multiples. There will be plenty of other areas with inflation as the government continues to meddle in the supply response. Equity multiples do not do well when inflation roars, particularly if the starting point is as extremely overvalued as it is today.

I’m the “Project Zimbabwe” guy, but I also believe in Kevin Muir’s “Rolling Bubbles.” The history of financial markets is that once a bubble peaks, it rarely reflates. Could the bubble in duration assets (like high-multiple tech and Ponzi) finally be over? Could the bubble in inflation assets just be starting? Could the unwind of both historic extremes be unusually violent, as so much of the world’s capital is leaning the wrong direction? I know where I have my bets. I expect inflation assets to surprise to the upside, even as the bubble in duration bursts. I expect energy to be the proximate cause. Watch it closely. Demand is still recovering from Covid, yet energy prices are already at multi-year highs. There are air pockets where supply doesn’t exist at any price. These are the warning signs. Something wild is brewing.

My friends atCapitalist Exploitshad this chart in their most recent weekly (if you’re not a subscriber, I highly recommend it). Look’s overdue to mean revert.

This isn’t a call to get out of the markets tomorrow. This certainly isn’t a call to short anything. Rather, this is a call to re-evaluate your book. There’s a massive rotation underfoot here. As it gathers speed—I think it will surprise people.

A month ago, I reminded everyone that the Fed is a political animal. If inflation becomes a political issue, the Fed will be forced to act. Is anyone prepared for that?  What if they cannot fix the inflation? What if the politicians demand that they get aggressive as inflation overshoots? Will the Fed be forced into more extreme actions? This is the scenario that no one is contemplating—what if we should all be thinking about it??

Watch energy. It’s the lynchpin of everything else inflation related. As that roars, I expect duration to get mauled…

If you enjoyed this post, subscribe for more at http://www.adventuresincapitalism.com