Russell Napier: We Are Entering a Time of Financial Repression- Very Important Interview

Market strategist Russell Napier talks about why he sees structurally rising inflation coming, why central banks are impotent – and what that means for investors. Mark Dittli 13.07.2021

Russell Napier caused a stir in the financial world one year ago when he made the call for a regime change: After almost thirty years in which the global economy was characterized by deflation, the market observer thinks that a phase of structurally rising inflation is beginning.

Just like after World War II, Napier believes that governments will pursue a policy of financial repression in which the interest rate level is deliberately kept below the rate of inflation to get rid of the high levels of debt.

The Market NZZ spoke with Napier about his inflation call. In this in-depth conversation, which has been redacted for clarity, he explains which developments will shape the coming years, how investors can prepare for them – plus why trying to forecast the velocity of money is akin to juggling an incontinent squid.

Mr. Napier, it’s been a year since your inflation call. Today, we do see higher headline inflation. Do you take that as proof that you were right?

Yes, but we need to distinguish here. My call is based on money, on the growth rate of broad money, to be precise. My argument rests on the observation of a deep, structural shift taking place. What we see today in terms of published inflation is partially based on supply shortages. These will ultimately be solved.

Most of the discussion circles around the question whether current inflation is transitory or persistent. What tells you that it will be persistent?

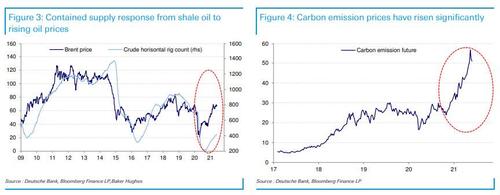
First of all, I agree that a lot of the inflation we see today is caused by the supply side, which will adjust. That element of inflation will come down again, hence we can say it’s transitory. I would put one red flag over the supply side issue though, and that is China. Remember, in 1994 China devalued its currency, as I show in my upcoming book «The Asian Financial Crisis 1995-1998», and this triggered a wave of cheap exports from China. For years, we had a massive deflationary wind coming out of China. That isn’t going to happen again for two reasons: One, labour prices in China are up significantly. And two, we are entering a new cold war, which means we won’t be buying as much from China. But let’s leave this issue aside and assume that the supply side will adjust. In the longer term, inflation will be driven by the growth of money in circulation.

How so?

My bottom line is we have an exceptionally high growth in broad money at the moment. The US got to 27% year-on-year growth in M2 at one point. That’s coming down now, given the base effect, but I think M2 growth in the US will settle at around 10%. In Europe, it is about 10%, and even in Japan it’s well above its post bubble-era average. So I think we will settle down with broad money growth at close to 10%, persistent, over several years. The consequence of this kind of broad money growth is an inflation rate above 4%.https://datawrapper.dwcdn.net/gKfCV/1/

Why?

First, it’s important to stress that I’m not calling for 10 or 20% of inflation. There are people running around with hyperinflation forecasts, but I think this is unlikely. I’m calling for an inflation rate above 4% for a number of years, and that is based on an analysis of the quantity of money. Have we ever seen a country in history persistently running a broad money growth rate at 10% that didn’t have inflation at 4% or above? The answer is No. Plus, it is fair to assume that there will be spikes in the velocity of money, which means there can be temporary bursts taking inflation above 4%.

What time frame are we looking at?

Over the next ten years, I’d forecast something between 4 and 5,5% in terms of the rate of inflation in the developed world. But mind you: The most important part of my forecast is not the inflation rate per se. It’s that interest rates will not be allowed to reflect that rate of inflation. That is what changes the entire structure of finance. This is the key question: Will interest rates, short and long, be allowed to reflect 4% inflation? My answer is No. This is because we will be entering a period of financial repression, where governments keep interest rates below the rate of inflation, just like after World War II.

What’s the base for your forecast of a broad money growth rate of 10%?

The reason that I come up with this number is the revolution that happened last year: Governments got involved in the commercial banking system, by guaranteeing private sector loans. When I look at the latest data, I see bank balance sheets growing at about 10%, which translates into broad money growth of around 10% per annum. People have to understand that it’s not central banks that create most of the money, but commercial banks. So now governments, through their loan guarantees to commercial banks, can create as much money as they like. Out of thin air.

Sure, but those were emergency measures to combat the effects of the pandemic.

Many people will say it was an emergency measure, and when the pandemic is over, governments will stop it and bank credit growth will collapse. Well, we shall see. Governments have huge political goals, like reducing inequality, boosting green investment, infrastructure, you name it. I think we will see more government guarantees, particularly for green lending. As it happens, there is also, for the first time in my career, likely to be a series of private investment booms by corporations, be it for green investments or investments into new supply chains. So the forecast of 10% broad money growth is based on a rapid expansion of bank balance sheets, which is either driven by private sector demand, and if that fails then driven by the government getting in to manage the expansion in bank credit they require to meet their political goals.

And central banks will have no say in the management of broad money growth?

No, they won’t. This is exactly what happened after World War II. Central banks were impotent during that time. The supply of money was dictated by governments controlling the commercial banking system. I strongly believe that we’re going back to that system. The government can never tell you that, because the whole point of financial repression is to steal money from savers slowly. But this is a fantastic thing for politicians: It isn’t fiscal spending, it isn’t higher taxation, it’s a contingent liability on the government’s balance sheet but not an actual liability. It creates politically directed growth, and it creates inflation. For politicians, it’s the magic money tree.

And your case is that politicians won’t let it go again?

Exactly. Let me give you an example: In the UK, usually the longest term fixed mortgage you could normally get was five years. Boris Johnson has now created a 25 year fixed mortgage for first-time buyers, offered by banks, guaranteed by the government. Nobody can pretend that this has anything to do with Covid, and in fact when Johnson announced it, his stated aim was to give young people access onto the housing ladder. This is a good example of how the magic money tree was discovered for Purpose A, i.e. Covid, and is being used for Purpose B, furthering social justice.

Don’t you see a possibility that politicians will return to being fiscally responsible?

Of course it’s possible that politicians, having discovered the easy route to re-election, decide not to use it. I’m betting against it. The introduction of the income tax in the UK was an emergency measure in 1798. It’s still in effect today. Many emergency measures, such as Regulation Q introduced by the US government to control deposit rates in the 1930s, lasted for decades.

Seeing how Republicans in Congress are trying to block Joe Biden’s infrastructure plans: Perhaps there will be a push towards austerity again?

The Republicans were in charge during most of Covid. They came up with the Payment Protection Programme, which was exactly using the banking system for this purpose. History shows that when Republicans are in power, they have endorsed fiscal largesse, price controls, credit controls. Just think of Richard Nixon. Of course it’s possible that some sort of rectitude descends on politicians. But I think it’s unlikely. Politicians will push credit for green investments. There will no doubt be other political problems for which more cheap bank credit is seen as the answer.

The bond market today clearly does not reflect your inflation call. Why?

Bond yields are depressed by central bank action, and I would argue that they are also depressed by government action. Many insurance companies must hold government bonds due to asset liability models that their regulators have imposed upon them. We are going to discover that, as time progresses, bond yields are entirely decoupled from inflation. That’s the most important thing here. You won’t find one economic textbook which says that bond yields can be decoupled from inflation. And yet there is a long period of history, from 1939 to 1979, where they were largely decoupled. All the textbooks work on the assumption of a free market economy where the free will of investors results in bond markets pricing in inflation expectations.

Is that not the case anymore?

Bond yields are telling us today that this is history. They are not set in a free market anymore. And therefore most of the skills investors have learned since 1979 are obsolete. Bond yields will not be a free market price anymore for at least 15 years. We are in a new structure of how things work. I am not making a business cycle call here, this is a structural call. We are entering a time of financial repression.

Why are yields not just signalling that they are not convinced that inflation is going to stick?

As you know, I was on the deflation side of the argument for 25 years. The reason I changed is because the structure has changed. Banks didn’t lend up until 2019, broad money was stagnant, velocity fell, so you had to be on the deflation side. But now banks do lend, because they are compelled to by the government, broad money is growing, and, as we will find out, the velocity of money will be rising. That’s why I’m in the inflation camp now.

In the US, velocity of money is stuck at rock bottom. What does that tell you?

It tells me that many things are still difficult to buy: Part of the service sector is still effectively closed down until people feel confident about the health issue. In other parts of the economy, velocity is shooting up. The building trade is the obvious one, where people take their cash balances and buy building materials they don’t actually need yet. That’s the classic example of rising velocity.

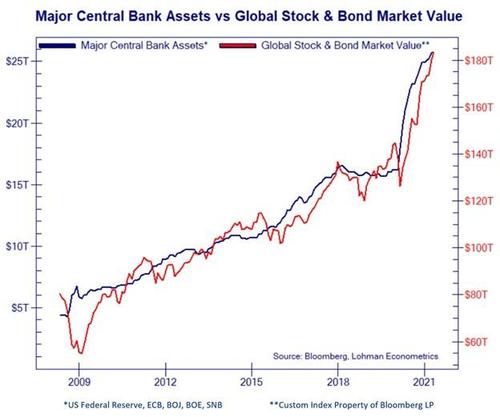
Velocity has been on a structural downward shift since 2009. Why?

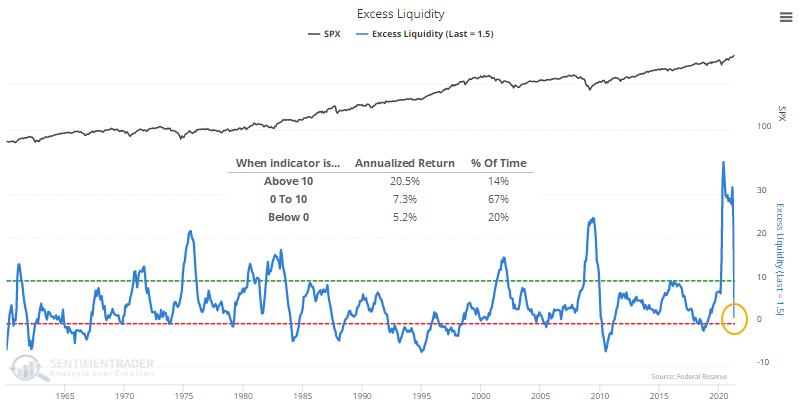
If you look at US financial history, velocity was in a rather stable range above 1.6 from 1959 to 2009. The downward shift after 2009 was, in my view, the result of the Fed’s quantitative easing policy. With QE, the Fed bought financial assets in the market, and it basically bought them from savings institutions. The only thing these institutions could do with the newly created liquidity was to buy more savings assets. So the QE policy never reached the real economy, it never created broad money growth, it just pushed up asset prices. But now, with broad money created by the banking system, it will hit the real economy, therefore velocity will normalize.https://datawrapper.dwcdn.net/Ho3JA/1/

To what level?

I think the great surprise over the coming years will be when velocity goes back up towards 1.6. But forecasting velocity is fiendishly difficult. It’s like trying to juggle an incontinent squid: Something you really don’t want to do, and you’re very unlikely to be successful. The change in velocity downward after 2009 fooled everybody. Many people at the time said that QE must create inflation. But because velocity collapsed, there was no inflation. I think it will surprise on the upside this time. So while we can’t forecast velocity, we can put a risk to it, and I think the risk of velocity shooting up is higher than any time since the 1970s.

What will cause velocity to take off?

When people decide their savings can’t be sustained and do something with it. This will happen when the government starts to cap bond yields at a level permanently below inflation.

Won’t this just provoke another leg up in real assets, like equities?

Yes. That’s why I’m bullish on equities and real estate. As the experience during the three decades after World War II has shown, in the early stages of financial repression, equities and real estate are beneficiaries.

What do you make of the hawkish pivot of the Fed, and their beginning of the taper talk?

I think central banks are irrelevant, because they don’t control the growth of money anymore. Of course, when you have a regime change, people will keep looking at the old regime. Investors still take their leads from central bankers. But look at the British Covid bounce-back loans: The government has dictated the quantity, the interest rate, the duration, and the credit risk. What role does the Bank of England have to stop that? None. All the tools central banks have are fairly meaningless should governments continue to dictate the extension of bank credit on the terms they deem necessary. The power is gone from central banks. The most important call I’m making is that the institutions investors thought were important are in fact irrelevant.

So you say it’s the governments that will put a cap on bond yields, not central banks through a policy of yield curve control?

Yes, and that’s important. It comes in two stages. In the first stage, the one we are living through now, bond yields are largely driven by the central banks. But there will come a time when they don’t want to continue QE as it is a pledge to add unlimited liquidity which is dangerous when market participants believe in higher inflation. Many people think yields will shoot up once central banks stop buying bonds.

Won’t they?

No, because then the government will force savings institutions to buy bonds. That’s stage two of bond yield control. Mind you, the transition from stage one to stage two won’t be smooth. Legislation will have to be passed to allow governments to in effect allocate private sector savings through greater control over regulated financial institutions. So there could be a period where bond yields rise too quickly and markets will panic. But ultimately governments will cap interest rates by using the savings system. Just like they did after World War II. In basically all our economies, our total government and private sector debt to GDP is above 1945 levels. Why should we not expect governments to use the same mechanisms they used after the war to get those debt levels down? It is a transfer of wealth from savers, forced to own fixed interest securities on low yields, to debtors who see their revenue rise with inflation while their interest payments remain low.

In order to be able to do that, any idea of central bank independence would have to be scrapped?

Yes. It’s like the Holy Roman Empire: It existed for a thousand years, but it wasn’t powerful. It was there, people talked about it, but it was powerless and meaningless. We can say central banks are independent, but all the power is with the government. Andy Haldane, the outgoing chief economist of the Bank of England, wrote in his retirement epistle that for years after World War II, the Bank was effectively a think tank, and the government set interest rates. We can go back to that. You will never formally relinquish independence, but your power slips away. There is no independence in central banking anymore, it’s gone, it’s passed, it has ceased to be. This has happened before, and it shouldn’t come as a surprise.

Haldane also wrote that he thought the most important task of central banks today was avoiding an upside inflation surprise.

If I were leaving, and if I wanted to be seen favourably by history, I would also tell the institution that they should do something. But they can’t. It’s not up to them. They don’t control the creation of money anymore.

But in the short term, central banks could provoke a tapering scare anyway?

Winston Churchill used to say it’s better to jaw-jaw than war-war: If you don’t have any power anymore, then talk like you do and sometimes it works for a while. That’s what they will do, and this talking in the short run can be effective. Teddy Roosevelt said «talk softly and carry a big stick». At some point people realize that the central banks don’t carry a big stick anymore. It’s like in the last chapter of the Wizard of Oz, when they discover that the mighty wizard is just a tiny little man behind a curtain playing an organ. They pretend that they are still carrying a big stick. It can work until it doesn’t.

So let’s take the playbook after the war: For about twenty years, we saw high nominal growth, followed by a long period of stagflation. What are we looking at today?

For the average guy in the street, financial repression can look quite good. Let’s say your wage is going up at 5%, and your mortgage rate is 3%. This is not a bad world to be in at all, arguably for the majority of the population even if their wages only grow in line with inflation. The person who pays the price for this is the saver. Even if you just took the period from 1945 to 1957, which was the period where everybody was doing quite well, you lost 35% of your savings if you held British sovereign bonds.

It was a fantastic time for equities, though.

Absolutely, if you had been in equities during that time, you did very well. That’s why I’m bullish for equities today. However, there is one crucial difference: At the end of the war, the yield on ten year Treasuries was 2,5%, and the dividend yield for equities was 10%. Equities started the period of financial repression at dirt cheap valuations. From 1945 to 1966, you had this catch-up where the cyclically-adjusted P/E went from 9x to 25x. Today, equities enter this period at an already very rich valuation.

And then came the era of stagflation.

Starting in the late Sixties, we entered stagflation. There were many factors, and the oil crises were certainly important. But basically the problem is, in the long run, if you put the wrong cost of capital into the economy, you get a misallocation of capital. The word stagflation wasn’t invented until 1966, because we had never seen it before. It was invented by Iain Macleod, who was then the Chancellor of the Exchequer. Over a prolonged period of time after 1945 capital was misallocated, and this resulted in productive capacity not being added in the right places and people not being employed.

Do you expect a repeat of this pattern, first a boom, and then stagflation?

Yes, but I wouldn’t expect the boom phase to last that long. So even though I’m bullish for equities at the moment, the difference this time is they start at an overvaluation, rather than at an undervaluation. A repeat of the long boom from 1945 to 1966 for equities is unlikely.

How long can the good times last?

The first stage can go on for three or four years. That’s short compared to after World War II, but it’s long for many people. The time to sell equities is when governments formally force savings institutions to buy more bonds. Because in order to buy, they will have to sell equities.

And after that, there will be stagflation?

If we agree that stagflation is a consequence of a long period of misallocated capital driven by financial repression, then we have to expect it to happen again. You misallocate capital, and you get high inflation and high unemployment.

One argument that is often heard why a Seventies style stagflation won’t be possible is that unionization of labor is gone.

People always say unionization caused inflation. The statistical evidence suggests that it was the other way around, that inflation caused unionization. People banded together and joined unions to protect themselves from inflation. When there is no inflation, you don’t need to be in a union. I think we will see more unionization again.

Given your bullishness on equities, shouldn’t you also be bullish on gold?

I’m very bullish on gold. The problem for gold in the last year was that interest rates have gone up, because people still believe there will be a link between inflation and interest rates. If people believe there will be inflation at 4%, they will say interest rates will ultimately be at 5 or 6%, hence they don’t want to own gold. It’s only when they begin to realize that that link is broken, that the gold price will lift off.

You have a new book out, «The Asian Financial Crisis 1995-1998». What can we learn from that period today?

I thought it was a good time to write about why we ended up in this kind of situation, where our debt to GDP ratio is above the levels after World War Two. The Asian crisis launched this. After the crisis, Asian authorities introduced policies of exchange rate management, they bought up a huge pile of foreign reserves and Treasuries. By holding their exchange rates down, they pushed a lot of cheap products into the developed world, which pushed down inflation and forced central banks to hold down interest rates. This led to this depression in interest rates and this massive rise in debt. The other thing that happened during the Asian Crisis was the Fed bailed out LTCM, and they cut interest rates to support the bailout. So a lot of people considered this a sign that you can speculate with debt. The foundations for where we are today were laid in 1998. The book explains where our current predicament came from and how the financial repression we now live with is a fusion of the two forms of capitalism, social capitalism and financial capitalism, that did battle in Asia in 1997 and 1998.

Russell Napier

Russell Napier is author of the Solid Ground Investment Report und co-founder of the investment research portal ERIC. He has written macroeconomic strategy papers for institutional investors since 1995. Russell is founder and director of the Practical History of Financial Markets course at Edinburgh Business School and initiator of the Library of Mistakes, a library of financial markets history in Edinburgh. Russell is a CFA Society Fellow.

Russell Napier is author of the Solid Ground Investment Report und co-founder of the investment research portal ERIC. He has written macroeconomic strategy papers for institutional investors since 1995. Russell is founder and director of the Practical History of Financial Markets course at Edinburgh Business School and initiator of the Library of Mistakes, a library of financial markets history in Edinburgh. Russell is a CFA Society Fellow.

https://themarket.ch/interview/russell-napier-we-are-entering-a-time-of-financial-repression-ld.4628

The Lifeline Of Markets – Liquidity Defined

Authored by Michael Lebowitz via RealInvestmentAdvice.com,

We recently read an analogy in which the author compares the current state of asset prices to an airplane flying at 50,000 feet. Unfortunately, we cannot find the article and provide a link. The gist is market valuations are flying at an abnormally high altitude. While our market plane cannot sustain such heights in the long run, there is little reason to suspect it will fall from the sky either.

Many investors are writing on the current state of extreme equity and bond valuations. Surprisingly, there is little research focusing on what keeps valuations at such levels. Liquidity is our asset bubble’s lift and worth closely examining to better assess the markets’ potential flight path.

Market Liquidity

In the investment world, liquidity refers to the ease and cost with which financial assets can be bought and sold.

For example, U.S. Treasury bills are highly liquid. They can change hands at a moment’s notice and usually at the prevailing market price.

Real estate is on the other side of the liquidity spectrum. Houses or land, for instance, can take months or even years to sell. The seller often reduces the asking price and/or negotiates the price lower to affect the sale. Taxes, fees, inspections, and drawn-out settlement dates further de-liquify the process.

The term liquidity applies to individual assets, as above, but can describe general market conditions as well.

Picturing Liquidity

The market is like a large movie theatre with a small door.” Nassim Taleb

People typically enter a movie theater in a steady stream. Some arrive early, while others rush as the movie starts to find a seat. When leaving, there is an orderly exit, but it takes a little longer as everyone departs at the same time. In market parlance, we can describe the regular entrance and exit of a movie as being generally liquid.

If there is a mass urgency to get out of the theater, exiting becomes disorderly or illiquid. In the 2008 financial crisis, liquidity in many securities was scarce. Think of it as being a crowded theater when a fire breaks out. Not only was it tough to get out, but the only way to exit, or sell assets, was if someone else was willing to enter.

Liquidity Is Least Plentiful When You Need It Most

When prices rise steadily and predictably over months or years, and the ability to buy or sell an investment is both transparent and efficient, the importance of liquidity is usually taken for granted and ignored. The prices we observe on our monitors are the prices at which we can sell.

Sometimes, liquidity fades, and markets become disorderly and volatile quickly. The price at which we can sell may depart significantly from what we see on our computer screens. Such a quick change in the environment results from uncertainty and anxiety, tied to increasing volatility. Liquidity is valuable, and it comes at a dear cost in such situations.

Some say banks are always willing to lend to those who do not need money and never willing to lend to those who do. The concept of liquidity is very similar; it is always most plentiful when you need it least and never available when you most desperately do.

The more liquid an asset or portfolio is, the easier it will be to sell or manage in a liquidity event and avoid financial distress. As such, it is worth understanding the liquidity characteristics of our holdings in both periods of excellent and poor liquidity.

For perspective on why this is so important, we study a few historically horrendous illiquid periods below.

Black Monday

From January through August 25th of 1987, the Dow Jones Industrial Average (DJIA) rose 40%. At that sharp rise higher, the market began to falter slowly. Between the peak in late August and October 16th the DJIA fell 18%.

Despite given up half of the year’s gains, few investors paid attention to two seemingly unimportant events. First, Congress was debating legislation that would tax particular merger and acquisition (M&A) activities. Second, a new investment management tool, portfolio insurance, was gaining wide popularity. Investment managers associated with M&A and portfolio insurance were adding liquidity to markets and driving prices higher, but few had given thought to how those investors might react in a market move lower.

Concerns over proposed legislation resulted in selling by risk arbitrage desks that were speculating on M&A activity. In response, portfolio insurance strategies needed to sell. A significant source of market liquidity over the prior year was suddenly in desperate need of liquidity.

On October 19, 1987, the DJIA fell 25% on what is known as Black Monday.  In just 38 calendar days, the market gave up 100% of the gains from the prior eight months.

The pitfalls of portfolio insurance are often blamed for the record losses, but the real culprit was an abrupt loss of liquidity.

To think, just weeks before Black Monday, markets seemed abundant with liquidity.

Sowood Capital

In July 2007, hedge fund Sowood Capital closed its doors as they abruptly unwound a highly leveraged book of illiquid mortgages. Despite ultimately accruing $1.6 billion in fund losses, the investments were characterized by Standard & Poor’s as “neither uncommon nor excessively risky.”

Instead, Sowood’s mistake was the extensive use of leverage to buy the assets. The glitch for Sowood was a lack of cash or liquid assets to post as margin when it was demanded by those lending to them. A liquidity reserve would have allowed them to post collateral and avoid selling illiquid assets into an illiquid market.

Although problems for Sowood began in the spring of 2007 as the sub-prime market began to unwind, there is little sign they took steps to manage liquidity risks. Indeed, there are accounts Sowood added risky assets and further reduced liquidity in false confidence.

Ultimately, the fund’s demise happened over a brief five business days ending with a 53% loss and fund closure. The biggest fault was not necessarily the investments themselves but in failing to account for a change in liquidity conditions.

The 2008 Financial Crisis

In mid-2008, when Ben Bernanke was still unaware of an economic recession and downplaying the effects of the sub-prime mortgage market, markets were becoming increasingly erratic. Market stability following the March 2008 Bear Stearns/JP Morgan bailout was a short-lived façade of calm. Chaos erupted in August when Fannie Mae and Freddie Mac, which together held $1.2 trillion of primarily high-quality liquid mortgages on a heavily leveraged basis, were forced to recognize deterioration in the value of their assets. Because of the combination of excessive leverage and eroding liquidity, they desperately raised money to shore up their capital. Most of this came from the government (taxpayer) as they were placed into conservatorship by their regulator.

Other leveraged holders of mortgage-related bonds, such as the world’s largest banks and several international insurance companies, came under similar duress. From August 2008 to March 2009, the threat of bank and corporate defaults grew as asset real estate values continued to fall. Those events created an erosion of trust among and between banks and investors. Liquidity was hard to find in almost all asset markets.

During the crisis, liquidity holes were commonplace, even in the most liquid and least risky assets. In a unique aberration, some high-quality assets fell more in price than lower-quality assets as investors sold anything with a bid. Uncertainty and loss of liquidity became so problematic that many risky asset markets became structurally closed. No bid existed for sellers to entertain. Those in distress had no option but to sell higher-quality assets aggressively and indiscriminately. The need to deleverage and raise cash superseded all else.

Extreme Liquidity

Since the financial crisis, the Fed and most other central bankers have taken unprecedented steps to keep interest rates at multi-century lows. Further, they bolster their balance sheets via QE, thereby delivering direct and indirect amounts of excessive liquidity into the markets.

The graph below, courtesy of Lohman Econometrics, shows the correlation between asset values and central bank assets.

Not only is the Fed providing massive amounts of liquidity, but it spurs investors to use margin debt. This process creates even more liquidity.

The graph below shows how margin debt benefits markets to the upside, but its removal results in sharp downturns. The second graph shows the current use of margin debt, as a percentage of the economy, is at 60-year highs.

With an understanding of the three historical examples, investors should be asking what if the liquidity lift keeping our market plane aloft gives out. More directly, what if the Fed were to reduce liquidity or, worse, was suddenly unable to provide liquidity? An inflationary outbreak or a disorderly drop in the U.S. dollar are two such air pockets that could develop rather quickly. Many others are not so obvious.

Summary

When we are healthy, we rarely think about the air we breathe or the water we drink despite their overwhelming importance to normal body functioning. In much the same way, investors and the media casually toss around the word “liquidity” yet fail to grasp its significance.

As we see today, extremes in tranquility are seen as an “all clear.” In reality, they are future warnings.  The examples we provide, and many others, stress that the time for understanding, tracking, and bolstering liquidity is precisely when it is most available, and everyone else takes it for granted.

We are not predicting an imminent fire in the market’s movie theater or our valuation plane to suddenly plunge 30,000 feet. We are, however, reminding you such events are not infrequent, and given the current environment it is best to have a plan in place for such a liquidity event.

Brilliant interview with Larry McDonald

Erik Townsend and Patrick Ceresna welcome Larry McDonald to MacroVoices. Erik and Larry discuss:

Relationship between inflation and treasury yields

Why One Bank Thinks ESG Could Trigger Hyperinflation

by Tyler Durden via Zerohedge.com

In a recent blog post from DB’s Francis Yared, the credit strategist looks at one of the lesser discussed drivers of inflation and points out that supply shocks to oil prices have historically been relevant for inflation expectations.

As Yared writes, “supply shock to oil prices have had a significant impact on inflation expectations on three occasions over the past half century: in the mid 70s, the mid 80s and the mid 10s.” However, unlike the infamous price explosions of the 70s and 80s, in the latest episode the “shale oil revolution” resulted in a significant positive supply shock to oil markets which led OPEC in 2014 to defend its market share rather than oil prices. The downward pressure on oil prices, Yared writes, resulted in a shift to a lower inflation regime, which was reflected in both consumer and market inflation expectations (University of Michigan 5-10y and 5y5y breakevens) as well as monetary policy expectations and the term premium.

Well not anymore, because ESG is unwinding the shale oil revolution. As recent events at Exxon and Shell have shown, the pressure on oil companies to reduce oil and gas exploration and adapt their business models has increased significantly over the past few months. This is reflected in crude rig counts that have lagged the recovery in oil prices and stand at 1/3rd of the 2014 peak.

Similarly, carbon emission future prices in Europe have risen considerably: as the WSJ reported recently, the price of carbon credits traded in Europe has jumped 135% over the past 12 months and recently hit a series of records as economic activity rebounded from pandemic lockdowns. Only lumber, driven higher by the housing boom, has proved a better commodities investment.

As Yared summarizes, “ESG is a negative supply shock that internalizes the climate cost of the production of goods and services.” This negative supply shock will be inflationary until technological progress absorbs these costs. That could take years.  Moreover in Europe, it could garner enough of political support to justify a more aggressive fiscal policy despite the constraints at the German or EU levels.

To be sure, the global economy has still to contend with the disinflationary impact of ecommerce. However, as DB concludes, “ESG, the Fed’s Average Inflation Targeting regime and a significantly more pro-active fiscal policy (at least until the US mid-term elections) constitute a new powerful combination that should be supportive of a higher inflation environment than experienced over the last 10 years.”

Commenting on his colleague’s observations, DB credit strategist Jim Reid agrees, and writes that “maybe in the fullness of time this surge in mining between 2010-2015 will be the exception rather than the norm and that, in a rapidly changing and ever more ESG sensitive world, it will be  harder to get oil out of the ground. Pricing climate-change externalities more generally could make things more expensive over time. Are we on the verge of another change in inflation expectations due to oil and energy, one that is in large part due to ESG.”

So in case there was still any confusion why the establishment has adopted ESG as gospel – and as a reminder, ESG is nothing new, and many years ago used to be called Corporate Social Responsibility, or CSR and even Nobel economist Milton Friedman warned against its subversive nature 50 years ago when he said that taking on externally dictated “social responsibilities” beyond those directly related to a company’s business opened the floodgates to endless pressure and interferenc – at a time when the same establishment is also desperate to inflate away the nearly $300 trillion in global debt, now you know: ESG looks like the catalyst that will unleash runaway inflation. And if central banks fail to contain it in time, the entire developed world may soon descend into hyperinflation.

Which in turn should also answer the other pressing question: why are central banks so desperate to issue their own digital, programmable currencies? Well, the ability to turn money on and off with the literal flip of a switch will come in extremely useful in a world where authorities have lost control over all other monetary pathways…

Excess Liquidity Is Draining From the Market

by Jason Goepfert via sentimentrader.com

The flood of money that found its way into financial markets is leaving and pooling into economic production. This behavior suggests that  Excess Liquidity is plunging.

On our site, we define Excess Liquidity as:

This shows the growth in growth in M2, a broad measure of the money supply that includes deposits and money market funds, and the growth in the economy. In the long term, they tend to grow together. However, when the supply of money grows faster than the economy (represented by the growth in Industrial Production), the excess money is not invested in “things” but rather tends to find its way into financial assets. Therefore, high levels of excess liquidity tend to be positive for stock prices. Low levels of excess liquidity are negative for stocks but are not as strong as the opposite condition.

We can see just how much this figure spiked and then plunged with the latest economic releases.

Excess liquidity m2 industrial production

The S&P 500 has returned an annualized +20.5% when Excess Liquidity is above 10%, where it had been since last March. Its returns are more in line with random as that figure drops below 10% and heads toward zero. 

The overall takeaway from the plunge in Excess Liquidity shouldn’t be that it’s necessary bearish. More than anything, for the broader market, it’s simply “not bullish.” Stocks tend to perform better when the figure is high.

Energy Stop growing

By Kuppy via adventuresincapitalism.com

For most of my career, oil demand has grown each year and supply has roughly kept up. Sure, it’s overshot in both directions. We’ve seen shortages and we’ve seen gluts. We’ve even seen oil go negative. Throughout this time, we’ve always intuitively known that the cure for high prices is high prices. Last week may have forever changed this prudent logic. I’m starting to wonder if ESG really means Energy Stops Growing.

For those not paying attention, an obscure ESG hedge fund, Engine No. 1, captured two Exxon Mobil (XOM – USA) board seats. It now seems that for companies in indexes, whoever controls the ETF’s votes, now effectively controls their corporate destiny. ETFs are about marketing and asset gathering. There is no better way to stay in the news, looking responsible, than to burnish your ESG credentials. Does an ETF manager care if energy, one of the smallest weightings in most indexes, is now forced to destroy capital by going into run-off while trying to do “green” things? Probably not—they’re all cheering as BP (BP – USA) does exactly that. The attack on XOM was meant as a warning shot to all of corporate America; go along with ESG—or risk a pirate attack.

Meanwhile, over in Europe, Royal Dutch Shell (RDS.A – USA) was told by a court in The Hague to cut emissions by 45% by 2030. Clearly this is impossible even if they don’t drill another well. I expect that this will only embolden similar lawsuits. Most will be thrown out, but enough will be decided against energy producers that it will move the needle. If courts legislate against energy production, then producers will go into run-off. It’s not like there are a lot of investors stepping up looking to fund production growth anyway.

If you hijack energy company boards and get them to stop drilling and you have courts telling energy companies to stop drilling, pretty soon there won’t be any new supply as producers will get the message and stop drilling. Meanwhile, demand will keep growing—it always does. As these data-points continue to stack up, I’m starting to wonder if we’re hurtling towards an energy crisis.

I’m not one to get into the politics of things. Rather, my job is to examine the world and figure out how to profit off human stupidity. If the supply of energy will be constricted, while demand keeps growing, energy prices will have to increase to compensate. The problem is that I have struggled with how to “play” this. The time to buy energy producers was last year and I’m certainly not the type of investor who pays up a few hundred percent. Besides, energy producers are at the mercy of ETF votes, rogue courts and executive orders. I’m sure fortunes will be made in E&Ps, but this isn’t my game. I try to avoid esoteric risks when I can.

I want to draw your attention to the chart above. As we know, the front end of the WTI curve is screaming, but the market remains convinced that there is plentiful supply out a few years. Remember how easy it was for shale guys to ramp up production last time? My hunch is that the ramp up will go slower this time around, meanwhile many years of underinvestment around the world will begin to take their toll on supply. What if XOM is just the first of many ETF hijackings? What if the attack on XOM changes how CEOs run their energy companies—if they want to keep their cushy jobs, they may need to stop drilling. What if the guys running the largest ETFs believe that they can accelerate the transition to “green” energy by dramatically increasing oil prices and making “green” products more cost competitive? It sure seems easier than lobbying governments for “green” subsidies while increasing taxes on fossil fuels—especially in emerging markets that are less focused on the environment. If increasing the price of oil is their “green” transition plan, the current oil price uptick won’t be a short-term thing. Maybe the heat of the move is still coming and it is in the deferred contracts?

I bring this all up as the December 2025 contract is only $6 above where it was during last year’s oil glut—though it is up $10 in the past 6 months. Due to the backwardation of the curve, call options are rather cheap. If the supply side remains restricted, by 2025, the demand side should adjust the price of oil a good deal higher—perhaps dramatically higher. It seems odd that given what we’ve just seen last week, the deferred contracts haven’t really reacted—yet that may be where all the exponential action is. In any case, I like owning things that haven’t yet really moved, despite a positive change in the thesis. I enjoy the simplicity of trades—rather than guessing which producer or service provider to purchase. Last week, I purchased December 2025 futures and futures call options. Despite continued appreciation at the front of the curve, the back hasn’t really woken up. Figured I ought to bring this to your attention. I have a hunch that adding new supply this cycle will be a lot harder than anyone expects, as no one expects the new type of roadblocks that are suddenly getting thrown up. If so, this clearly isn’t getting priced in.

Disclosure: Funds that I control are long December 2025 WTI futures and futures call options.

If you enjoyed this post, subscribe for more at http://adventuresincapitalism.com

where will the next deflation come from? Louis Gave

via evergreen gavekal

The 1986 oil price crash, to an extent, fired the starting gun on 30 years of global deflation. As commodity prices collapsed, so did the Soviet Union, giving the West a deflationary peace dividend. By the early 1990s, Japan’s real estate and equity market busts threatened its banks. The rollout of the North American Free Trade Area and the 1995 “tequila crisis” helped make Mexico a competitive manufacturing hub. Soon after, the 1997-98 Asian crisis made producing abroad even cheaper, while China’s 2001 entry into the World Trade Organization greatly simplified outsourcing. In 2008, the US mortgage bust spurred China to build more infrastructure, unleashing 500mn more workers into the global economy. Europe’s 2011-13 crisis caused another deflationary hit, while the US’s shale energy boom stopped oil and gas prices rising. So today, as inflation expectations move toward generational highs, a relevant question is: where might the next deflationary shock come from?

Europe. If vaccine rollouts let Europeans vacation freely this summer, it is unlikely to spur deflationary forces. The effect should be steeper eurozone yield curves, outperformance by financials and a firmer euro. Yet, if Europeans are told to stay home, another deflationary eurozone crisis could still ensue. Citizens deprived of a vacation may register their protest at the ballot box or, more likely, on the streets. For this reason, the odds are high that Europe re-opens, just as last year’s large fiscal stimulus gets rolled out. We should thus assume that—for now at least—Europe will not be a deflationary black hole.

Commodities. With Europeans set to hit the beach and Americans looking to crank up the vehicle miles, energy prices should stay well bid. And as about a third of the cost of producing commodities is attributable to energy, the broader complex is unlikely to provide any kind of deflationary shock in the near future.

The US dollar. As big projects in emerging economies are mostly funded in US dollars, any strengthening of the unit reduces their growth and depresses commodity prices. So, could a rising dollar unleash deflationary forces? For now, the US currency is making lower highs and lower lows, in spite of higher yields. This is perhaps not surprising, as the Federal Reserve has promised to add US$120bn of fresh dollars to the global system each month. Given such generosity, the threat of a US dollar short squeeze has now greatly receded. Hence, the dollar seems unlikely to be a deflationary force in the near future.

The renminbi. With so much production capacity centered in China, the renminbi’s value is vital for manufacturers. When it is weak, few Western industrial firms can compete with China but when strong, foreign producers can expand margins and/or compete on price. Whether viewed on a three-year, five-year or 10-year basis, the renminbi has been the world’s best-performing major currency on a total return basis, which shows that, structurally, there is little appetite in Beijing for a devaluation. Moreover, as China’s trade surplus hits new highs and the authorities there tighten both fiscal and monetary policies, there seems little reason, cyclically, for this to happen.

US real estate. Homes are getting expensive, with median prices relative to incomes near the highs seen in 2006-07. The difference now is low supply as the stock of existing homes available for sale is at an all time low. Add into the mix the soaring cost of skilled labor and surging prices for building materials and it is hard to see why US real estate prices should crater anytime soon.

Putting it all together, in the coming few years those “usual suspects” that previously unleashed deflation are now more likely to raise the inflationary temperature. Hence, if deflationary forces are going to carry the day, there will need to be impressive productivity gains. Somewhere in the system, someone will have to produce a whole lot more, with a whole lot less. But is this likely given the following trends that have been covered in recent Gavekal reports?

  1. Globalization rollback: productivity gains from outsourced production are under threat as its true social costs have become more apparent.
     
  2. Semiconductor shortage: robots have been touted as replacements for low-end labor everywhere, but as car factories are shuttered for want of chips one has to wonder where robot-makers will find the semiconductors they need to build the robots that will then build the cars.
     
  3. Labor markets: workers across Western economies are being incentivized to stay home and, unsurprisingly, wages are now starting to rise. Indeed, 2020 saw the first meaningful US recession in which wage growth barely fell.

This leaves us in the situation of seeing the price of everything from meat, corn, gasoline and lumber to shipping rates rise without a clear countervailing deflationary force. In an environment of rising government intervention, expanded public hand-outs, higher corporate taxes and more protectionism (and that is just the US!), it is possible that a surge in productivity provides an offset to the growing inflationary wind. But like an Elizabeth Taylor marriage, this seems to represent the triumph of hope over experience.

What makes a 10X bull market possible

via deepvaluespeculator.com

I have gone over some interviews with Sachem Cove Partners (with Mike Alkin & Timothy Chilleri) to see what happened in the last bull market, and what has laid the groundwork for the coming bull market. These interviews are publicly available already, and I have listened to them several times. However, I get something different out of listening, reading or writing on a subject. I therefore hope you get something out of this post, if you have listened to these interviews already.

The last Bull Market in Uranium

As a history buff I believe that history repeats, in some way or another, because people do not learn, or are educated enough about it. A good place to start is therefore to go back to the early 2000s and see how the uranium market behaved then. The price of uranium was at the time $10-14/lb. Long term contract coverage had been sitting in the 31-38% range as a percentage of utilities yearly demand for many years, and you had lived through 15 years of oversupply (and a narrative of that the oversupply would continue). The price of Cameco from 1996 to 2000 can be seen as an example of this narrative. There was not a lot of faith in the market improving anytime soon.

Where was this oversupply coming from? In the late 80s you had supply coming from the Soviet Union and the Megatons to Megawatts program. (The program had bomb-grade uranium from dismantled Russian nuclear warheads recycled into low enriched uranium (LEU). From there the LEU was used to produce fuel for US nuclear power plants). You also had the Olympic Dam mine coming online in Australia in 1988. (The Olympic Dam mine is the fourth largest copper deposit in the world. More importantly to us, it is the largest known single deposit of uranium in the world. The underground mine is a giant made up of more than 450 kilometres of underground roads and tunnels. Copper production accounts for approximately 70% of the revenue, with the remaining 25% from uranium, and around 5% from silver and gold). Last but not least, McArthur River, the richest uranium deposit in the world, began production in 1999. (Olympic Dam is a much bigger mine, while the grade of uranium at McArthur River is a lot higher. This means you have to move a lot less earth at McArthur to get the same amount of uranium from the ground). When in production, McArthur River was the world’s largest producing uranium mine, accounting for 13% of world mine production. With uranium mining entering the new century, you had seen a plethora of supply coming online with prices staying low.

With prices staying low there was less exploration, development and production from producers. However, the saying of “Low prices is the cure for low prices” was starting to work itself out. In the early 2000s you saw that there was a tremendous amount of under contracting, with utilities not contracting their annual consumption needs. Because of this, inventory was down right before the uranium bull market of 2004.

I have seen presentations from Sachem Cove Partners that have shown this under contracting, and I have compared this to the numbers Kazatomprom has been given by UxC. (UxC is, according to their web page, the industry’s leading source of Publications, Data Services, Market Research, and Analysis, on the Global Nuclear Fuel Cycle Markets). Sachem Cove have done the graph in percentage of yearly consumption, and Kazatomprom have been given the amounts in million lbs. Even though the graphs do not match 100% the picture is very similar. When I took the numbers from Kazatomprom over a simplified assumption of 180 million pounds consumption per year, I got a graph very close to the one Sachem Cove Partners have been using.

In the early 2000s you had a much higher supplier/producer inventory compared to 2021, and lower utilities inventory compared to 2021. However, when you add both of those together, the inventories are lower in 2021 than they were then. (People who cherry pick data will focus on utilities inventory, and say they are well covered now and do not look at the total). The longer we wait, the more these utilities inventories will be drawn down. With a lot less readily available supply from producers when utilities run out, you do not want to be the last one to contract. You do not want to be the one without a chair to sit on when the music stops.

We can continue our story and look at what happened when the prices started to tick up: 

Back in the early 2000s there were a host of factors that had an influence on the market. First of all there was a narrative of increasing demand from planned nuclear plants around the world. Nuclear was going through a bit of a Renaissance and several countries looked to nuclear as the solution for their energy needs. Experts in the sector therefore saw that there was a bigger probability of a supply deficit in the future. 

At the same time the sector was experiencing supply shocks. There had been a flood at McArthur River. There had been a fire at the Olympic Dam mine. There was a failed delivery of uranium with a ship carrying uranium that had run aground. Inventories were already low and the market was tightening. This was because you had all this under contracting in the years before. If you want to know what was being said back then, the UxC Winter Survey is a good place to start. In the February 2003 issue they had a quote saying: «This perennial optimism actually makes the future imbalance between supply and demand worse. Buyers don’t believe there’s a problem, so they delay contracting, failing to send the needed signals to producers. For their part, producers have been burnt so many times in the past that they are not about to invest more on the mere promise of an improving market. Consequently, nothing gets done.» (UxC does not have all its work public, but I found it republished in their November 3, 2003 issue of The Ux Weekly). 

Price of uranium was in 2003 at about $10-14/lb. Even with all these supply shocks and a bright future the spot market was still not responding. In the more forward looking stock market, the price of Cameco had started a run from under $3 in 2002 and was between $6-7 in November 2003.  

The ingredients were low inventory levels, underinvestment by suppliers (exactly like we have seen the last couple of years) and supply shocks. The difference today is that you have an even better demand story and there is no new mine supply coming online before at least $45/lb. (Last bull market we already had McArthur River coming online at the bottom of the market, before the turn up towards $137/lb).

Why has the market been horrible for the last 10 years?

Uranium has inelastic demand. This is both an advantage and disadvantage. There is no substitute when it comes to fuel for the nuclear plants. You need uranium to be converted to enriched uranium and fabricated into fuel pellets to wind up in a nuclear reactor. Whether it drops or is rising in price, utilities have to buy it. The nature of the market is one that is characterised by very long term contracts between nuclear utilities and uranium mining companies. The reason for that is that it provides the utilities the security of supply (because there is no substitute for uranium). 

Typically you see long term contracts (which by definition according to the industry is a contract that’s signed today but delivery is in the future) and they typically last seven to ten years. That is how it historically has worked. What happens with those contracts is that it gives utilities security of knowing they have supply, but it also gives (when you have changes in supply and demand that are natural to any business cycle) uranium miners a false sense of security when prices are dropping. 

After Fukushima in March 2011 the price of uranium was in the 72-73/lb range before it started its march down to $18/lb. Today (in May 2021) the price is off the bottom around 30/lb. Before Fukushima had its meltdown, Japan was 13% of world nuclear power generation, and it was a significant buyer of uranium. Within 18 months all the Japanese nuclear plants were shut down (54 in total). That took a big chunk of demand out of the market. What you started to see was the price being adjusted. Like in any market that works off regular spot pricing, it adjusts very quickly. When price starts to go below the marginal cost of production, you would tend to see supply come offline. You don’t do it immediately because these are long lived assets that cost a fortune to build. If you expect demand to come back you are not going to just shut them down because price dips below $45-50 per pound. However, when it stays around, and below, these levels for a fairly long time, you’ve got to start thinking about cutting production.

Well, the uranium mining industry didn’t cut production so a lot of where the price is today is self afflicted. The reason why is because they had the security of those long term contracts. So as the price was dipping in the mid-teens in the 2014-2016 period, miners were saying the Japanese have to come back to their nuclear power. It’s a third of their electricity generation (just around the time LNG was really ramping up). The population was still adjusting to the perception of Fukushima. 

The miners kept producing, they kept exploring, they kept expanding their businesses while prices were plummeting because they had the security of supply (from long contracts). We also had Kazatomprom ramping up production in this period and emerging as the world’s biggest producer of uranium. You finally got to a point where you still saw production growth into a declining price market and as those contracts rolled off you started to see a bleak picture. Most producers could not sell at those prices. If they announce tomorrow that they will start up, it will take time to get their production rate back up.

Conclusion

In broad strokes this explains how the sector has come to where it is today. (This is not an exhaustive list of all the factors. For that I would need the post to be a lot longer, and dive even further down into the rabbit hole). The stock market has up until 2020 priced the sector as it is in a liquidation phase. When a sector is priced this way there is a great potential with just a handful of positive news.

With several years of production cuts, utilities drawing down their inventories, this surplus has been worked off. Uncovered demand is getting bigger and bigger and we have experienced supply shocks with close downs of mines from Covid-19. We are seeing extensions of nuclear plants and big new build programs in the East. The spot price has still not moved, but just like in 2003 the stock market is forward looking. If we exclude the March 2020 sell off, Cameco is up more than 100% from $8-9 early 2020 to almost $20 in May 2020. If the market will continue as it did the last time still remains to be seen, but there are arguments that the conditions are just as positive as they were then.

The interviews I have used for this post is: SMITHWEEKLY RESEARCH: Uranium Sector Update – The Cycle Has Turned and Capitalist Exploits: Big Question – Mike Alkin & Tim Chilleri from Sachem Cove

The big commodity short

via deepvaluespeculator.com

Most people are aware that I am a Uranium Bug and that I have a good allocation to precious metals. I have also just recently made my first allocation to the oil business, but I have to admit that I am optimistic about the whole commodity sector. I have tried to give an explanation for this enthusiasm in the following paragraphs. 

Backdrop

Commodities are currently 50% cheaper than their lowest point the last 50 years if you compare them to the S&P 500. There are several reasons for this. The cyclical nature of commodities is that we go through boom and bust cycles. We have seen many of these over the decades. Still, the latest downturn has been exaggerated by a number of contributing factors:

A big factor is there is so much passive money waiting to chase the next big thing. We are looking back at 10 years where everyone has been piling into tech companies, weed and cryptocurrencies. Some people are maybe a bit agitated that these sectors have taken away money from commodities, but there is also a silver lining. Instead of having a better funded market, that might be in a supply and demand equilibrium, we are seeing great potential for outside returns on our investments.

I listened to a great interview with Mark Thompson on the podcast “Mining Stock Daily” in their “Tin Special”. He put into words what has been in the back of my mind about the commodities sector for a long time:

The median fund in the world’s allocation to commodities is zero, and most funds do not touch it. In the 80s and 90s, the risky part of people’s portfolios were either allocated to biotech or to commodities exploration. That part is now consumed by tech companies or bitcoin (and other cryptocurrencies) instead. We therefore have not had the needed allocation to commodities that you need to find new deposits. This has in turn affected the supply side. This underinvestment makes commodities very attractive after 10 years of underinvestment.

In the meantime commodities, which are essential for maintaining our living standards, have underperformed. The cost of producing the commodities is in many cases higher than what the companies make selling them. This has led to production cuts and supply being removed from the market. Prices have to increase a lot to incentivize production. However, this supply can’t be turned back on with a flip of a switch. Ramping up production takes time. The companies have to hire and train workers, permits have to be granted and CAPEX investments have to be made. 

The easiest example I can choose from here is uranium. The world is totally dependent on uranium for the 10 % of energy production coming from nuclear power. If we want a snowball’s chance in hell of making the climate goals, we can not depend on windmills and solar panels alone. At today’s prices the cost of producing uranium is higher than what they get paid by utilities. For incentivising new supply the price of uranium has to go up. If not quoting Rick Rule the lights go out. 

We have the same scenario with battery metals like #lithium #nickel and #copper needed for electrification of the world. There are many other commodities that I have not mentioned, but safe to say I am bullish on most of them.

In the coming commodity super cycle we will see massive amounts of passive funds crowding into the different commodity sectors. Passive investing has increased by a lot the last 10 years, and this will hit the very small markets like a ton of bricks. This will have a bigger impact than most people can imagine. When 50% of the market is passive, it will be very different from the bull run in the early 2000s. Passive flows say: let’s buy what is going up no matter what price. Because of this you get big moves. I believe we will see new all time highs in most of the commodity sectors. Many of the sectors today are trading for a total value under the value of companies like Apple or Amazon. When passive funds see the outperformance of the different commodity sectors sustained over time, we will see a rotation away from growth/tech stocks. It is just a question of time. 

We are seeing some evidence for this already. Again, I will give some examples from the uranium sector, it is the one I am following the closest. In Australia Paladin will be included on ASX 200 and 300 later this year. This means that there will be passive flows coming into the company and give the valuation of the company a tailwind. In Canada we have the same situation with Nexgen and Denison Mines will be added to the S&P/TSX Composite Index.

The picture above is a comparison between QQQ (an ETF that includes 100 of the largest companies listed on the Nasdaq stock exchange) and URNM (the NORTH SHORE GLOBAL URANIUM MINING ETF). The last year URNM has a return of 222% compared to 63% for the QQQ.

I expect this to be a trend we will see continue over the next 5 years. After overperformance the funds will rotate out of their old favorite sectors and enter the commodities sector. A couple more quarters of outperformance and we should witness the metaphor about forcing the contents of Hoover Dam through a straw coming to fruition.

The Big Commodity Short – Deep Value Speculator