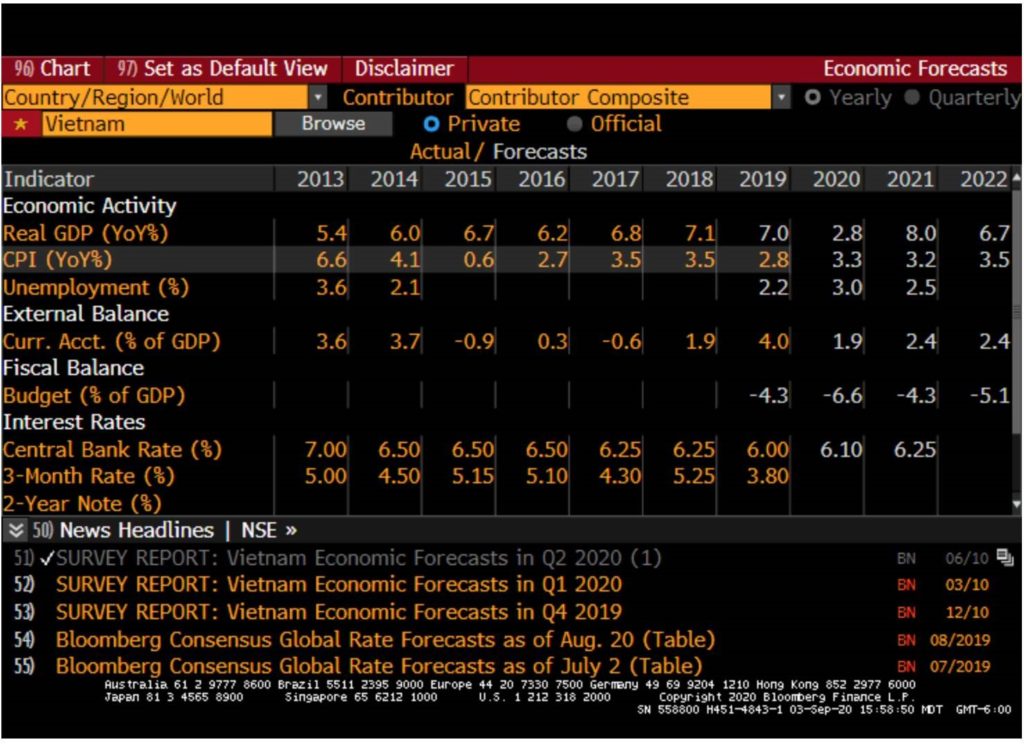
Vietnam is one of the few countries left in the world which will still boast a double digit nominal GDP growth rate. They have 200-300 BP of real rates and a low fiscal deficit which is rarity in today’s world. Positive real rates, low and stable inflation, low unemployment and Positive current account balance is a characteristics of a strong economy. India was exhibiting all these characteristics ( except positive CA balance) in 2002-2003 just before a domestic consumption boom was born.
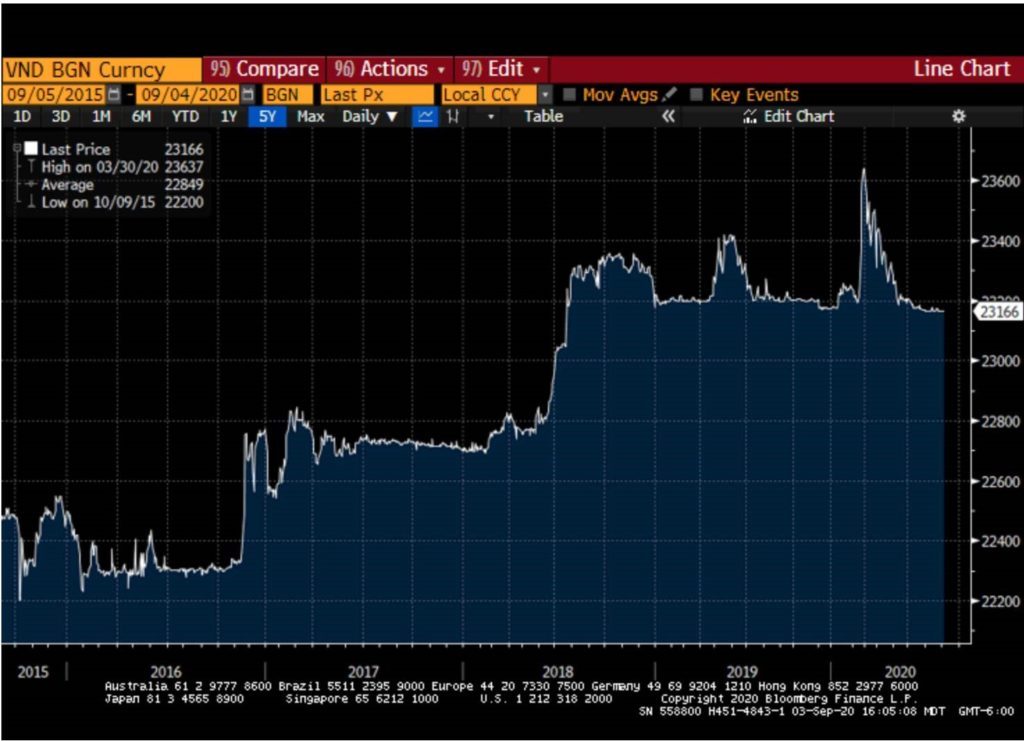
Vietnamese dong has been stable even in the year when Dollar was strong ( between 2015-2019). This is because Vietnam was the beneficiary of huge FDI during those years. In spite of stable currency Vietnam outperformed its ASEAN neighbors which saw depreciating currencies but still couldn’t compete with Vietnam on exports.
Summary of my discussion on Vietnam with an industry insider
Country is communist divided into two camps Pro-China which is in power Pro US which is gaining power
Irrespective of who is in power the work goes on and only the favorites shift but bribes and competition among provinces to attract foreign capital does not hamper the work There are three countries which are becoming favorite of South Korean and Japanese companies looking to “reshore” out of china and Vietnam is the favorite for Low end tech followed by Philippines and then Bangladesh ( for garments and textiles) Low end tech assembly can be easily taught to the Vietnamese because they have high level of basic education. Electronics is the biggest industry in Vietnam and average salary is $300 USD per month Like any other developing economy consumption is the best way to play Vietnam He told me a story about Indian Conglomerate which wanted to set up a steel plant in Vietnam and they were able to easily source iron ore and coal but were not willing to grease any palms . The steel plant went to Korean company Vietnamese military owns a bank and is a big asset owner but they don’t interfere in the economy There have been a bank failure in the past but Vietnam central bank did not allow the bank to go bust and have gradually tightened prudential norms over a period of time He believe that Vietnam has a great future and like any other Emerging economy will have its share of setbacks but in spite of communist characteristics Vietnam is very pro-business
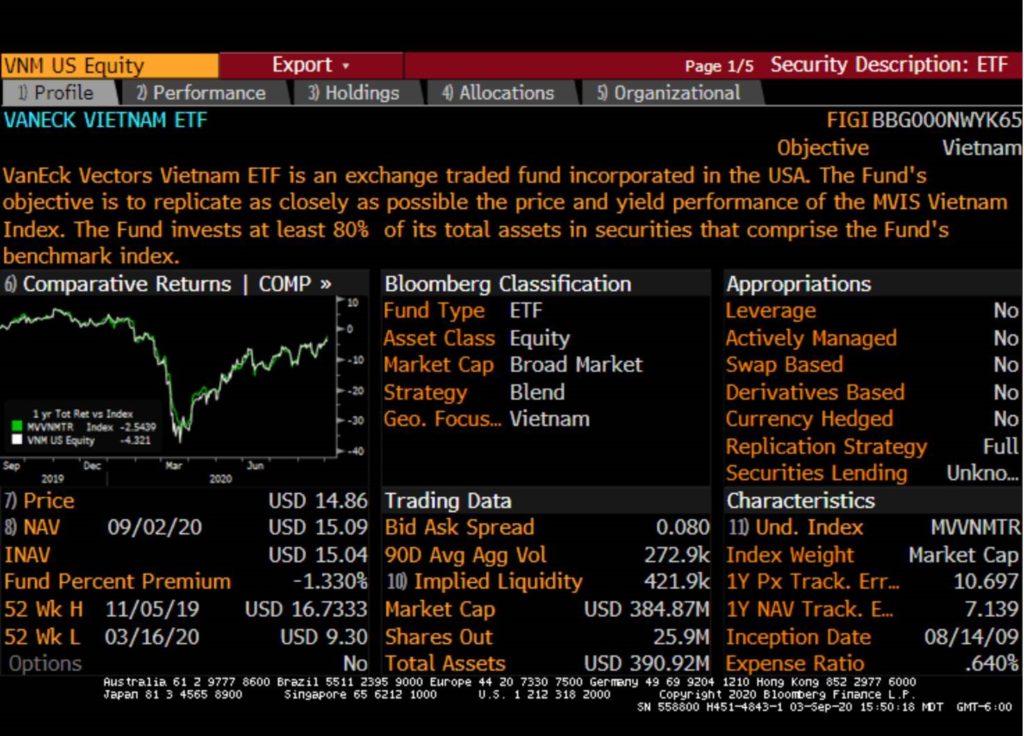
Below is the geographical holdings of VNM Vietnam ETF). You will see some south Korean and Taiwan companies over here. The reason is that as per mandate VNM invests in companies which derive at least 50% of their revenues from Vietnam.
The portfolio is a healthy mix of exports and domestic growth companies. There is also some details about the average valuation. The average daily traded volume are close to 200000 shares
( This is not an investment recommendation. Please do your own due diligence before investing)
Samuel Rines has written a timely article on tapering and what does it mean for the markets.
Tapering Paradox
“Either the well was very deep, or she fell very slowly, for she had plenty of time as she went down to look about her and to wonder what was going to happen next.” ―Lewis Carroll,Alice’s Adventures in Wonderland / Through the Looking-GlassOver the past week or so, a few Federal Reserve officials have begun to say that “tapering” its quantitative easing program could occur in late 2021.While on many levels this seems to be a bit of wishful thinking, it is worth exploring what that actually means.In the summer of 2013, Ben Bernanke signaled tapering would occur in the fall. That became known as the “taper tantrum” as yields moved higher and the dollar strengthened.But – as it turns out – the actual tapering in January 2014 did not see a rise in long rates. Instead, long rates were pressured for the next couple years.As it turns out, rhetoric of a taper is far more powerful than the act of a taper. Currently, it is the rhetoric phase. That should not be forgotten.
Quantitative easing – the Federal Reserve’s purchases on U.S. Treasuries and Mortgages and other securities – is a powerful tool. And – long with the traditional fed funds rate – “QE” has become one of the Fed’s favorite tools to combat crises.Recently, there have been rumblings from Fed officials that QE could be “tapered” (reducing the dollar amount purchased month to month). While somewhat odd (the U.S. unemployment rate stalling at 6.7% and elevated levels of non-participants in the labor market), understanding the likely consequences of this rhetoric and an actual tapering of QE is useful.
The “taper tantrum” of 2013 provides a bit of perspective. In testimony before congress, then Fed Chair Ben Bernanke stated QE was likely to be tapered in the fall. Yields rapidly moved higher higher (as did the U.S. dollar). This shock to the system caused the Fed to back away from its plan to taper bond purchases in September 2013 to January 2014.As it turns out, yields peaked as the taper began and continued to fall for the better part of two years as the Fed halted purchases.
This seems paradoxical. The Fed slowly stopped buying billions in bonds, and bond prices rose and yields fell. But on a deeper level it makes sense. QE is a powerful tool, because it boosts confidence in positive economic outcomes. This boosts “term premium” or the compensation investors demand for holding bonds over time due to the risk of higher rates. Positive economic outcomes tend to increase interest rates. Not to be overlooked, liquidity being added to the system boosts the outlook for inflation too.When the Fed stopped doing so in 2013, these measures began a persistent decline. The likelihood of better than expected economic data faded, and inflation was no longer expected to move higher in a meaningful way. Hence, longer-term interest rates (most sensitive to economic outcomes) declined.
Importantly, the majority of 2014 saw fairly robust growth that continued into 2015. In other words, yields were falling back before economic growth sputtered. The move lower was accentuated – but not started – by slowing economic growth. Simply, the Fed changed the outlook for yields by removing a critical support for yields, not prices.
All the talk around a taper is strange. One of the tools the Fed has been trying to exploit is “forward guidance” – the ability to succinctly and clearly communicate its monetary policy well into the future. It is a “cheap” policy tool as long as market participants believe what you say. All the rhetoric of a tapering risks pulling forward expectations for a rate hike as well. That is not something the Fed is keen to do.The critical part of the taper rhetoric is that it matters more than the actual taper. Meaning, interest rates are likely to move higher during the rhetoric phase, not during the implementation of a taper. A paradox worth considering.
Because LIQUIDITY creates Fundamentals and not the other way round.
1987- US equity market crash led to Fed cutting rates – Dollar went down, and the capital moved into Japan and Japanese real estate.
At one-point Japanese imperial palace was valued more than the entire Manhattan. The bubble finally burst, and Japan has not seen those levels in equity markets even after 40 years
2001- Tech bubble crash led to Fed cutting the rates – Dollar went down and the capital moved into Emerging markets creating a bubble in EM
2008-9 crash led to Fed cutting the rates- Dollar did not go down and the money remained in US creating the US markets and US tech bubble (we are in late stage of this bubble)
2020- COVID-19 crash led to Fed cutting the rates- Dollar goes down and the money starts moving into Commodities and Emerging markets creating a bubble (we are in early stage of this bubble)
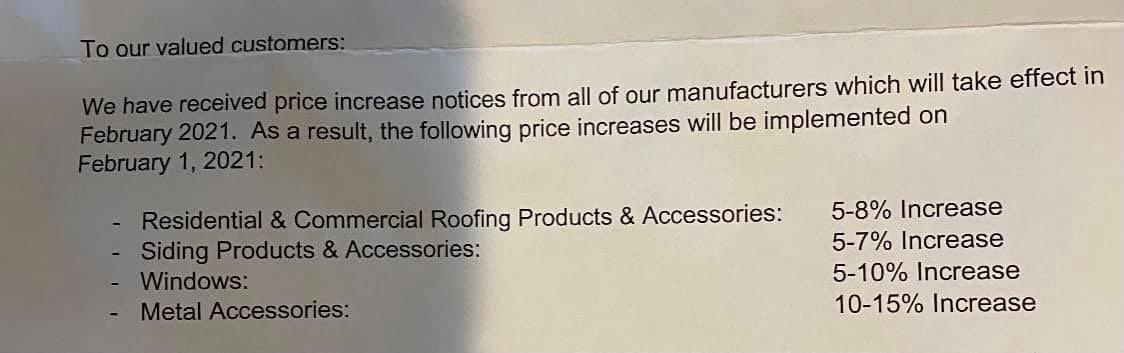
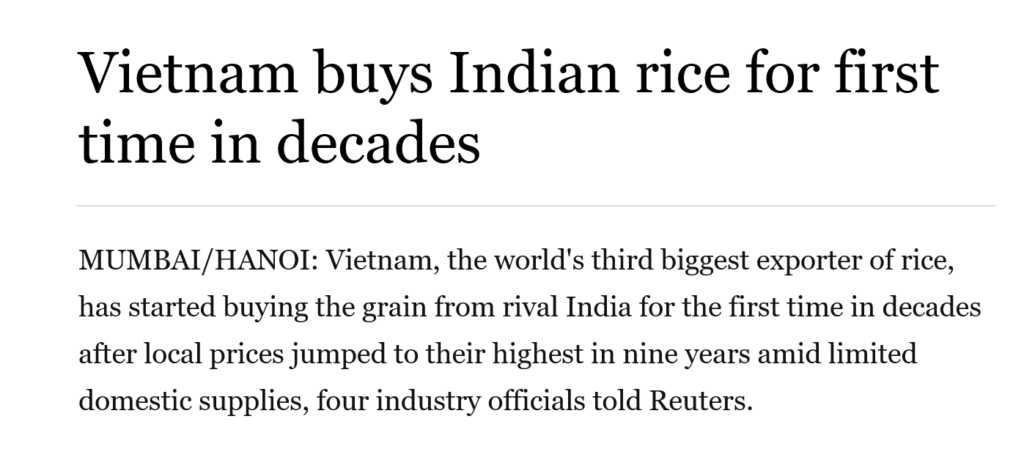
Vietnam, the world’s third biggest exporter of rice, has started buying the grain from rival India for the first time in decades after local prices jumped to their highest in nine years amid limited domestic supplies, four industry officials told Reuters.
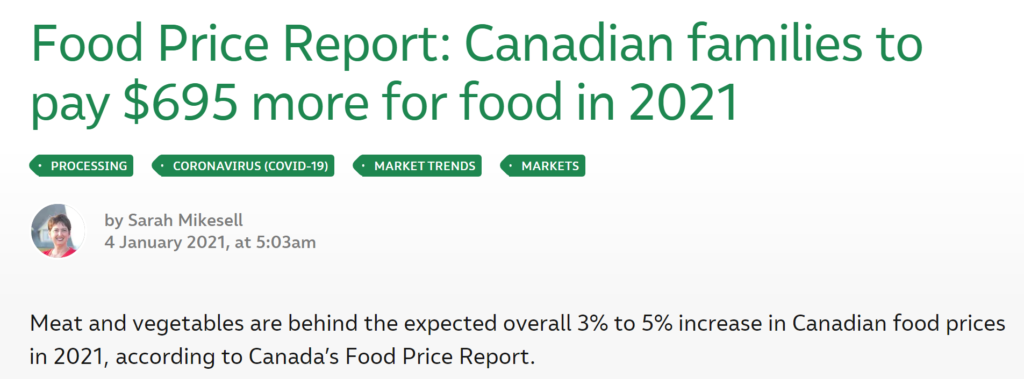
Food inflation back with a bang
The purchases underscore tightening supplies in Asia, which could lift rice prices in 2021 and even force traditional buyers of rice from Thailand and Vietnam to switch to India – the world’s biggest exporter of the grain.
Indian farmers and exporter are big beneficiary.
In December, the world’s biggest rice importer China started buying Indian rice for the first time in at least three decades due to tightening supplies from Thailand, Myanmar and Vietnam and an offer of sharply discounted prices.
Food inflation is here and unlike base metals, agricultural items can be substituted leading to rise in the entire agri basket
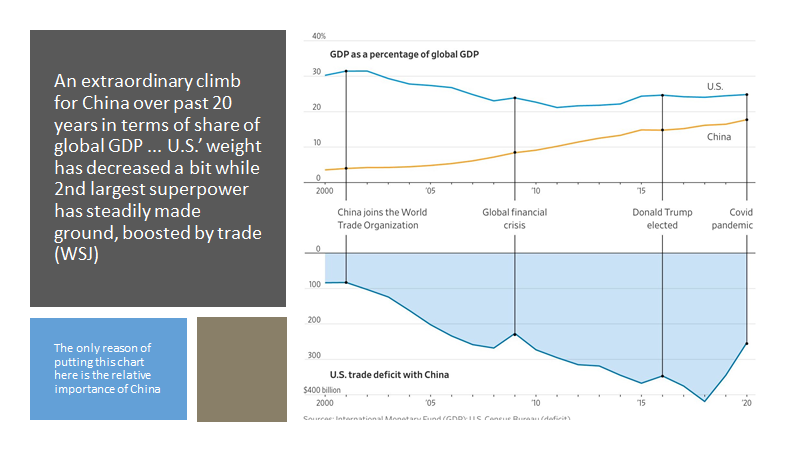
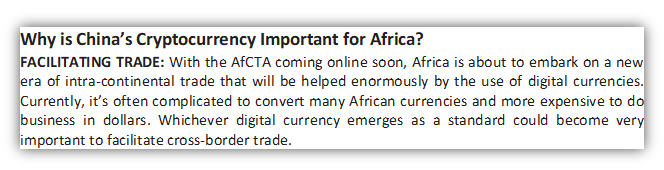
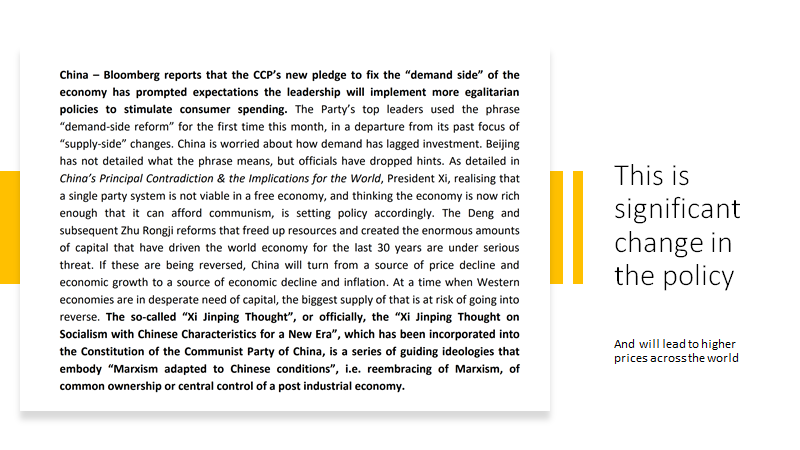
China digital Yuan will be a threat to US dollar hegemony is well known but what is not discussed is the effect it will have on economies along the Belt and Road countries.
when you watch this video from George Gammon you would be able to visualize the effect of Chinese CBEP on the economies of African continent
Today, much like in the past, it is not the best idea that wins, but the narrative which captures the most mindshare. Nothing rings true than this quote of 1933 made by the Propaganda Minister of Nazi Germany
“It is the absolute right of the state to supervise the formation of public opinion.”
As Coronavirus cases continue to increase in many parts of the world and lockdowns are put in place, the story should look grim; but there is also light at the end of the tunnel because of vaccines. After the vaccines have been administered to most of the population, there will be plenty of pent-up demand that will help the economy recover. That said, who needs vaccines when you have the central banks backstopping the markets by introducing high amounts of liquidity?
What appear to be bubbles right now, could go exponential. As J.C Parets write “News was poison in 2020. It will be worse in 2021”. The investors who often get markets right knows how to shut off the news and focus on what is important.
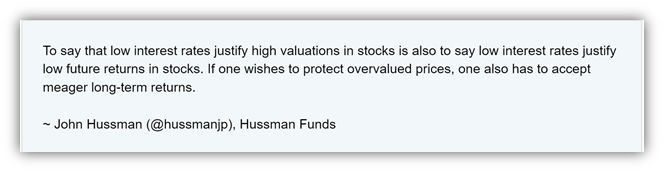
The vast liquidity we have today is emanating from the balance sheets of central banks. As more electronically printed dollars are pumped into financial markets, the cost of financing goes down, thereby pushing asset valuations higher. This view is further reinforced by a weakening dollar, and even by the fact that Jerome Powell has called out the explicit link between low interest rates and the high valuations in markets.
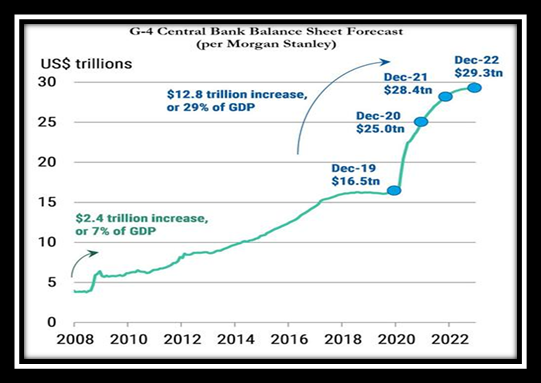
Vast amounts of liquidity can also create a lot of fragility in markets. Even if central banks continue injecting liquidity into the system, at some point markets will fully price it in. Once that happens, it can become the bigger driving force that may set up markets for a taper tantrum 2.0 of sorts as the system demands not just a continuation of liquidity provision but increasing amounts of it. Investors should no longer continue to think about how much central bank balance sheets have increased, but rather the rate at which the balance sheets are growing. The exhibit below by Morgan Stanley points to a deceleration in the rate of growth of G-4 central bank balance sheets as we approach the end of 2022.
As most readers will already know, financial markets are complex systems, which means they are highly interlinked and have feedback loops. These feedback loops lead to nonlinear effects, which means small shocks can transform into large ones due to each node in the system being interlinked to other nodes. For comparison, when too much snow accumulates, the probability that even a small snowflake can trigger an avalanche goes up significantly.
With the median correlation across asset classes reaching new highs, the probability of an avalanche goes up. Nobody could have predicted COVID-19 from appearing when it did; but what had been known for a while was that due to globalization, the world was much more prone to eventually experience a global pandemic. In a similar fashion, as markets become unhinged from their underlying fundamentals and become liquidity driven (which in turn drives correlations higher), the probability of an ‘avalanche’ occurring in the markets is becoming more and more likely.
The response to the global pandemic was to provide financing through loan guarantees and green asset financing by the government. We have had quantitative easing programs since 2008, but we have not seen inflation in goods and services because banks were not lending money. This meant that an increase in the money supply did not make it into the real economy. Today, however, after experiencing an economic shock caused by COVID-19, the government response has led to money reaching the real economy.
The pandemic has taught governments that they can now – through MMT-lite programs – lend directly to the economy through the commercial banking channel.
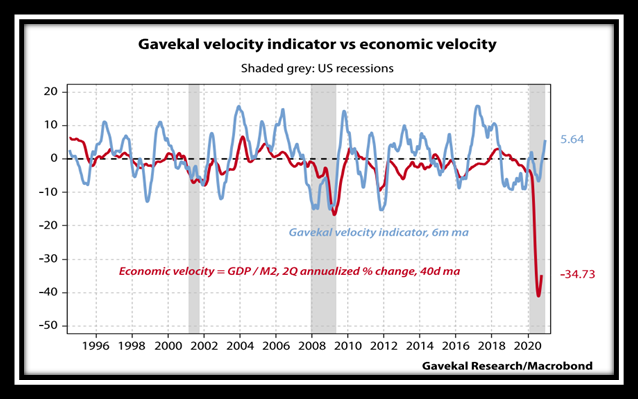
“You can lead a horse to water, but you can’t make him drink” is an apt quote for liquidity (M2) sloshing around in the system but refusing to multiply (M3). The M3 velocity has been stubbornly falling since March 2020 but as per Gavekal’s Velocity Indicator this money is finally looking to multiply. Said differently, the horse has finally decided to drink water.
But before you start admiring the below chart you should keep in mind that
What is good for the economy is bad for the markets and what is bad for the economy is good for the markets.
Let me explain. Liquidity is fungible. It can either go to the Financial markets or it can go the real economy. If vaccines work and business closures and layoffs subside then the money hiding in financial assets will spill over to the real economy and force Monetary policy to tighten financial conditions.
So, rising Money velocity is not good for Financial markets and on the contrary will lead to elevated volatility in financial assets.
The increase in velocity is bad for US dollar and US Dollar should continue to fall but not in a straight line. This liquidity is currently lifting all boats, but I think we will see some assets doing better than others in 2021. My bet is on Japan, Vietnam, African Continent, and commodities in general with a continuing bullish stance on precious metals, crude oil and agricultural commodities.
Central Bank digital currency.
A lot has been written in the media about central bank digital currencies (CBDC), and we might see the dawn of CBDCs with China increasingly looking like the first one to launch its version, known as CBEP.
As per a MicroStrategy paper titled “The cost of Money being nothing”:
If money supply is created centrally, it must also be used, or directed, centrally as indeed we are seeing at the moment with the lockdowns and the enormous surge in budget deficits. Under a CBDC scheme, the central bank would become arbiter of who should and shouldn’t be granted credit. By determining the price of money, it determines what is “value” and thereby what is produced and consumed, and how it is produced. It determines what the real return on capital is and how much capital is destroyed. By printing money to buy Treasuries, it has reshaped the entire economy around greater government spending and control. Under a central bank digital currency, monetary policy will become completely political.
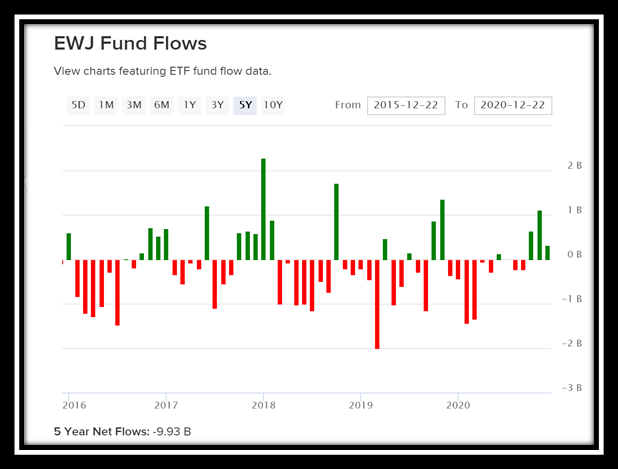
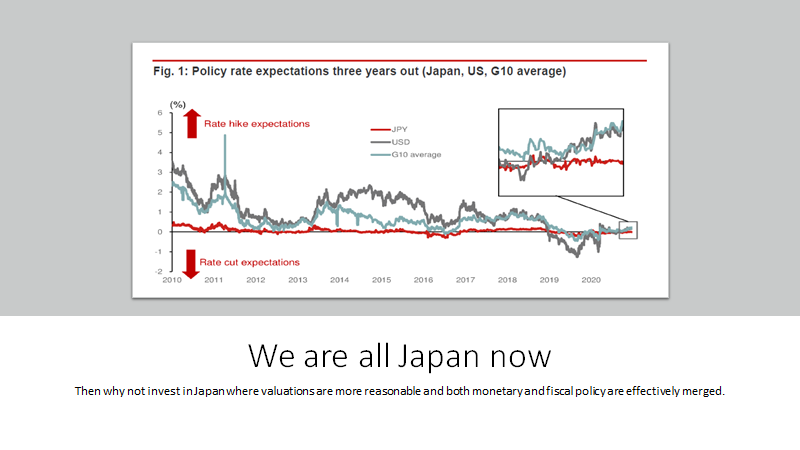
Bullish on Japan
Japan is the only country in the G-7 where monetary policy and fiscal policy are working seamlessly thanks to embedded Abenomics reforms. Valuations are cheap, and more importantly, it is a very unloved market from an institutional and retail investor perspective. Below is a chart of 5-year flows into the biggest Japanese ETF (EWJ).
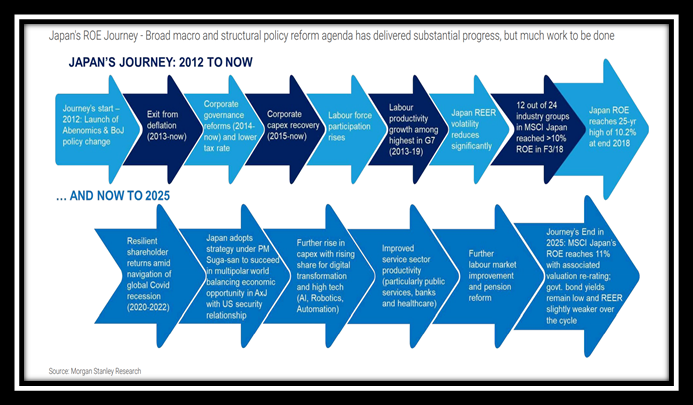
Further, this chart from Morgan Stanley explains the Japanese story in simple terms:
Bullish on Vietnam
Vietnam will be one of the few countries in the world that will boast double-digit nominal GDP growth rates once the COVID-induced slowdown is over. The country has real rates in the range of 200-300 bps and a low fiscal deficit, which is a rarity in today’s world. Positive real rates, low and stable inflation, low unemployment, and a positive current account balance are characteristics of a strong economy. India was exhibiting all these characteristics in 2002-2003 (except a positive CA balance) right before a domestic consumption boom began. Vietnam is also going to be a big beneficiary of a “reshoring boom” out of China
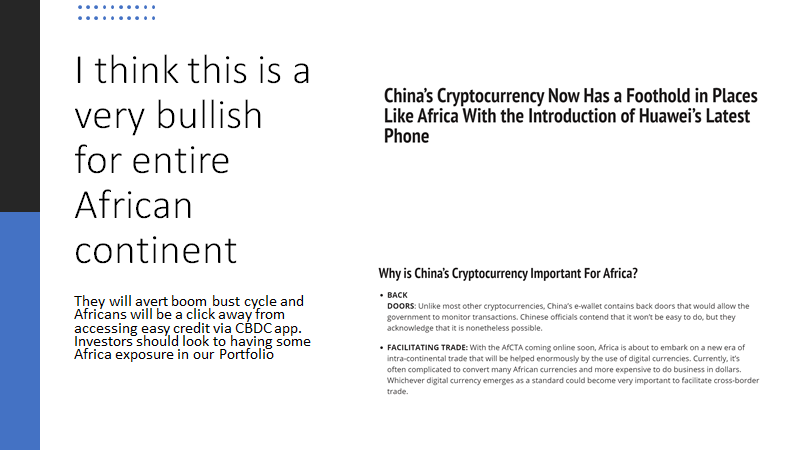
Africa is resource rich and it is going to be the next frontier of growth led by technological advancement, connectivity and more importantly the battleground of largesse for the two competing superpowers i.e., US and China. China is already increasing its influence in Africa through its Belt and Road Initiative and it plans to complement that by extending its CBDC reach over the entirety of the continent.
African countries will have much better access to credit and will be able to sidestep a boom-and-bust cycle of currency devaluation, providing them with much needed economic stability.
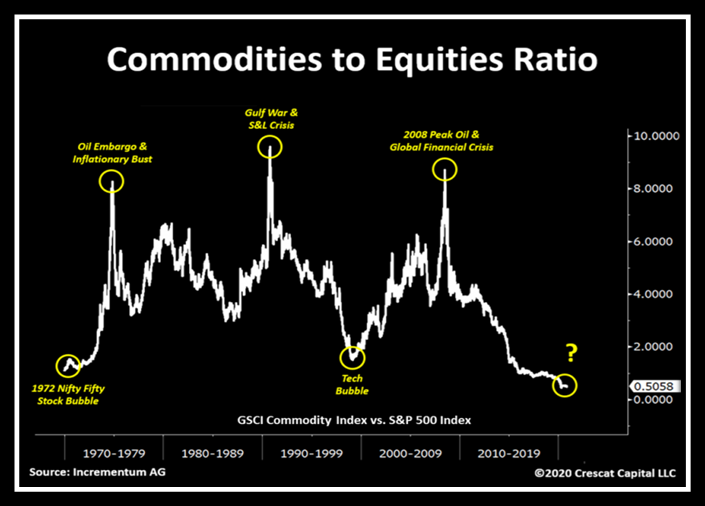
Commodities almost always rise when there is a supply side shock. The rise in commodity prices is rarely demand driven because demand can be modeled, while supply shocks are much harder to predict. If you see the chart below you will find that all peaks and troughs happen around events, and I believe that COVID-19 was such an event, which has broken supply chains across the world. The years of underinvestment in commodities and energy in general was waiting for a catalyst to start showing up in prices and I think we have that catalyst firmly in place. I also believe that soft commodities, base metals, the entire energy complex including coal and Uranium and precious metals will see more inflow of capital as they are under represented in investors portfolio.
Where can we lose the most money?
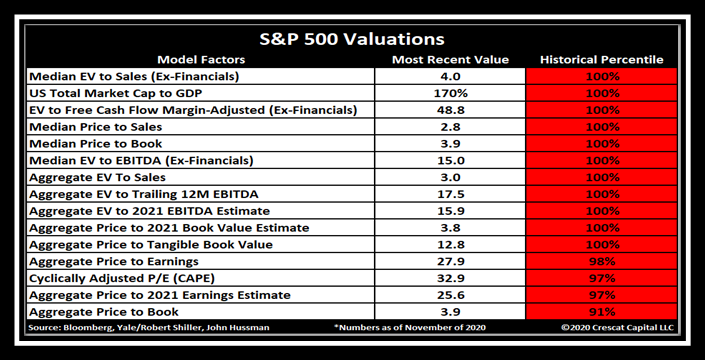
We must understand that markets are not cheap by any measure.
I would say the easiest answer is in consensus, but the most concerning thing for me is the sentiment. Now, this does not mean we will get an imminent price correction, but it does mean that the market is vulnerable to any negative catalyst. I do not recall grappling with so many of these negative catalysts at the start of a year, and especially when most assets were not cheap from a historical perspective. The resurgence of the virus, a surprise increase in inflation, policy missteps, a jump in bond yields or bond spreads, fears of stagflation, China launching its digital currency, broken supply chains, geopolitical flashpoints etc. – and the list is still not exhaustive by any imagination, in my opinion.
I believe that there is a reasonable possibility that any of these catalysts could materialize and give us a risk-off environment at various points in 2021. I expect to see a 10-20% correction in broad indices whenever a risk-off episode materializes with much larger drawdowns for individual securities. All corrections will be met with a forceful response from Monetary and/or Fiscal authorities who are left with no choice but to support the system and hope to inflate away the massive overhang of debt built in the system.
The best way to play this environment is either through having cash (at least 30%) as an asset allocation, ready to be deployed at short notice, or by buying far out of money call options on volatility whenever the markets are in a euphoria stage.
The cash deployment during these events should be in commodity producers, asset owners or Emerging Markets.
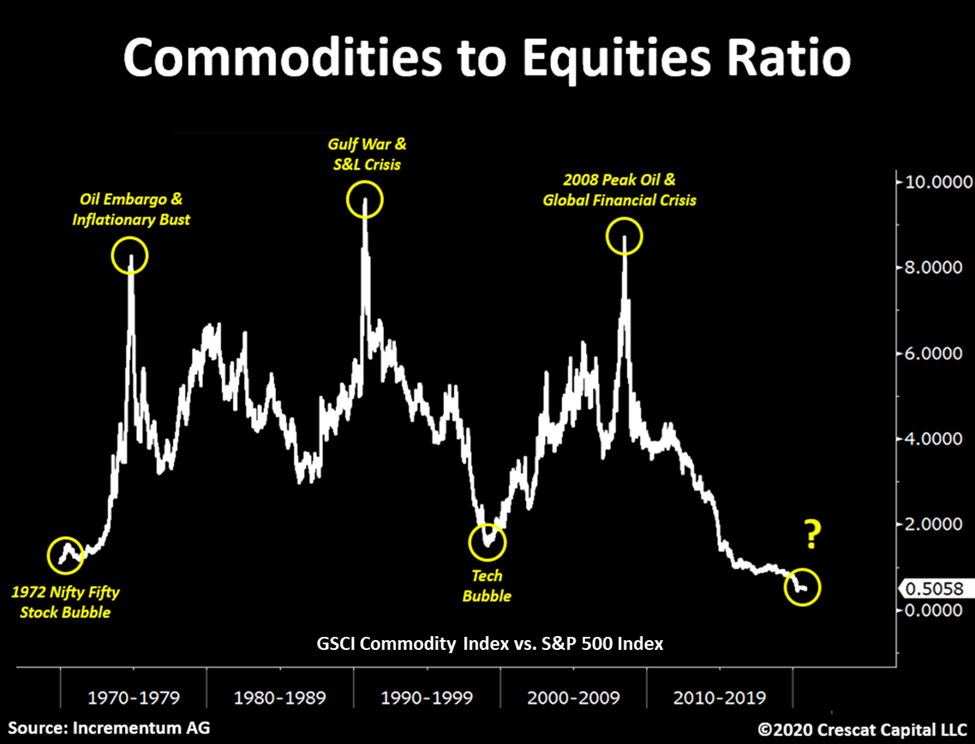
Markets are cyclical. Today, stocks trade at record high valuations while commodities are historically undervalued in relation. The setup is in place for a macro pivot in the relative performance of these two asset classes. Comparable conditions were present with the 1972 Nifty Fifty and 2000 Dotcom bubbles as we show in the chart below.
As capital seeks to redeploy towards the highest growth and lowest valuation opportunities, we expect analytically minded investors will soon be rotating, if not stampeding, out of expensive deflation-era growth equities and fixed income securities and into cheap hard assets, creating a reversal in the 30-year declining trend of money velocity.
Today’s Modern Monetary Theory world with its double barreled fiscal and monetary stimulus is crashing head on with an accumulation of years of declining investment in the basic industries such as materials, energy, and agriculture. In our analysis, the “end game” for the Fed’s twin asset bubbles in stocks and bonds is inflation. We can already see it developing on the commodity front.
The scarcity of jobs and abundance of debt were factors preventing the economy from reaching its full growth potential even before Covid-19. Such have been the concepts underlying the output gap, the theoretical paradox that is thought to have held inflation in check over the course of the last business cycle. But based on comparable historic periods, the macro setup for inflation is more likely to be kicked off by an input gap, i.e., shortages in the primary resources needed for both a strong reserve currency and economic growth at the same time as policy makers pull out their biggest bazookas yet to boost aggregate demand. We expect a new wave of rising commodity prices, set up by past underinvestment in basic resources, to soon ripple through the global supply chain creating a headwind for real living standards. Welcome to the Great Reset.
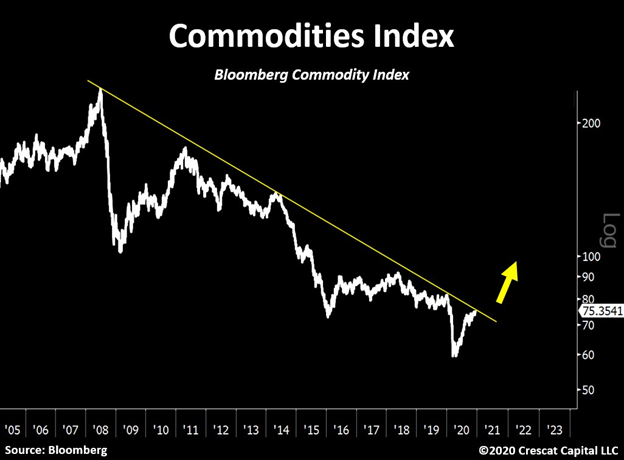
The global economy is at risk of commodity supply shock inflation, something we have not experienced since the 1970s. Both the Bloomberg Commodities Index and the US 30-year inflation expectations are now re-testing a 12-year resistance line. A significant breakout from here would be a big shift in the macro investing landscape. Yes, the aging demographics problem and significant technological advancements are deflationary tailwinds. But in our view, the key reason why consumer prices have not gone higher is due to a long-standing period of depressed commodity prices, a trend which we think is about to change.
The Constrained Supply for Gold
When it comes to scarce commodities, at Crescat, we have an affinity first and foremost for gold and silver, the monetary metals that are among the most supply constrained resources on the planet. Coincidentally, they are facing a new surge of investor demand.
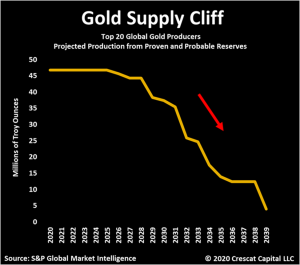
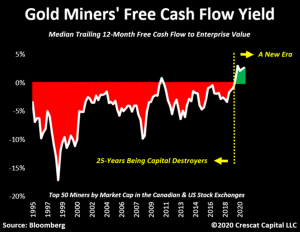
On the supply side, in the disinflationary environment since the precious metals mining industry’s prior peak in 2011, gold and silver miners have been criticized by investors as being capital destroyers. As a result, the industry’s spending discipline in the last decade has swung completely the other way. The majors have underinvested in replacing their reserves creating a supply cliff for the industry while also substantially boosting free cash flow.
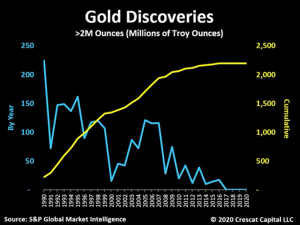
Contributing to the supply shortage, the number of major new gold discoveries by year, i.e., greater than 2 million Troy ounces, has been in a declining secular trend for 30 years including the cyclical boost between 2000 and 2007. At Crescat, we have been building an activist portfolio of gold and silver mining exploration companies that we believe will kick off a new cyclical surge in discoveries over the next several years from today’s depressed levels.
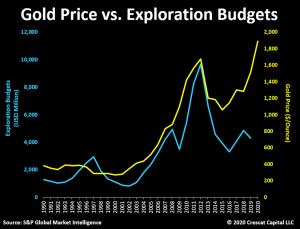
Gold mining exploration expense industrywide, down sharply since 2012, has been one of the issues adding to the supply problems today. Crescat is providing capital to the industry to help reverse this trend.
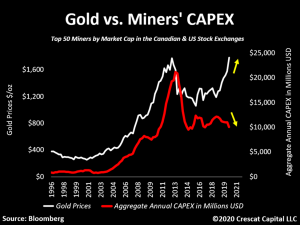
Since 2012, there has also been a declining trend of capital expenditures toward developing new mines. From a macro standpoint, gold prices are likely to be supported by this lack of past investment until these trends are dramatically reversed over the next several years. Credit availability for gold and silver mining companies completely dried up over the last decade. Companies were forced to buckle up and apply strict capital controls to financially survive during that period. Investors demanded significant reductions in debt and equity issuances while miners had to effectively tighten up operational costs, cut back investment, and prioritize the quality of their balance sheet assets.
It is important to consider that the last times this industry had been acting in a similarly conservative fashion, metal prices were at historically low-price levels. This time, however, we are seeing corporate discipline with gold prices remaining near all-time highs. As a result, the major producers today have surprisingly swung into being cash flow machines. They are enjoying more free cash flow than they had in the past 25 years, an incredibly bullish setup for the entire industry, especially the smaller exploration focused players that Crescat is overweight in today. The majors are in a great position to harvest cash for the next few years. But they are also facing a supply cliff because they have not replaced their reserves. Over the next several years, they will need to make acquisitions in the exploration segment to rebuild them.
The Demand Side for Gold
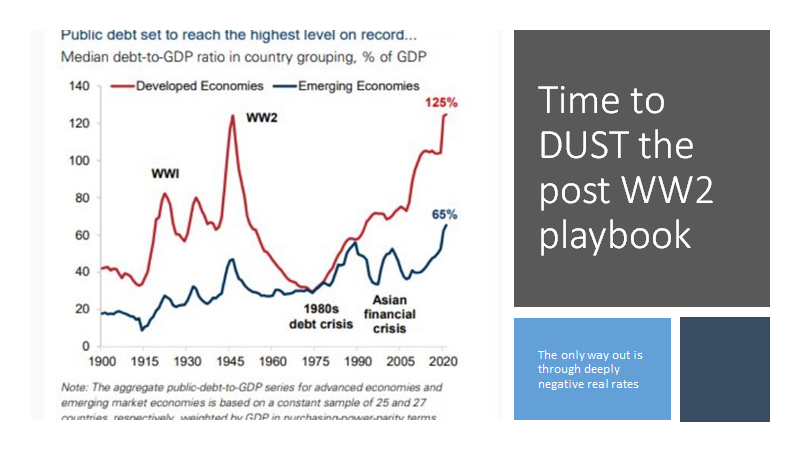
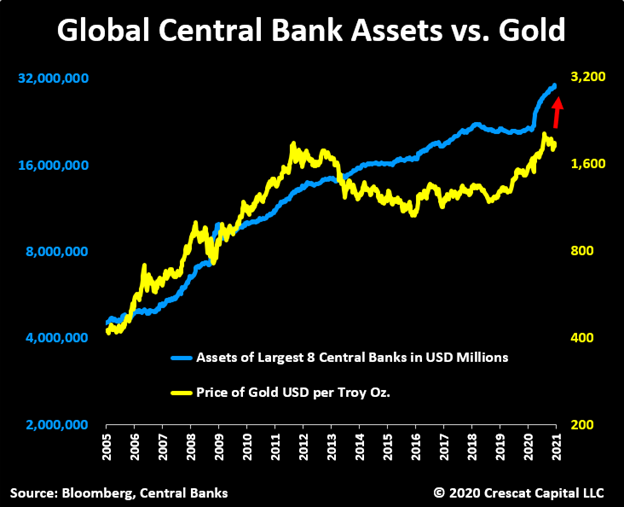
On the demand side, the first key macro driver for the price of gold is central bank debt monetization, which drives increasing inflation expectations and investor demand for inflation protection for accumulated savings. Today, money printing through central bank balance sheet expansion is widely accepted and embraced. It is the only viable policy as a way out of the otherwise deflationary global debt burden, at a historic high of 365% of worldwide GDP. With deficits at World War II levels in the US, we expect money printing to be the path of least resistance among policy makers towards easing debt burdens and reconciling many of today’s economic imbalances, though it will likely come at a cost to savers who are invested in overvalued traditional financial assets.
As we show in the chart below, gold underperformed the pace of global money printing from 2011 to 2018. But since the Repo Crisis in 2019 and the coronavirus led recession that followed, global QE has been accelerating to the upside once again. Gold is being pulled up with it. Our near-term target price for gold is north of $3,000 per Troy oz. based on our macro model shown below that plots the price of gold vs. the aggregation of the top eight central bank balance sheets. This target will almost certainly be rising in the near-term with $5.8 trillion just in US Treasuries alone maturing in 2021 and much of that needing to be rolled over and funded by the lender of last resort.
The Fed, the printer of the world reserve currency, has given itself, and by extension its central bank counterparts around the world, the green light to err on the side of inflation. The US central bank has declared that it can exceed its 2% inflation target temporarily abandoning one side of its dual mandate to favor the other side of it which is full employment. So, err on the side of inflation, the Fed almost certainly will.
Inflation is a toothpaste that sovereign Treasuries and their central banks throughout history have struggled putting back in the tube once they have let it out. In practice, inflation is driven in large part by the expectations and actions of consumers and investors which are hard to predict and occur with lags and unknown multiplier effects in relation to monetary policies. When consumer and investor psychology shifts toward recognizing and acting upon rising inflation, it becomes highly reflexive, i.e., circular and self-reinforcing.
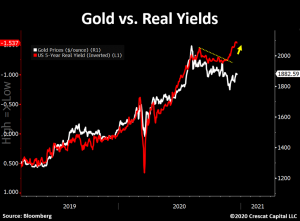
The second key macro driver for upward trending gold prices on the demand side today is declining real interest rates, which are a combined reflection of central bank interest rate suppression tactics and investors’ rising inflation expectations. The recent plunge lower in real yields (shown inverted in the chart below) has diverged from the price of gold signaling a strong impending move upward again in the metal.
The outlook for gold all ties back to the bigger macro imbalances we see in the US economy today. The Federal Reserve is crippled in its ability to prevent inflation and instead has become the funding mechanism through its massive purchases of US Treasuries that enables the US government to run a large fiscal deficit. The Fed essentially has no independence in the matter. It must fund the government’s fiscal stimulus programs as the lender of last resort. And as the repo crisis showed, the liquidity is also necessary in the short run to prevent the equity and corporate bond markets from collapsing, but this is very shortsighted because rising commodity prices and real-world inflation, that is the byproduct of the newly printed money, is the killer of record overvalued financial assets.
Three Comparable Macro Setups in History
We expect inflation expectations to continue to rise at a faster rate than nominal interest rates. This is ultimately a self-reinforcing catalyst to drive investors out of overvalued stocks and credit and into scarce commodities including precious metals and oil, which is exactly what happened in three similar macro setups to today:
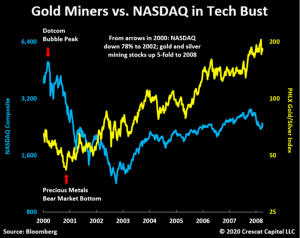
1. During the dotcom bust at the turn of the century, the NASDAQ Composite declined 78% over two and a half years, a period during which gold stocks diverged to the upside to begin a five-fold march upward over the next seven years, while energy and industrial commodities also caught fire.
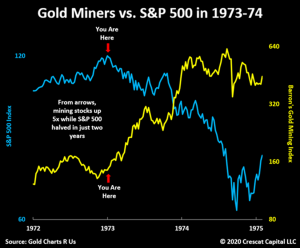
2. In the 1974-74 bear market, the S&P 500 declined 50% in two years while gold mining stocks increased five-fold at the same time as oil prices skyrocketed during the 1973 Arab Oil Embargo and a decade of stagflation was born.
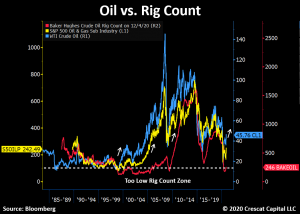
We showed the supply cliff setup for gold earlier, but it is important to note that there could also be a supply shortage in oil setting up for the next several years after the most drastic capex cuts in infrastructure and exploration we have seen in the history of this industry. In that vein, the rig count cyclicality has been an incredibly reliable contrarian forward looking indicator for oil prices. As shown in the chart, prior historical dips also preceded key market bottoms in WTI prices and the oil and gas industry.
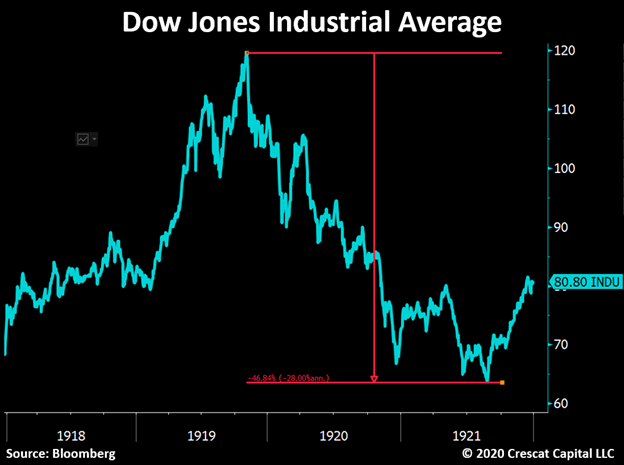
3. The third comparable period, also highly apt for today, was coming out of the Spanish flu pandemic of 1918 and 1919. At that time, the health crisis had severely limited the industrial capacity of the economy, leading to major supply shortages of raw materials and causing commodity inflation at the same time as the world began to heal. The rise in wholesale prices became a global phenomenon. Grocery stores began hoarding inventories to sell at higher prices, forcing governments to intervene and criminalize these actions to avoid an even larger hit to the consumer. The cost of living surged and prompted major labor union protests on the streets demanding higher wages and salaries only exacerbating the problem. Inflation spiked above 20% in 1920 and the Dow Jones Industrial Average began a decline of 47% from peak to trough from 1920 to 1921 while the world emerged from the pandemic. We will not go there in depth now, but this was the same time that a whole different kind of inflation was arising in Germany from newly printed money to pay off accumulated war debts.
The Opportunity for Activist Gold Exploration
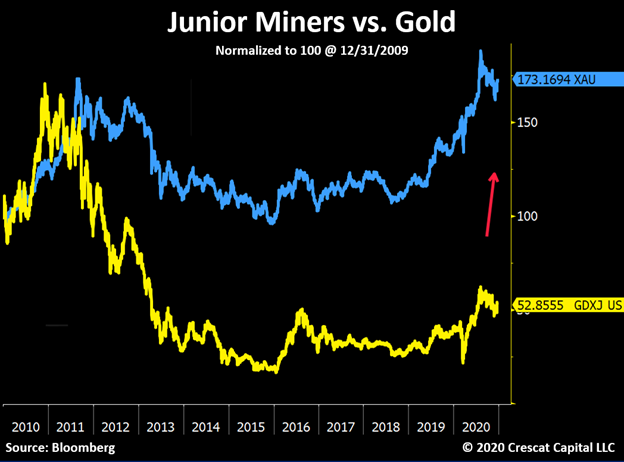
As we showed above, the underinvestment in most of the last decade in the gold mining industry will soon send the majors scrambling to invest their near term soaring free cash flow in the most prospective new gold and silver deposits being explored today. These properties are in the hands of the extremely undervalued and ultra-depressed small cap segment of the mining industry, the junior explorers, a group that has been through a brutal, capital starved bear market that effectively lasted ten years. The whole industry completed a double-bottom retest by successfully holding above its 2015 lows and rebounding sharply to lead all industries in stock price performance coming off the March 2020 correction. We think there is much more performance ahead for this industry as it is still in the early stages of a new secular bull market.
We are confident that within the precious metals mining industry, the most value for shareholders will be created from the small cap exploration segment over the next several years. We think Crescat’s Precious Metals Fund and SMA strategies have already started to demonstrate that potential in 2020.
By working with world-renowned exploration geologist, Quinton Hennigh as Crescat’s geologic and technical advisor, Crescat has already created an activist portfolio of over 50 companies where we are among the largest shareholders of a targeted 200 million ounces new high-grade gold equivalent discoveries. We plan to continue to grow these targeted ounces while getting the needed investment capital to our companies to prove out these economic deposits through drilling and discovery.
Crescat’s activist fund is a large and significant capital deployment opportunity. We are currently seeking a select group of right-minded institutional partners who can understand and appreciate the focus, scale, and timeliness of what we have set out to accomplish in this fund.
Our activist portfolio is positioned ahead of a likely major new wave of M&A by the large and mid-tier producers which is still to come as they necessarily must replace their reserves through acquisition. We also have a handful of holdings that we call keepers, the cream of the crop companies that control the unquestionably new world class, high grade gold and silver deposits that will catapult them into the next great mid and large cap gold producers in the industry over the course of the new secular bull market.
To be frank, buying gold or silver is not a contrarian investment position today. There are enough people in agreement with the idea that all government backed fiat currencies are doomed to some level of devaluation through inflation due to the level of fiscal and monetary imprudence and unsustainable debt imbalances in the financial system. Naturally, with a constructive view on precious metals, the next step for most investors is to start dipping their toes into well-known and established mining companies. Despite their past reputation of being capital destroyers, investors today are warming up to the idea of buying the “Newmonts and Barricks” of the world or even ETFs such as GDX and GDXJ. What we see as contrarian, however, is a much bigger opportunity to unlock value through a well targeted activist strategy in the exploration segment of the industry. No doubt, many are skeptical of the gold exploration business, given its poor performance during the last downturn in the industry at large, but the biggest gains today in the industry are likely to come from what are the smaller cap names. Between Crescat and its 21 years of money management experience and Quinton Hennigh with his 30+ years of gold mining exploration experience to serve as Crescat’s geologic and technical advisor, we believe we have the expertise and preparedness to navigate this incredible opportunity before us. We hope you will join us as we seek to exploit the mispriced opportunities on the exploration and discovery side of the Lassonde Curve that is still in the early stages of what is likely to be a new rip-roaring secular bull market for precious metals.