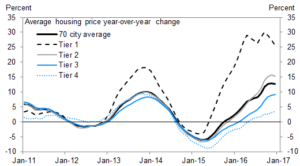
China House Prices and what a bounce in last 18 months
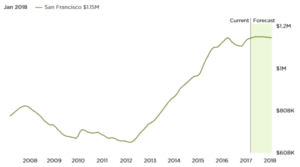
This is not Vancouver or Australia house price ….. this is San Francisco
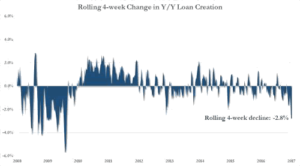
But nobody is taking loans for business.For a contraction to start, banks don’t have to call loans.
All that is needed is that bankers become nervous and stop making them.
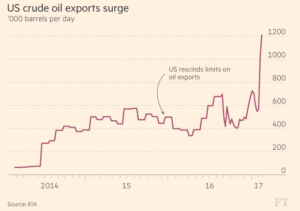
US Shale Oil is Killing OPEC. US now exports oil and is no longer interested in the security of middle east or its oil
“At the peak of the 2014 boom, the break-even cost of U.S. shale oil was $60. Today, the figure is nearer to $30. In some places, the breakeven cost is just $15 a barrel.”- The Times, March 20.
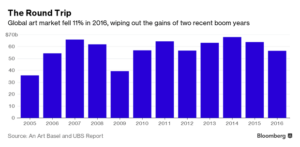
This one is of ART.The chart is of sales volume.Double Top with 2007 and 2014.At the tops,there must have been a lot of certainty.
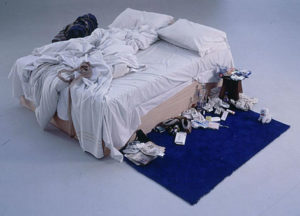
Check out the followingThe art piece, “My Bed”was originally sold by the artist for £150,000 in 1999 to an art dealer, for display. In 2015 it was sold at auction for £2.5 million.
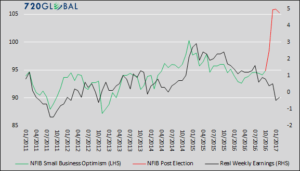
Small Business optimisim is soaring. Post Trump Optimism is in Red.Real Earnings are in Black.
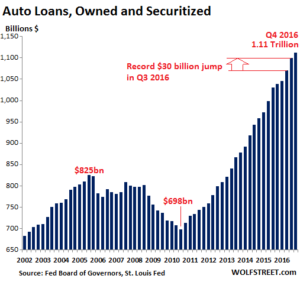
JP Morgan believes that used car prices will crash by upto 50%.
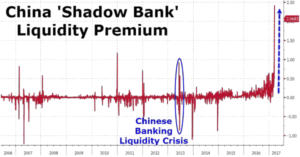
China has a huge shadow banking system .China has been responsible for 50% of global credit growth in since last 5 years and china shadow banking aided by cheap liquidity has played a big role in this growth
The result is that stocks of crude and petroleum products are well above five-year highs.