Lets start with Art
Art Market Bubble Bursting – Gauguin Priced At $85 Million Collapses 74%. Russian billionaire Dmitry Rybolovlev paid €54 million or $85 million for a landscape by Paul Gauguin (featured below) in a private transaction in June 2008. Yesterday, he incurred a whopping 74% loss on his store of value “investment” as reported by Bloomberg.
This painting was worth $85 million in 2008.

Bond Curve Flattening
Curve Watchers Anonymous is taking a hard look at the yield curve in light of the now odds-on market view of a March rate hike.
Before looking at the data below, where do you think rates are relative to January 2014? Up, down, or sideways?
Duration 1-Jan-14 1-Mar-17 Direction
30 Year 3.96 3.06 -0.90
10 Year 3.04 2.46 -0.58
5 Year 1.75 1.99 0.24
2 Year 0.38 1.29 0.91
1 Year 0.13 0.92 0.79
30 Days 0.07 0.63 0.56
The 2-30 spread flattened by a whopping 181 basis points in just over two years.
The 2-10 spread flattened by 149 basis points.
Not to worry, despite poor economic reports, Fed governors have stated: “This is a surprisingly strong economy.”
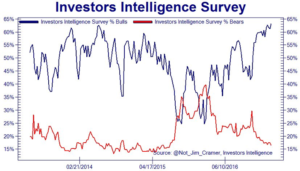
And this is from CNBC “Wednesday’s strong showing for the stock market came as the Investors Intelligence survey of newsletter writers showed extreme bullishness again. The percentage of equity bulls came in at 63.1%, up from 61.2% in the prior week and the highest level since 1987. The survey is used as a contrarian indicator because excessive bullishness has been seen at or near market tops in the past”.
As Martin Armstrong writes, it is all about capital flow
“This European crisis is pushing up the Dow and capital flows from smart money is starting to vacate Europe headed into the Dow for that is where “big money” always hides. Of course, domestically, they are attributing this as always to just local issues now praising Trump’s speech as optimistic”
So Art bubble deflating, yield curve flattening, Equity investors overtly bullish and big capital hiding in dow.
Equity is the last man standing ….. lets see how long it lasts
