
read moe
Making sense out of Chaos
Paul Tudor Jones, founder of Tudor Investment Corp and the man who famously predicted the 1987 ‘Black Monday’ stock market crash, recently spoke with CNBC about the ‘crazy’ mix of monetary and fiscal stimulus that reminds him of “early 1999” and the height of the Dot-Com bubble.


Martin Armstrong writes and I concur that ‘Bond yields” are the canary in coalmine. He writes in his blog in response to a question by a reader about “what to watch out for”
“The first was the inverted yield curve which led many to think we were heading into a recession last summer. Then the Repo Crisis hit and despite being touted as just a fluke due to taxes, after more than three months the Fed cannot get out of providing liquidity without stepping back and allowing the free markets to raise short-term rates.
The liquidity crisis has spread even to Japan. Here the Bank of Japan has stood up and announced it would but government bonds without any limitation trying to also prevent interest rates from rising.
The ECB will have to deal with the whole negative interest rate crisis they have created. They will be forced to allow rates to rise or all member states will have to agree to allow the ECB to adopt the same policies as in Japan — buy all government debt without limit.
Keep an eye on Europe. I do not see any way of avoiding this crisis. Politicians are too busy with other things. The free market will push rates higher and the central banks will be unable to prevent the rise in rates ahead.”


Today is the ECM day and I am a student of cycle. Marin Armstrong, in my view is the foremost authority on cycles.
Martin writes in his blog..
The Economic Confidence Model has marked specific highs and lows in markets to the very day at times depending upon the shifts in capital flows. Why has the business cycle been masked in complexity that has prevented many from comprehending how it functions? I believe this is the result of the average person always attempts to reduce everything to a single cause and effect. What they fail to grasp is the level of complexity involved which incorporates weather, war, innovation, population changes, the migration of people and economies over the face of the earth.
By Doug Noland
ETF.com: “…Investors kept plowing money into U.S.-listed ETFs. A cool $13.4 billion flowed into the space during the week…, sending year-to-date inflows to $35.2 billion, well ahead of year-ago levels of $8.4 billion.”
Bloomberg: “Global currency volatility has dropped to the lowest level ever recorded.”
Bloomberg: “Bond managers are starting to contemplate the prospect of another decade without a Federal Reserve interest-rate hike.”
Bloomberg: “Forward price-to-earnings ratios for U.S. growth stocks have reached levels only seen in eight months over a span of three decades of data…”
Reuters: “J.P. Morgan Chase posted profit and revenue that smashed through analysts’ expectations on a strong rebound in trading revenue… Bond trading revenue surged 86% to $3.4 billion…”
Bloomberg: “‘This is Insane’: Muni Yields at the Lowest Since Elvis was King.”
We’re witness to historic developments across global financial markets that extend far beyond an equities melt-up. U.S. corporate Credit this week traded near the narrowest spreads (to Treasuries) since 2007. Popular Credit default swap (CDS) indices priced this week to pre-crisis lows – investment-grade and high yield. At 46 bps, Goldman Sachs (5-yr) CDS closed the week at the low since 2007. JPMorgan CDS fell five bps this week to 30.6, the low going back to October 2007. A Leveraged Loan index closed out the week at record high prices. European fixed-income CDS ended the week at or near multi-year lows – investment-grade, high-yield and financial. And this week from Bloomberg: “U.S. High-Grade Market Devours Nearly $100 Billion in New Debt.”
This historic financial Bubble is a manifestation of Monetary Disorder and a direct inflationary consequence of an unprecedented global Credit Bubble. There were new data this week from the Institute of International Finance (IIF).
January 13 – Reuters (Marc Jones): “Global debt is expected to climb to a new all-time high of more than $257 trillion in the coming months, the Institute of International Finance estimated…, adding there was no sign of it retreating either. The amount works out at around $32,500 for each of the 7.7 billion people on planet and more than 3.2 times the world’s annual economic output, but the staggering numbers don’t stop there. Total debt across the household, government, financial and non-financial corporate sectors surged by some $9 trillion in the first three quarters of 2019 alone. In mature markets total debt now tops $180 trillion or 383% of these countries’ combined GDP, while in emerging markets it is double what it was in 2010 at $72 trillion, driven mainly by a $20 trillion surge in corporate debt.”
Global debt has been expanding at the most rapid clip since 2016. After ending 2015 at about $210 billion, global debt growth has been in parabolic rise to the IIF’s Q1 2020 estimate of $257 billion. This historic debt expansion has been across the board, household, corporate, government and financial – “emerging” and developed economies. From Reuters: “All parts of the world are loading up… Household debt-to-GDP have reached a record high in Belgium, Finland, France, Lebanon, New Zealand, Nigeria, Norway, Sweden and Switzerland. Non-financial corporate debt to GDP topped in Canada, France, Singapore, Sweden, Switzerland and the United States. Government debt-to-GDP has also hit an all-time high in Australia and the United States.”
Total global debt ended Q3 2019 at 322% of GDP, up from the year ago 319%. Global government debt rose to 88.3% of GDP, up from 86%. Corporate debt increased to 92.5% from 91.6%, and Household to 60.2% from 59.6%.
Emerging Asia continues to pile it on, boosting Total Debt-to-GDP to 271% (from the previous year’s 262%). China’s Credit Bubble saw Total Debt expand from 297.4% to 308.5% of GDP. China’s Corporate Debt-to-GDP ratio rose to 156.7% from 154.4%, while rapidly expanding government Debt increased from 49% to 53.6%. From Reuters (Marc Jones): “China’s government debt also grew at its fastest annual pace last year since 2009…, and household debt and general government debt are now at all-time highs of 55% of GDP.”
Asia’s debt boom is a particularly alarming accident in the making. With corporate debt rising to a staggering 227% of GDP, total Hong Kong Debt exceeds 500% of GDP (Financial Debt declining to 133.5% of GDP). Singapore’s financial Bubble continues to inflate, with Financial sector borrowings increasing to 187.7% of GDP (up from 184%). Total Singapore debt inflated to 473.5% of GDP from 462.3%. South Korea is also worthy of special attention. With corporate debt jumping to 101.6% from 95.3% of GDP, total South Korean debt surged to 325.6% (up from 304.5%).
From Reuters: “Another potentially risky trend is that the amount of emerging market ‘hard currency’ debt – debt sold in a major currency like the dollar that can become hard to pay back if a crisis hits a local currency’s value – reached $8.3 trillion in Q3 2019, $4 trillion higher than a decade ago.”
The IIF used salient language: “Spurred by low interest rates and loose financial conditions…” Pondering the data, one thought repeatedly comes to mind: These central banks have really done it this time.
January 16 – Bloomberg (Chang Shu and David Qu): “China’s December supply of credit was steady, taking into account a boost from a widening in the data coverage. The headline figure now includes all government bonds, broadened from the previous definition of special government bonds. New loans and other categories of aggregate social financing were broadly stable — boding well for economic growth support. The monthly increase in aggregate social financing was 2.1 trillion yuan, up slightly from 1.9 trillion yuan in December 2018 on a comparable basis.”
The People’s Bank of China (PBOC) has, once again, revised its tabulation of system Credit, now to include China’s “Treasury” and local government bonds. With the new components, Aggregate Financing expanded $307 billion in December, up from November’s $291 billion and 9% ahead of December 2018 (and up 10.7% y-o-y). For the year, Aggregate Financing surged a historic $3.728 TN, 13.7% ahead of growth from 2018.
By the main categories, Bank (“yuan-denominated”) Loans expanded 12.5% for the year. Booming capital markets continue to provide a stiff tailwind powering huge bond issuance. Corporate Bonds expanded 13.4% in 2019, with Government Bond growth at 14.3% and Asset-Backed Securities surging 31.5%. The contraction of key “shadow banking” categories runs unabated, with Entrusted Loans down 7.6%, Foreign Currency Loans contracting 4.6%, Undiscounted Bankers Acceptances sinking 12.5% and Trust Loans declining 4.4%.
New Bank Loans expanded $166 billion during December, down from November’s $202 billion but 5% ahead of December 2018. For the year, Loans expanded $2.451 TN – about 4% ahead of 2018. Consumer (chiefly mortgage) Loans continue to power ahead. At $95 billion, Consumer Loans were down slightly from November’s $100 expansion but were 40% ahead of December 2018 growth. For the year, Consumer Loans expanded $1.084 TN, or 15.5% – slightly ahead of 2018’s annual expansion. Consumer Loans surged 37% over two years, 66% over three and 139% over five years.
It’s worth noting China’s M2 money supply growth accelerated to 8.7% y-o-y in December, much higher than Bloomberg’s consensus estimate of 8.3%. December saw the largest monthly expansion since January, with y-o-y M2 growth the strongest since February 2018’s 8.8%. With Credit booming, China’s economic resilience is no surprise. Ominously, economic growth has slowed markedly in the face of ongoing excess of increasingly unsound money and Credit.
Here at home, further indications of a housing market poised for a big year:
January 17 – Bloomberg (Ana Monteiro): “Groundbreakings on new U.S. homes surged in December to a 13-year high, giving the housing market momentum heading into the new year amid low mortgage rates, solid job growth and optimistic buyers and builders. Residential starts rose 16.9% to a 1.61 million annualized rate after an upwardly revised 1.375 million pace in the prior month… The gain was the biggest in three years and well above all estimates…”
January 16 – CNBC (Diana Olick): “The nation’s single-family homebuilders are feeling very confident about their business in the new year, as high demand and low supply make for a profitable mix. Yet, sentiment in January did slip 1 point on the National Association of Home Builders/ Wells Fargo Housing Market Index to 75, but that is considerably higher than last January, when it was 58. Last month’s reading was a 20-year high.”
January 15 – CNBC (Diana Olick): “It was a seriously strong start to 2020 in the mortgage business for new home loans and refinances. Total mortgage application volume surged 30.2% last week from the previous week… Refinancing led the surge, thanks to a drop in mortgage rates. Those applications jumped 43% for the week and were 109% higher than a year ago… Homebuyers also rushed in, sending purchase application volume up 16% for the week and up 8% from one year ago. Purchase mortgage activity hit the highest level since October 2009.”
And with stocks at record highs and housing markets bubbling, no surprise that the U.S. consumer is both confident and spending.
January 16 – Bloomberg (Max Reyes): “U.S. consumer confidence advanced last week to the highest level in more than 19 years on increased optimism about the economy, personal finances and the buying climate. Bloomberg’s index of consumer comfort rose to 66 in the week ended Jan. 12, the best reading since October 2000, from 65.1… The gain was the eighth in the last nine weeks. A measure of Americans’ views of the economy climbed to the highest since early 2001.”
For the Week:
The S&P500 jumped 2.0% (up 3.1% y-t-d), and the Dow rose 1.8% (up 2.8%). The Utilities surged 3.7% (up 3.4%). The Banks slipped 0.2% (down 2.2%), while the Broker/Dealers jumped 2.5% (up 4.0%). The Transports rose 2.8% (up 3.5%). The S&P 400 Midcaps gained 2.2% (up 1.6%), and the small cap Russell 2000 surged 2.5% (up 1.9%). The Nasdaq100 advanced 2.3% (up 5.0%). The Semiconductors rose 2.7% (up 3.6%). The Biotechs declined 0.5% (up 2.2%). With bullion slipping $5, the HUI gold index fell 1.0% (down 5.4%).
Three-month Treasury bill rates ended the week at 1.5225%. Two-year government yields slipped a basis point to 1.56% (down 1bp y-t-d). Five-year T-note yields declined one basis point to 1.62% (down 7bps). Ten-year Treasury yields were unchanged at 1.82% (down 10bps). Long bond yields were unchanged at 2.28% (down 11bps). Benchmark Fannie Mae MBS yields were little changed at 2.62% (down 9bps).
Greek 10-year yields rose six bps to 1.41% (down 2bps y-t-d). Ten-year Portuguese yields jumped 11 bps to 0.50% (up 6bps). Italian 10-year yields rose five bps to 1.38% (down 4bps). Spain’s 10-year yields increased two bps to 0.46% (down 1bp). German bund yields dipped two bps to negative 0.22% (down 3bps). French yields were unchanged at 0.04% (down 7bps). The French to German 10-year bond spread widened two to 26 bps. U.K. 10-year gilt yields sank 14 bps to 0.63% (down 19bps). U.K.’s FTSE equities index rose 1.1% (up 1.8%).
Japan’s Nikkei Equities Index gained 0.8% (up 1.6% y-t-d). Japanese 10-year “JGB” yields were little changed at zero (up 1bp y-t-d). France’s CAC40 rose 1.1% (up 2.1%). The German DAX equities index added 0.3% (up 2.1%). Spain’s IBEX 35 equities index gained 1.1% (up 1.4%). Italy’s FTSE MIB index increased 0.5% (up 2.7%). EM equities were mostly higher. Brazil’s Bovespa index jumped 2.6% (up 2.4%), and Mexico’s Bolsa rose 2.6% (up 5.2%). South Korea’s Kospi index advanced 2.0% (up 2.4%). India’s Sensex equities index gained 0.8% (up 1.7%). China’s Shanghai Exchange declined 0.5% (up 0.8%). Turkey’s Borsa Istanbul National 100 index jumped 2.4% (up 6.2%). Russia’s MICEX equities index rose 2.3% (up 5.0%).
Investment-grade bond funds saw inflows of $6.624 billion, and junk bond funds posted inflows of $1.730 billion (from Lipper).
Freddie Mac 30-year fixed mortgage rates added a basis point to 3.65% (down 80bps y-o-y). Fifteen-year rates increased two bps to 3.09% (down 79bps). Five-year hybrid ARM rates jumped nine bps to 3.39% (down 48bps). Bankrate’s survey of jumbo mortgage borrowing costs had 30-year fixed rates up four bps to 3.99% (down 47bps).
Federal Reserve Credit last week expanded $4.4bn to $4.133 TN, with an 18-week gain of $406 billion. Over the past year, Fed Credit expanded $117bn, or 2.9%. Fed Credit inflated $1.322 Trillion, or 47%, over the past 375 weeks. Elsewhere, Fed holdings for foreign owners of Treasury, Agency Debt jumped $11.9 billion last week to $3.420 TN. “Custody holdings” increased $16.5 billion, or 0.5%, y-o-y.
M2 (narrow) “money” supply increased $1.9bn last week to a record $15.432 TN. “Narrow money” surged $1.022 TN, or 7.1%, over the past year. For the week, Currency increased $4.1bn. Total Checkable Deposits fell $37.0bn, while Savings Deposits jumped $32.1bn. Small Time Deposits increased $0.6bn. Retail Money Funds gained $2.0bn.
Total money market fund assets fell $7.2bn to $3.630 TN, with institutional money fund assets down $6.6bn to $2.251 TN. Total money funds gained $581bn y-o-y, or 19.1%.
Total Commercial Paper declined $4.6bn to $1.121 TN. CP was up $55.7bn, or 5.2% year-over-year.
http://creditbubblebulletin.blogspot.com/2020/01/weekly-commentary-this-is-insane.html
when you read this article https://www.themacrotourist.com/why-we-have-been-screaming written by macro tourist you will realise the similarities between Indian and US equity markets.
Both have seen the lethal force of Monetary and Fiscal expansion simultaneously
He writes
When you combine those monetary developments with the most accommodative fiscal stance in a decade, it is little wonder the stock market is screaming higher.
Now don’t misconstrue this to mean I am bullish on stocks and recommend you chase them up here. The froth is so thick, I am scared we could get a 10% swoosh lower in the index at the slightest tick of bad news. But I wanted to explain that the shift in policy at the Federal Reserve policy, along with the fiscal taps being wide open is a combustible environment for risk assets.
This is my view will end only when either the Bond Market revolts or Currency takes a knock driving up the inflation
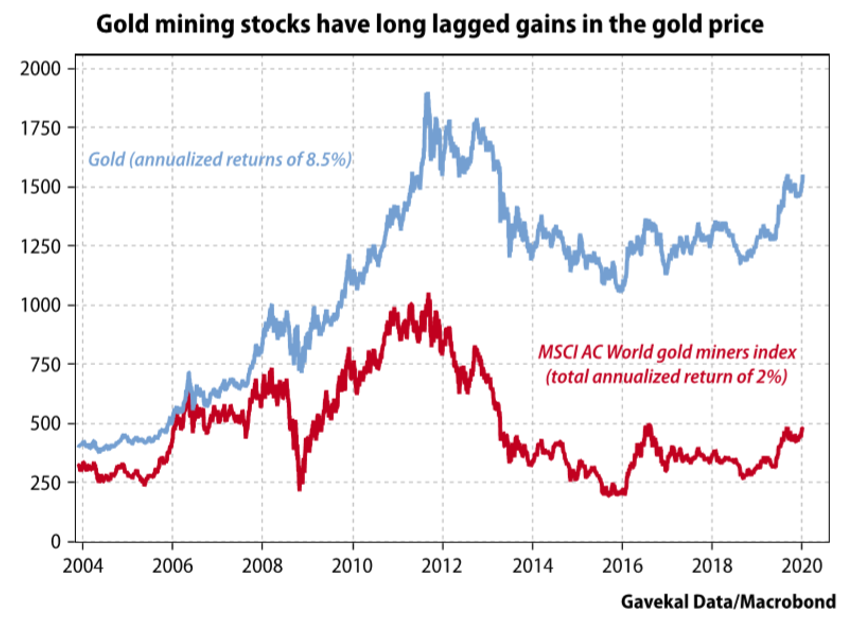
‘The Philadelphia Stock Exchange gold and silver index stands at the same level today it did at the start of 1984 (that’s three and half decades of treading water). But recent mergers are a textbook sign of a bottom in the cycle.’ https://blog.evergreengavekal.com/gold-beyond-the-iran-crisis/…
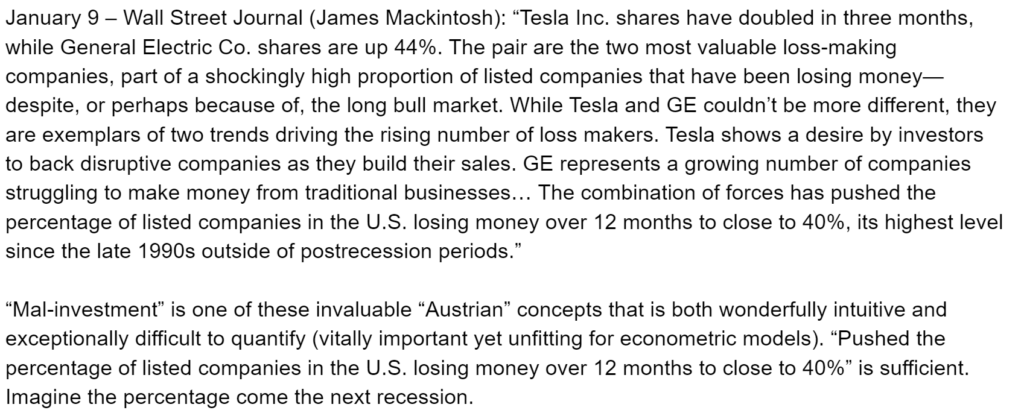
Wall Street Journal
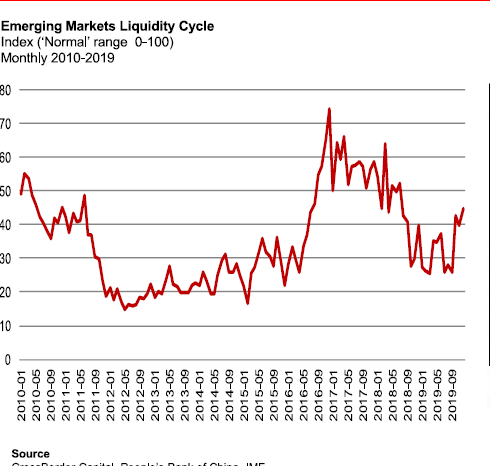
Emerging Market Liquidity: Shanghai Accord 2?
•EMIL™ moves up to index reading of 44.7•EM left behind by easing in US and Eu •Latest evidence points to easier Chinese money. May be Shanghai Accord 2? •World economy and commodity prices will get boost in 2020
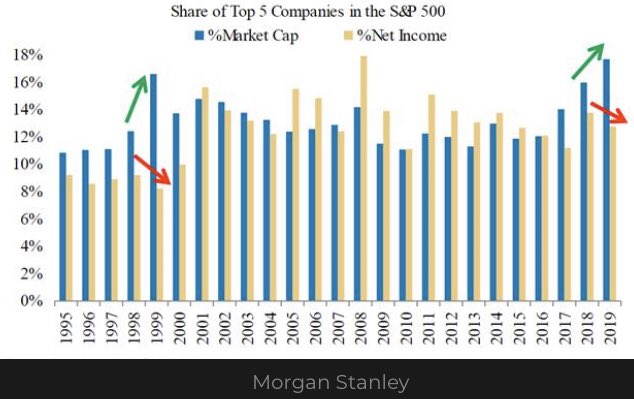
Concentration not seen in long time
Prof Scott Galloway writes..
Sometimes it’s darkest before it’s … pitch black.
Things are going from bad to worse at SoftBank. Since January 2019, Vision Fund firms have laid off over 10,700employees — more than 2x the workforce of Twitter. And last year will soon be the good old days.
August turned into the mother of all summer bummers for the Vision Fund (let’s stop putting numbers on it, as this is the first and last fund from SoftBank). SoftBank was likely hoping Oyo’s growth would be the antibiotic to what ails the current portfolio. However, Oyo is about to become a heat shield for We as it turns into the new problem child — not smoking pot behind the gym, but crashing dad’s car into a Chick-fil-A.
read full post below
https://www.profgalloway.com/oyomfg?utm_source=newsletter&utm_medium=email&utm_campaign=NMNM20200110