Eric Mandelblatt is the founder and CIO of Soroban Capital. We cover how the global push towards decarbonization could have massive impacts on the industrial economy, the supply and demand forces at work in commodities production, and why energy and materials represent such a small share of the market today
excerpt of the interview
The world has determined that the two big methods for decarbonizing are wind and solar generation, and electric vehicles. Now, there’s other paths that we can go down, but I’d say the big two today, the big two tools for decarbonizing the world, are really change out the power generation mix and lean heavier on wind and solar, and then let’s ramp electric vehicle penetration from the current 5%.
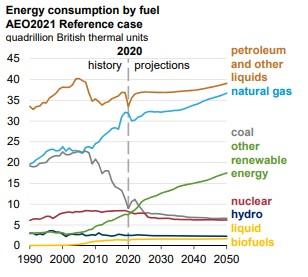
On the wind and solar side, what I think investors are misunderstanding, misinterpreting, is the ramp capacity in wind and solar. And the starting point. The stat we like to use around here is the world is consuming 40 times more fossil fuels than they are consuming wind and solar generation. So if I take all the fuel sources in the world and I throw them into a pie, 82% of that pie is fossil fuels today. That’s coal, that’s gas, and that’s oil. 2% of that pie is wind and solar. Now the remainder is largely hydro and nuclear. We’re not really adding capacity in a big way today.
Today’s story is about patience. Whether you are trading or investing, 2022 will require more calm thoughtfulness than any year in recent memory. History shows that as crises fade into the rearview mirror, market volatility (and the opportunities it brings) declines. Also, there is a real tug of war now between fundamentals and Fed policy. Lastly, the best places to make money in stocks (cyclicals, in our view) are volatile and rarely well-structured industries or companies. Bottom line: 2022 is a “measure twice, cut one” sort of year.
* * *
Strange as it may sound, I learned most of what I know today on this topic while working for Steve Cohen at the old SAC Capital. Yes, it was a (very) fast money trading shop. And yes, Steve’s trading process demanded absolute adherence to a specific set of rules and mindset. Price action, not opinion or emotion, defined right and wrong.
But SAC is also where I learned the old trader’s saying, “Sit tight, be right”. If your process is sound, from idea generation to risk management and exit discipline, then patience determines profitability. Simply put, big trades often take time to work.
Everyone at SAC had their own approach to cultivating patience, which in the context of the firm’s trading bent often meant simply distracting themselves rather than staring at their daily P&L. Steve might invite his family to lunch and actually take an hour off the desk with them if he was worried about being shaken out of a large position intraday. Other traders occupied their time by planning where to go for lunch or dinner (traders think about food a lot). As for me, I would spend hours on a forward calendar of catalysts that might offer new trading ideas (analysts think about data a lot).
Many years after leaving SAC, a hedge fund performance analytics firm showed me some research that put the importance of patience into even starker relief. Hedge funds, as a whole, are good at finding winning ideas. Their performance would often be better, however, if they held those ideas longer. Academic work on institutional investor (long only and hedge funds) behavior shows that the problem is structural. So much of money management marketing is pitching new ideas to gather assets that “old ideas” (those currently in the portfolio) get crowded out too early in order to take stakes in new names.
I bring all this up because 2022 feels very much like a year where patience will be the defining factor when it comes to outperformance. Whether you are bullish or bearish on a market, sector, investment theme or individual idea, it will take longer to get paid for your point of view than the last several years.
Three reasons I think that’s true:
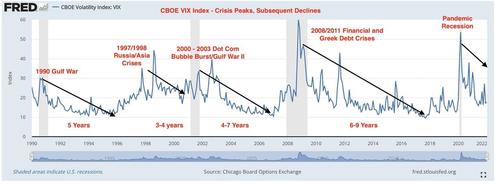
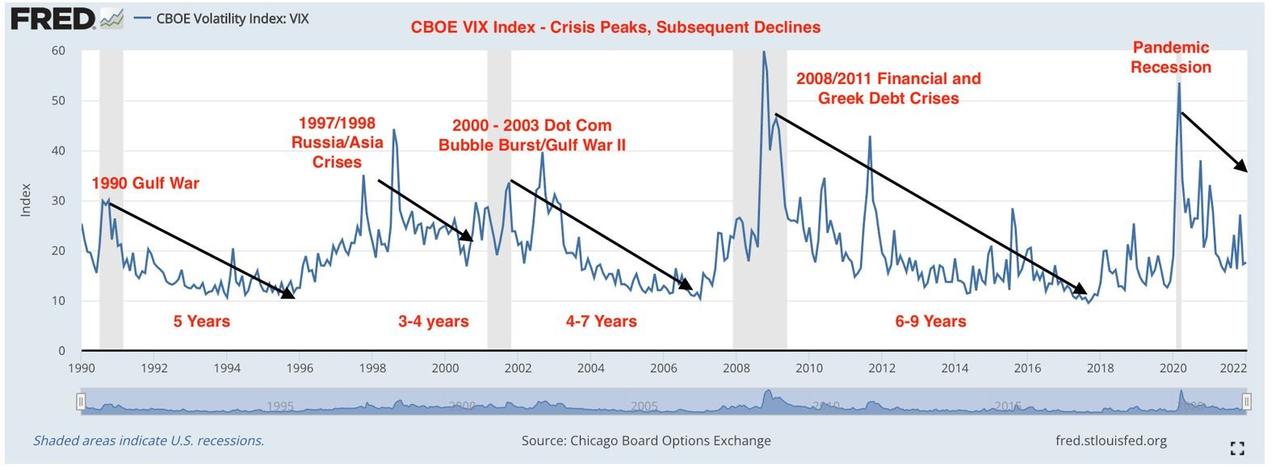
1: US equity market volatility historically declines in the years after a shock. The chart below shows the CBOE VIX Index back to 1990. As highlighted, there have been 4 notable VIX spikes since then. In each case volatility declined for several (3-9) years thereafter. In March 2022 we will be 2 full years into the post-pandemic market recovery. Volatility has already been declining. The VIX today is only 20, for example, even with the selloff and January’s choppy action.
2: There are times when fundamentals (i.e., corporate earnings) matter and then there are times when changes in macro conditions matter more.
At the bottom in March 2020, macro mattered; fiscal and monetary policy supported the US economy during the Pandemic Crisis.
From Q2 2020 to Q4 2021, US corporate earnings took over the market narrative. The S&P 500 earned 23 percent more in 2021 than it had pre-pandemic. Wall Street analysts were slow to acknowledge that fact, which allowed for a long series of earnings beats.
We are now entering a period where the Federal Reserve will engage in a never-before-seen experiment: raising interest rates off zero and reducing the size of its balance sheet in the same year.
All this sets up 2022 as a tug of war between the relative certainty of strong corporate earnings and the absolute unknown effect of novel Fed policy. As we outlined earlier this week, the setup here reminds us a lot of 1994. Back then, the Fed embarked on a surprise series of aggressive rate hikes and investors simply had no idea what that would do to the US economy. Now, Fed communication may be better – they have telegraphed liftoff and runoff quite clearly – but the market is still left wondering what results will come from their decisions.
3: The sectors that have been working – and we still like – are not what one would call easy stories to love. Large cap Financials (+6 pct YTD) are cheap but face structural challenges from venture capital funded FinTech disruptors. Large cap Energy (+14 pct YTD) is an ESG nightmare, and you have to believe (as we do) that traditional carbon-based energy has several years of new demand highs ahead of it. Airlines (+7 pct YTD), which Jessica just highlighted earlier this week, are no one’s idea of a stable or well-structured industry.
As much as we like cyclical sectors, we know there will be sudden and violent rotations out of them through 2022. They have a tailwind but owning them in 2022 is not the same as holding Big Tech in 2020 – 2021. If nothing else, their competitive positions are not as strong. In trading parlance, you are “renting” these names rather than buying a forever home for capital.
Summing up: 2022 is set to bring us lower average US equity volatility, a see-saw dynamic between fundamentals and Fed policy, and rotation into cyclical (and often volatile) sectors with little to offer besides earnings leverage. It will be a year for patience and, just importantly, discipline. Sit tight, be right.
Larry McDonald, creator of «The Bear Traps Report» and New York Times best-selling author, expects a colossal shift from growth to value stocks in the face of elevated inflation. He also explains why he believes gold and emerging markets have big upside potential.
In an in-depth interview with The Market/NZZ, which has been edited and condensed for clarity, the creator of the «Bear Traps Report» discusses where he spots the best opportunities for investors against this backdrop. He also explains why he believes emerging markets like China have great upside potential and how he bets on the upcoming U.S. midterm elections.
Mr. McDonald, when it comes to the market outlook for the coming year, everything revolves around inflation. What are your thoughts on this issue?
Everybody knows that inflation is going to come down. On a year-over-year basis, these high levels of price increases are just not sustainable. But here’s the problem: If inflation normalizes at 2.5% to 3.5%, or maybe 4%, a lot of money is in the wrong place.
What do you mean by that?
There is a ton of money in growth stocks like Tesla and Nvidia, and what’s happened is that the tertiary parts in this segment have already given away, particularly cloud-software stocks and stocks that are owned by the ARK ETFs. Those stocks are all big deflation bets. But if you have sustained inflation the net present value of future cash flows is worth a lot less for growth stocks, and that’s why they are underperforming. Teladoc for instance, a remote healthcare provider, is down 70% off the highs. Yet, it’s still trading at 14x sales. So if inflation normalizes at a higher trajectory, it’s going to force trillions of dollars out of growth stocks into value stocks.
What does this imply for investors?
The trade for 2022 is going to be an epic rotation into value stocks. That means money managers like Warren Buffett or David Einhorn at Greenlight Capital are going to do really well. In this context, some of our best ideas for next year are names like AT&T and Intel. We also like Alibaba a lot where there is tremendous value. Right now, based on market capitalization, you can fit 9 Alibabas into Apple, whereas this ratio was about 1.5 to just under 2 over the past five years.
Chinese internet stocks such as Alibaba, JD.com and Baidu, which are also listed in New York, have suffered serious losses this year. What makes you so optimistic for 2022?
In years like this, when the S&P 500 is up 15% to 20% or more, the emphasis on tax-loss selling is exponentially higher. It’s a strategy where you dump stocks that have performed poorly in order to reduce capital gains taxes, as the year draws to a close. This year, a lot of investors have index gains and need losses, causing heavy selling pressure on certain names. Now here’s the thing: Historically, the sectors that experienced heavy tax-loss selling typically do very well in the first half of the following year. In our view, we are now past the tax-loss selling season, which gives beaten-down names a very high ceiling lookout. That’s one of the reasons we’re extremely bullish on Alibaba, the China internet ETF KWEB and the China large-cap ETF FXI.
The slump in the Chinese tech sector has a lot to do with regulatory interventions. How do you deal with the political risk?
In China, the credit impulse has been coming down for at least seven months. But going forward, you got the Olympics coming up in February and the party congress later in the year. Taking this into account, we think that president Xi wanted to engineer some event this past year to take out a lot of the bad actors in China’s economy to address excess leverage in real estate developers like Evergrande and fraudulent behavior in other areas like education firms. Basically, he wanted to do a cleanse for everyone to see by punishing tech stocks and highly leveraged entities. But now, heading towards the Olympics and the party congress where president Xi is pressing for a lifetime mandate extension, the last thing in the world China wants is some kind of Lehman situation.
As a former senior trader at Lehman Brothers, you experienced the collapse of the U.S. banking sector firsthand in the fall of 2008. How big is the risk today in China’s financial system?
Here’s what’s interesting: This fall, when Evergrande was collapsing under its enormous debt, China’s currency was very strong, the volatility of the Yuan was really low. Same thing with credit default swaps on the big banks in the Asian region like ANZ Bank, Standard Chartered and HSBC. In periods where there is real stress in China, as in 2015 with the devaluation in the Yuan, CDS on Western banks near China have been a highly reliable leading indicator, a canary in the coalmine type. In the face of this year’s incredible deleveraging process, it’s shocking how tame the volatility in the Yuan has been. China’s currency has been strengthening, and it’s remarkable how there really hasn’t been any credit contagion the way there was in 2015. And now, with the Olympics and the party congress coming up, the probability of a fiscal impulse is extremely high.
So you’re betting on new stimulus for China’s economy?
Remember, we had back-to-back capitulations in Chinese equities over the past year: China had a pretty nasty Covid outburst in Q3 and then they had this kind of regulatory punishment period and the deleveraging. What’s more, there is a lot of uncertainty regarding the threat of delisting Chinese companies in the United States. But we think that’s overblown, at least for now. The delisting risk makes a lot of noise, but it’s really two to three years away. So from our capitulation model’s point of view, these stocks are a screaming buy.
How exactly does this model work?
It’s a seven-factor model where we look for things like the distance of the share price below the lower Bollinger band or the amount of shares traded in the most recent weeks vs the last six months, the last year and the last five years. In the case of ETFs, we’re also looking at the discount to net asset value, and with equities at price-to-earnings and price-to-sales ratios. In essence, the model mathematically tries to calculate seller exhaustion. A textbook example was the historic capitulation in the energy sector in 2020. First, it was driven by Covid, and then by the Democrats basically promising that they were going to wipe out the oil and gas industry when they took control of the White House and Congress. As a result, you had two events that shook investors out of energy stocks, and the capitulation score was the highest ever.
Accordingly, you favored oil and gas companies in our interview at the time. How do you view the prospects for energy stocks today?
We’ve trimmed our energy position by 30%, but we’re still bullish. For instance, I’m looking at Buffett and he basically bought one stock in the third quarter: Chevron. I’m with him, and I love Chevron here. It’s a cheap stock with a great dividend. Besides Chevron, we have the energy ETF XLE and BP in our core holdings. Next year, it’s going to be really busy because the social response to Covid will be so powerful. It was already powerful this year, but if you listen to the American Express earnings call, global business travel is still 40% off the highs. This coming summer, I expect a big revival in business and leisure travel, and that’s going to be very bullish for energy because we just don’t have enough oil relative to global growth.
Where else do opportunities open up?
We also love Brazil. Think about what Brazilian banks have been through: In 2016, you had a huge inflation scare in Brazil and a commodity bust pushing the country into a horrible recession. On top of that, Dilma Rousseff, Brazil’s president, was removed from office. Hence, the period of 2016 to 2018 was a horrific event where Brazilian stocks were destroyed. And then, Brazil got hit hard by Covid. So if you’re a Brazilian bank and you’re still standing, you’ve just survived two colossal historic shocks. As a result, from an upside/downside perspective you have tremendous value. The EWZ ETF which tracks an index of companies in Brazil is another case where you have a very decent capitulation score. And here’s the most important part: Emerging market stocks – just like gold – do incredibly well when you have a shortened hiking cycle in the U.S., or if the Fed gets knocked into pausing a hiking cycle.
Why do you think that will be the case? The Federal Reserve signaled just a few weeks ago that it intends to raise benchmark interest rates three times next year.
Let’s take a quick look back: In the post-Lehman era, the Fed hiked rates nine times. And, if you add in quantitative tightening – the rundown of the Fed’s balance sheet – they actually hiked rates 15 times between December 2015 and 2018. That’s because quantitative tightening has a very similar power as rate hikes. In addition to that, we had the taper period in 2014. So actually, the tightening cycle was 2014 to 2018. Put differently: We had a five-year tightening cycle, and typically emerging market stocks and gold do very poorly through a long-embedded hiking cycle.
What does this mean for the current cycle?
The market is starting to act funny. People are starting to sell the rallies instead of buying the dips. What’s happening is the beast in the market is looking at all this monetary tightening and a fiscal cliff. Over the last two years, investors had three safety blankets: One them was monetary accommodation. The second one was a huge fiscal tailwind: In the U.S, we had $6 trillion of deficit spending in 2020 and 2021. And thirdly, the vaccines were coming on the scene giving people a lot of hope. But now, the beast in the market is looking at $3 trillion of fiscal and monetary withdrawal, and on top of that, there is uncertainty around the effectiveness of vaccines. This is setting up for a real problem because inflation plus the fiscal and monetary withdrawal equals a tremendous amount of tightening.
Fed Chairman Powell, however, continues to say that the U.S. economy is on a robust growth path.
It’s pretty obvious: Eurodollar futures and the long end of the yield curve are telling you: «No way on God’s green earth will this hiking cycle go on for five years and 15 hikes.» I think inflation already hiked rates for the Fed by around 150 basis points because of demand destruction. For regular families spending money on Christmas presents and food for the holidays, the costs have just doubled. It’s also everything that goes into oil and chemicals. So the consumer is really wounded. For instance, if you look at University of Michigan data, the Fed has never ever kicked off a hiking cycle with consumer confidence as low as it is now. Bottom line: This shortened hiking cycle is going to be a home run for gold and stocks in emerging markets like China and Brazil. That’s the big trade for 2022.
Source: «The Bear Traps Report»
However, there is already speculation on Wall Street that the Fed will not only tighten interest rates soon, but could also start reducing its balance sheet towards the end of 2022.
This is like tapering on steroids: You can’t accelerate the taper, promise three rate hikes and a possible quantitative tightening without destroying growth stocks. We think the Nasdaq 100 will see a brutal correction until the Fed backs away by summer. In this environment, the safety net for investors is that value stocks are going to outperform. That’s why we love names like Intel. It’s one of our top ideas in our tax-loss basket for next year. Personally, I’m short the semiconductor sector ETF SMH and long Intel. If you look at the outperformance of the semiconductor sector vs Intel, it’s mathematically unsustainable. It’s off the charts by two to three standard deviations outside the norm. And with Intel, you have a dividend of 2.5% to 3% which means double the yield compared to ten-year Treasuries. Another interesting part is that Seth Klarman and Dan Loeb – two hall of fame investors – own the stock.
Why do you think the Fed will back down? And what does that mean in terms of rate hikes?
They will probably hike once next year. Central bankers are very bright people, but they are academics who never have managed risk. So they put forth these altruistic, pollyannaish policy proposals. Look at the amount of debt on the planet. It’s bad, and everybody understands that, but the real problem is not just more debt. What’s important is that there’s $30 trillion of debt that yields less than 2%. So when interest rates move up, bond prices move down, and you have a lot more downside on a 2% bond than on a 4% bond.
Speaking of debt: What’s in store for the markets in 2022 in terms of U.S. fiscal policy? President Biden’s Build Back Better stimulus program recently suffered a major setback.
That was a call where I was wrong. But we did get the infrastructure bill, and we got the American Rescue Act in March. So President Biden did pass two meaningful pieces of legislation. He couldn’t pass Build Back Better, and right now the market believes there’s nothing coming. But I do think that this new Covid wave increases the probability of more stimulus. It won’t be called Build Back Better, but if there is enough downside in the market and enough stress in the system, we will get a capitulation from the Fed where they will alter the rate hike schedule and we will get a capitulation from Washington around more fiscal spending. That’s the big call for next year: By mid-July, we probably will have a fiscal and monetary capitulation.
“Throughout history, rich and poor countries alike have been lending, borrowing, crashing―and recovering―their way through an extraordinary range of financial crises. Each time, the experts have chimed, ‘this time is different’, claiming that the old rules of valuation no longer apply and that the new situation bears little similarity to past disasters.” Carmen Reinhart & Kenneth Rogoff: This Time is Different
The 2011 Reinhart and Rogoff book This Time is Different is a valiant effort by two academics to identify what preconditions, especially in terms of the levels of accumulated national and external debt relative to GDP, would set a nation on the road to an inevitable crisis. The exhaustive research in the book drew on data from 66 countries across five continents. The implication was that in 2011, major developed markets were well on their way to a new crisis as the policy response to the global financial crisis saw the massive build-up of additional and “unsustainable” debt. But since the publication of the book, the advent of multiple rounds of QE have at least severely delayed, if not disproved, their entire thesis.
But the size and nature of the pandemic policy response will show that this time, inflation outcomes really will be very different from anything we have experienced in decades, even as the overall Reinhart and Rogoff point that debt build-ups always lead to serious trouble will eventually prove correct. That’s because at such high debt levels, monetary policy no longer gets traction now that we are at the effective zero bound for rates. To avert an immediate crisis, the pandemic response brought fiscal stimulus on the scale of war mobilisation, supporting basic incomes and MMT-like direct transfers to nearly every sector of the economy. It was a massive demand stimulus at a time when the economy was shutting down the supply side to deal with the virus. And even as we open up from the pandemic, the new fiscal dominance will continue as we face three generational challenges simultaneously: inequality, infrastructure, and climate change policy, or the green transformation.
The economic results of this new focus will be: ever-bigger government, more intrusive regulations, supply chain disruptions, inflation, no price discovery, a general hard swing to the left in the western world and―not least―the increased “channelling of capital” into small pockets of investable resources and assets. This could be the 1970s all over again, except this time it’s all about the political imperative of the decarbonisation of the economy, whatever that means for real growth.
Decarbonisation is needed, absolutely, but the current palette of technologies doesn’t fit the bill, as solar and wind scale poorly because of intermittency. Even worse is the too-readily accepted shift to lithium-ion battery powered electric vehicles. The wind turbines in Europe are being forced to stop when the wind is strong as the grid network is unsuited for peak input. And even if some energy storage option was available, there may not be enough of the key industrial metals to achieve this.
In short, our basic problem is that the physical world is too small for the aspiration and visions of our politicians and environmental movements. The more we decarbonise under the present model the more we metallise the economy. The marginal demand output change on metals under the assumption of 30% of the car fleet being electric in 2030 is 10-20x of current levels. The supply chains, meanwhile, are inelastic due to a lack of support for permitting, board approval, and lack of capital flowing into the “dirty” production side of the equation due to ESG priorities.
The “new black” in investing is ESG, in particular the E (environment), which is everything that touches the green transformation. Money continues to flow into ESG priorities and companies are in a rush to get with the program as a key driver of business and accessing capital. That’s excellent news, except for the fact that the ESG landscape is at best not very well defined, not rule based and often arbitrary. This will not however change what is my chief message to customers and policymakers:
ESG is the biggest political project ever.
The ESG push and related green transformation effort have so much political capital behind them that failure is simply not an option. The best analogy to me is the euro. I happened to be a student under Professor Niels Thygesen when he was authoring the Delors Committee report in 1988/89, preceding the introduction of the euro and outlining the path to Economic and Monetary Union. We all knew the EMU/euro was born without a proper foundation (fiscal union), that no currency union has survived the test of time and that the stronger nations would “dilute” the weaker ones. Despite this we all underestimated the political capital invested. As with the green agenda and ESG, it had to be a success. The doubt disappeared during a speech by ECB president Mario Draghi at the Global Investment Conference in London on July 26, 2012, during one of the worst phases of the EU sovereign debt crisis, when he said, “Within our mandate, the ECB is ready to do whatever it takes to preserve the euro. And believe me, it will be enough”.
I compare the present agenda/driver to that same political ideology. The ESG and green agenda will prevail, if only because it will have unprecedented political will and capital behind it. ESG will be 50 trillion USD business in 2030 according to Bloomberg Intelligence by 2025. (For comparison the US GDP is 23 trillion USD per year)
It is the biggest “whatever it takes” commitment and it’s global too, with China joining with their 2050 decarbonisation plan.
The ESG and green transformation is simply the single largest policy bet ever undertaken, and the main consequences will be inflation and ever lower real rates. Inflation in this case will be a function of the physical world not able to deliver the supply relative to the quantity of money and demand, and negative real rates tell us the future is one of low real growth through low productivity growth.
We investors need to embrace, understand and act on this. There are two major assets classes that will do well under this regime: Government-sanctioned assets, and assets with price discovery. This means green and, ironically, commodities have the best odds of producing long-term excess returns.
This does not mean the projection from here will go from one success directly to the next. Au-contraire: the present model of negative real rates as a funding source for unproductive changes to society will lead to some sort of breakdown. This will however only lead to ever more funds and subsidies for the same failed transition. Eventually, we have to hope, new energy sources will come to the rescue (fusion energy?) with vastly superior outputs per invested unit of energy and per invested dollar. For now though, money talks.
In conclusion, negative real rates are a function of our economic model not being productive into the future. The more we continue to pursue a sub-optimal model for our otherwise noble objective of a cleaner, better and more just future, the lower real rates will go, and the more unequal society will be, blocking the path to a real vision for the future.
A vision needs to be built on productive societies pushed forward by better education, basic research as a central part of fiscal spending, and rules-based international cooperation that gave us a vaccine against Covid, genome mapping, the internet and so much more. The sad thing is that we have never been further away for this “turn for the good”.
So again, this time is different as a new inflationary era is upon us―one unlike any of us under the age of at least 60 can remember. But what is not different is that this is the last phase of the process started under Greenspan in 1998 where policymakers interfere ever more deeply into the economy. First it was central bankers bailing out the system, now it is governments trying to force outcomes regardless of their productivity. This has brought zero policy rates and now heavily negative real rates. We need to realise that negative real rates are a doom loop and that we won’t really move toward that bright future we all want to build until real rates move up and turn positive.
To a man with a hammer, every problem looks like a nail. To the Federal Reserve, every problem is met with more liquidity. Unfortunately, the Fed has very little control of where this liquidity goes. First, it went into equity markets, fueling an outright equity bubble. Then it overflowed into PE and VC, creating bubblicious demons there as well. Then it overflowed into meme stonks and shit-coins. Not content with the damage they wrought on the financial economy, the liquidity began overflowing into the real economy. There’s currently an epic housing bubble, leading to increasing wealth inequality and polarization.
Now, this liquidity is overflowing into the everyday economy—assuming you can even find the item you seek. In the past, only hard money weirdos complained about the gradual creep of inflation—now everyone feels it and has their own story. Everyone is painfully aware that inflation is present and is likely to stay.
Coincidentally, this is all happening at a time when the government is actively destroying the normal supply response to higher pricing. You want more labor? Nope, there’s stimmies. You want to keep your existing employees? Nope, anyone un-vaxed must quit. You want to add a facility? Nope, permits take years. You want to finance growth? Nope, they only finance ESG projects. The free market is an interplay of supply and demand. If you restrict supply and stimulate demand, eventually pricing responds.
For the past few months, I’ve been joking that the Fed will keep going until something breaks. Of course, in the Fed’s jaded minds, they’re worrying about the left tail (downside equity risk) and they’re continuing to flood the market with liquidity. What if the Fed is now the cause of the left tail risk? What if the right tail (parabolic upside commodity action) caused by this liquidity is what actually breaks the market? What if the Fed has finally added too much liquidity? Maybe the levee is going to break.
Back in June, I wrote about how ESG = Energy Stops Growing. It’s already starting to play out. Look at what European electricity prices are doing. Now assume this happens to gasoline and diesel. Consider what happens if it is a cold winter. Could natural gas go crazy? Propane. Ethane. Heating Oil. They’re all waking up. These are the feedstocks for everything in our lives. The whole periodic table is going mental. There’s even food inflation—the sort of inflation that gets very political. The inflation is everywhere that the government gets in the way of supply while increasing demand.
After decades of irrelevance, inflation is about to matter again. Energy is the big dog, but wage growth is also here to stay—it will impact margins and eventually get imputed into earnings multiples. There will be plenty of other areas with inflation as the government continues to meddle in the supply response. Equity multiples do not do well when inflation roars, particularly if the starting point is as extremely overvalued as it is today.
I’m the “Project Zimbabwe” guy, but I also believe in Kevin Muir’s “Rolling Bubbles.” The history of financial markets is that once a bubble peaks, it rarely reflates. Could the bubble in duration assets (like high-multiple tech and Ponzi) finally be over? Could the bubble in inflation assets just be starting? Could the unwind of both historic extremes be unusually violent, as so much of the world’s capital is leaning the wrong direction? I know where I have my bets. I expect inflation assets to surprise to the upside, even as the bubble in duration bursts. I expect energy to be the proximate cause. Watch it closely. Demand is still recovering from Covid, yet energy prices are already at multi-year highs. There are air pockets where supply doesn’t exist at any price. These are the warning signs. Something wild is brewing.
My friends atCapitalist Exploitshad this chart in their most recent weekly (if you’re not a subscriber, I highly recommend it). Look’s overdue to mean revert.
This isn’t a call to get out of the markets tomorrow. This certainly isn’t a call to short anything. Rather, this is a call to re-evaluate your book. There’s a massive rotation underfoot here. As it gathers speed—I think it will surprise people.
A month ago, I reminded everyone that the Fed is a political animal. If inflation becomes a political issue, the Fed will be forced to act. Is anyone prepared for that? What if they cannot fix the inflation? What if the politicians demand that they get aggressive as inflation overshoots? Will the Fed be forced into more extreme actions? This is the scenario that no one is contemplating—what if we should all be thinking about it??
Watch energy. It’s the lynchpin of everything else inflation related. As that roars, I expect duration to get mauled…
It is not very surprising to me that nearly every talking head on Wall Street is convinced inflation has now become entrenched as a permanent feature in the U.S. economy. This is because most mainstream economists have no clue what is the progenitor of inflation. They have been inculcated to believe inflation is the result of a wage-price spiral caused by a low rate of unemployment.
In truth, inflation is all about the destruction of confidence in a fiat currency’s purchasing power. And there is no better way to do that than for the government to massively increase the supply of money and place it directly into the hands of its citizenry. That is exactly what occurred in the wake of the global COVID-19 pandemic. The U.S. government handed out the equivalent of $50,000 to every American family in various forms of loans, grants, stimulus checks, enhanced unemployment, tax rebates, and debt forbearance measures. In other words, helicopter money and Modern Monetary Theory (MMT) were deployed—and in a big way. The result was the largest increase of inflation in 40 years.
We’ve had some of the highest GDP growth rates in U.S. history over the past few months and the greatest increase in monetary largess since the creation of the Fed. But this is mostly all in the rearview mirror now. Consumer Price Inflation is all about the handing of money directly to consumers that has been monetized by the Fed. It is not so much about low-interest rates and Quantitative Easings—that is more of an inflation phenomenon for Wall Street and the very wealthy.
The idea that Consumer Price Inflation is now a permanent issue is not grounded in science. As already mentioned, inflation comes from a rapid and sustained increase in the broad money supply, which causes falling confidence in the purchasing power of a currency. At least for now, that function is attenuating.
After all, what exactly is there about a global pandemic that would cause inflation to become a more permanent issue in the U.S. economy? In the 11 years leading up to the pandemic, inflation was not a daunting issue—it was contained within the canyons of Wall Street. In fact, the Fed was extremely concerned the rate of Consumer Price Inflation was too low. And, that the economy was in peril of falling into some kind of deflationary death spiral. This is despite ultra-low borrowing costs and money printing from the Fed.
The proof is in the data. The Effective Fed Funds Rate was below one percent from October of 2008 thru June of 2017. The Fed was also engaged in QE’s 1,2, & 3 from December 2008 thru October 2014. And yet, here are the average 12-month changes in CPI for each of the given years:
2009 = -0.3%
2010 = 1.6%
2011 = 3.2%
2012 = 2.1%
2013 = 1.5%
2014 = 1.6%
2015 = 0.1%
2016 = 1.3%
2017 = 2.1%
2018 = 2.4%
2019 = 1.8%
This means, in the 11 years following the start of the Great Recession, all the way through the start of the Global Pandemic, consumer price inflation was quiescent despite the prevailing conditions of zero interest rates and quantitative easings. However, consumer price inflation began to skyrocket by the second quarter of 2021. In fact, it has averaged nearly 5% over the past four months. What caused the trenchant change? It was The 6 trillion dollars’ worth of helicopter money that was dumped on top of consumers’ heads. Regular QE just creates asset price inflation for the primary benefit of big banks and Wall Street.
But, the helicopters have now been grounded for consumers and soon will be hitting the tarmac for Wall Street once the Fed’s tapering commences this winter. Hence, CPI is about to come crashing down, just as is the growth in the money supply. M2 money supply surged by 27% in February 2021 from the year-ago period. But, in June of this year, that growth was just 0.8% month over month, or down to just 12% year-on-year.
The Government Lifeline is Being Cut
The highly-followed and well-regarded University of Michigan Consumer Sentiment Index tumbled to 70.2 in its preliminary August reading. That is down more than 13% from July’s number of 81.2. And below the April 2020 mark of 71.8, which was the lowest data point in the pandemic era. According to Richard Curtin, Chief economist for the University of Michigan’s survey, “Over the past half-century, the Sentiment Index has only recorded larger losses in six other surveys, all connected to sudden negative changes in the economy.”
Of course, a part of this miserable reading on consumer confidence has to do with falling real wages. But I believe the lion’s share of their dour view is based on the elimination of government forbearance measures on mortgages, along with the termination of helicopter money drops from the government. All told, this amounted to $6 trillion worth of bread and circuses handed out to consumers over the past 18 months. This massive government lifeline (equal to 25% of GDP) will be pared down to just 2% of GDP in ’22.
Indeed, this function is already showing up in consumer spending. Retail sales for the month of July fell 1.1%, worse than the Dow Jones estimate of a 0.3% decline. The reduced consumption was a direct result of a lack of new stimulus checks handed out from D.C. Keep in mind that retail sales are reported as s a nominal figure; they are not adjusted for inflation. Hence, since nominal retail sales are falling sharply—at least for the month-over-month period–the economy must now be faltering because we know prices have yet to recede, and yet nominal sales are still declining. This notion is being backed up by applications to purchase a new home, which are down nearly 20% from last year. That doesn’t fit Wall Street’s narrative of a reopening economy that is experiencing strong economic growth and much higher rates of inflation.
On top of all this you can add the following to the deflation and slow-growth condition: Federal pandemic-related stimulus caused a huge spike in the number of Americans that owed no federal income tax. According to the Tax Policy Center, 107 million households owed no income taxes in 2020, up from 76 million in 2019. So, multiple millions more Americans should now have to resume paying Federal income taxes this year because last year’s tax holiday has now expired.
Oh, and by the way, the erstwhile engine of global economic growth (China) is now blown. China’s huge stimulus package in the wake of the Great Recession helped pull the global economy out of its malaise. This debt-disabled nation is now unable to repeat that same trick again.
Back to the U.S., the Fed facilitated Washington’s unprecedented largess by printing over $4.1 trillion since the outbreak of COVID-19—doubling the size of its balance sheet in 18 months, from what took 107 years to first accumulate.
But all that is ending now. Next year has the potential to be known as the Great Deflation of 2022. This will be engendered by the epiphany that COVID-19 and its mutations have not been vanquished as falsely advertised, the massive $6 trillion fiscal cliff will be in freefall, and the Fed’s tapering of $1.44 trillion per annum of QE down to $0, will be in process.
Then, the economy will be left with a large number of permanently unemployed people and businesses that have permanently closed their doors. And, the $7.7 trillion worth of unproductive debt incurred during the five quarters from the start of 2020, until Q1 of this year, which the economy must now lug around.
All this should lead to a stock market that plunges from unprecedentedly high valuations starting next year. And, in the end, that is anything but inflationary. Indeed, what it should lead to is more like a deflationary depression. But the story doesn’t end there. Unfortunately, that will cause government to change Modern Monetary Theory from just a theory to a new mandate for the central bank. And hence, the inflation-deflation, boom-bust cycle will continue…but with greater intensity. The challenge for investors is to be on the correct side of that trade.
Last summer, I recognized an odd phenomenon. An obscure entity named Grayscale Bitcoin Trust (GBTC – USA) was slowly cornering the free float in Bitcoin. This was a result of the trust structure where any capital that went in, was converted into Bitcoin, but there was no mechanism in place to ever sell coins and redeem that capital. As a result, GBTC became a growing repository of Bitcoin. At first, it bought a few hundred coins a day, then a thousand, then a few thousand. As the trading volume increased, the inflows also increased. As the inflows increased, the daily bitcoin purchases increased, eventually driving the Bitcoin price higher. As the price went higher, new investors were drawn to GBTC and the inflows accelerated—spinning the flywheel faster. It was so obvious that this would lead to higher prices, that I called it “My Favorite Ponzi Scheme…” Over time, much as I had predicted, these inflows drove the price of Bitcoin and ultimately GBTC dramatically higher. Early this year, I had a well-timed exit for a quick multi-bagger and my capital went onto greener pastures in depressed energy assets.
I bring this all up, as I see a similar phenomenon in uranium—a much smaller and less liquid market, potentially creating a more dramatic effect should inflows accelerate. Long-time readers of this site will remember that I have a sweet spot for Uranium. I wrote about it back in 2019 but sold out during the first quarter of 2020 as the global equity markets collapsed and better opportunities presented themselves. At the time, the thesis, while directionally accurate, didn’t pan out as the supply deficit was insufficient to overcome above-ground stockpiles, capping price discovery.
In the year and change since I sold out, the overall supply deficit has continued to increase, while above-ground stockpiles have continued to be consumed. While uranium aficionados like to fixate on calculating the current deficit to the nearest decimal, for the sake of this post, let’s use some VERY broad numbers. The world is producing roughly 125 million pounds from primary mining, 25 million pounds from secondary sources and consuming roughly 180 million pounds, for an overall deficit of 30 million pounds a year. This deficit will only increase in future years, as additional reactors come online. If you want to quibble with my numbers, quibble away. I know I’m off by a few million pounds, but so is everyone else. No one really knows the true numbers—which is what makes commodity markets so fascinating in the first place. All that matters is that there is a deficit, it’s a big percentage of total production, new mines are not coming online at current prices and existing mines have had years of under-investment—hence production should continue to trail off without new investment.
How large are the above-ground stockpiles? No one knows. All we know is that they’re drawing down rapidly and outside of government entities, most of the stockpiles are spoken for by utilities, which are using their uranium to fabricate finished products for their reactors. However, a new class of investors has entered the market and they’ve completely upended the equilibrium.
My Favorite Ponzi Scheme…
Remember, GBTC?? I remember it quite fondly. What if I told you there’s another entity doing the same thing in uranium, but it is cornering the free float at a rate that makes the boys at GBTC look like amateurs? What if the free float is organically shrinking due to the supply deficit? What will happen as institutional investors jam themselves into a far smaller market? Fukit, who cares? Someone intends to conduct this science experiment; consequences be damned. Importantly, this entity is using an At The Market offering (ATM). Hence, it immediately produces free trading shares; increasing trading volume far more rapidly than GBTC with its 6-month hold—making acquisition by institutional investors possible and driving adoption. Basically, it’s GBTC 2.0—issue shares to buy product. Every day. Relentlessly. Except, against a smaller and shrinking asset class.
Remember, no one ever needs a bitcoin. Everyone who is long Bitcoin is a potential seller and on the way up, they’ll all eventually sell. Uranium is different—almost everyone who owns uranium today, owns it because they intend to consume it—these owners are all incremental buyers going forward. In a market with a deficit, they’re all implicitly short uranium. With an entity buying up the free float, they’re going to get squeezed. We all know how squeezes work, but I don’t know of any similar scenario where the squeeze was as aggressive or blatant. The utilities are blissfully unaware, they’re eventually going to panic and pay any price for uranium.
There is one other unique quirk to the uranium market when compared to Bitcoin. No one actually needs a Bitcoin. A nuclear reactor is a VERY expensive paperweight if it cannot procure uranium. As above-ground stockpiles are depleted and remaining pounds disappear into a trust that will not sell those pounds, there’s a good chance that reactors are forced to bid aggressively against this entity for the remaining available pounds.
Sprott Physical Uranium Trust commonly known as SPUT (U-U – Canada), is the entity that has upended the uranium market. Since launching its ATM 13 days ago, it has acquired 2.7 million pounds of uranium. This is an average daily rate in excess of 200,000 pounds or roughly a third of global production on an annual basis. If GBTC is the roadmap to follow, as the price of uranium begins to appreciate, the inflows into the trust should accelerate. Interestingly, there are plenty of other entities also purchasing physical uranium, uranium that utilities were counting on for their future needs. The squeeze is on.
As expected, the utilities are blissfully unaware. Surprised?? I’m not. Utilities are quasi-governmental agencies, managed by the types of fukwits who’d work at your local DMV, except they enjoy stock options. The fact that they’ve ignored the coming squeeze shouldn’t be surprising. Inevitably, they’ll demand rate increases to buy back this uranium–it’s not their money anyway. This is your bid at some point in the future.
Commodities are determined by supply and demand. Uranium is a small market at roughly $6.3 billion in annual consumption (180 million pounds at $35/lb). SPUT has raised approximately $85 million in the 13 days since the ATM went live. It’s hoovering up supply and is already struggling to procure pounds, as shown by their increasing cash balance—cash that they’re legally forced to spend. Something is going to give here, and I suspect it’s the price of uranium.
In any case, when I saw the rate at which SPUT was issuing shares, I legged into a rather large pile of SPUT. I’m also long a few producers along with some juniors for extra kick. (Please don’t ask me which—if I wanted to name them, I would have). Uranium just broke out to 5-year highs. New highs bring in publicity, which often brings in new buyers and the cycle repeats. I like buying new highs from a big base—especially with SPUT out there playing Pac-Man. I pulled back my exposure all summer as I was awaiting something interesting. I don’t think I’ll see anything better than uranium for a while. Let’s just say that I’m suddenly back to being VERY fully invested.
Caveat Emptor
Disclosure: Funds that I control are long SPUT and various other uranium related entities
This weekend, I watched in baffled amazement as our President and his entire administration went on vacation, abandoning tens of thousands of Americans, along with allied citizens, to their fate in Afghanistan. America has done some embarrassingly dumb things during my lifetime, but this one displayed a special sort of arrogance and incompetence that can only develop through years of hubris, gross negligence, and dereliction of the basic tenets of governance.
Let me state categorically that we should have gone home from Afghanistan long ago. What started as a mission to track down Osama bin Laden, morphed into an impossible adventure with nebulous goals, many of which were unobtainable and quite ludicrous. That said, four Presidents and countless generals all had time to strategize and plan our exit. This weekend’s events were truly a colossal klusterfuk of the highest order, overseen by the most senior leadership of our nation. Despite two decades to strategize and war-game this inevitable event, these assholes literally had no plan to extract our people and send them home safely. It seems that our leadership was as baffled and mesmerized by the events as I was.
An educated observer of world affairs will craft their own opinion of things. I don’t think anyone expected the corrupt Afghan government to hold things together once the American military went home. Everyone knew the situation was highly combustible. However, after two decades of stability, everyone close to the situation had chosen to ignore the true facts on the ground. Sure, they all assumed that when the military went home, it would collapse, but it was expected to take years, not days. Then again, after two decades where a highly unstable situation remained stable, everyone in leadership grew numb to just how unstable the situation really was.
I bring this all up because the whole world is on the Federal Reserve standard. All of us intuitively know that markets, in general, are highly unstable. The current market is particularly unstable—only held aloft, at stratospheric valuations, by excessive money printing. Every time there’s been a whiff of reduced QE or a threat of rate increases, the market has melted, and the Fed has ridden to the rescue. As a result, we have all implicitly accepted that the Fed will always be there to protect the market should things get more than a bit out of hand—much like the Afghans expected the US military would be there backing them up forever. We just saw how rapidly an army can melt away when their protector leaves the field. What if the Fed does the same to the markets?
Jack Dorsey celebrates the Taliban victory…
Of course, no one can conceive of an event where the Fed is forced to step away. That outcome seems so far outside of our recent experience, that it is assumed to be impossible. What if it isn’t? Just because the Fed has been there for the past two decades, roughly the same period overlapping with our occupation of Afghanistan, doesn’t mean that it will be there for the next two decades.
One of the scariest market-related black swans I can think of, is a situation where the Fed cannot intervene—especially as everyone assiduously expects that the Fed will always be there. Am I crazy to think that as inflation accelerates, the Fed will increasingly be boxed into a corner? The Fed has never really been independent of political action. What if the voters begin to complain about their cost of living? Do you not expect for the politicians to step in and demand a fix? What if the Fed suddenly needs to show a backbone and pretend to tame inflation for political reasons? Is anyone positioned for that? I know I’m not. Instead, I’m positioned for them simply ignoring the accelerating inflation that they’re causing.
I’m not here making a market call—I’m actually quite long a bunch of inflation assets. Rather, I’m pointing out that unstable things can go bad in a hurry. If the Fed were ever forced to step back, even for a moment, it would be cataclysmic for the markets—much like the US military stepping back in Afghanistan. Unstable situations inevitably implode—they can only be propped up for so long. Sometimes, we grow numb to something that’s unstable and assume that since it’s gone on for a long time, it will continue.
The vast majority of Afghans came of age during the US occupation. Nothing else seemed possible to them. Then came the shock. Most market participants today only know of the Fed’s ability to prop up markets. Is anyone prepared for a Fed that has to fight AGAINST escalating inflation?
Never Forget….
While I anticipate that we’re on a path called “Project Zimbabwe,” I also realize that this isn’t a linear path. Unstable things tend to crumble. What if the Fed needs to step in and fight inflation—rather than ignoring it? What if it is the Fed that’s suddenly draining the punchbowl, instead of refilling it as was expected? I realize that it’s unlikely, but I always keep this in the back of my mind. You should too.
I like to remind people that if you’re going to panic, make sure to panic first. Artificial systems are unstable—when they turn, it’s sudden and violent. Don’t get caught on the wrong side by assuming that an unstable system will forever remain stable.
Highly skilled equity managers know how to find great stocks, but they are not so good at knowing which positions to sell. That observation comes from a recently published paper which is the subject of this post. The problem here is one of attention. Great PMs spend a lot of time looking for the next big idea and much less on evaluating their current positions. When they sell, that information gap leaves them open to unproductive mental shortcuts. Good news: the paper’s findings point to 4 hacks around this problem.
* * *
The decision to buy or sell a stock should be based on the same question: how will it perform in the future? Therefore, you’d think that highly skilled portfolio managers would be good at both. They should (generally) pick winners and sell them when they’re about to stop working.
A recently published NBER paper shows that’s not what happens, however. The paper’s title, “Selling Fast and Buying Slow: Heuristics and Trading Performance of Institutional Investors”, is a nod to Daniel Kahneman’s book “Thinking, Fast and Slow”. We love a good behavioral finance story, so the paper’s findings and our thoughts on them are the subject of this week’s Story Time Thursday.
The study, done by researchers at the University of Chicago, MIT, and UK data firm Inalytics, (link to the full paper below) looked at buy and sell decisions across 783 actively managed portfolios from 2000 to 2016. All portfolios were unlevered and actively managed by institutional, long-only managers who make concentrated bets (average of 80 positions at any one time). They outperformed by an average of 2.6 points/year over their benchmarks during this period, so we’re talking about a skillful group of individuals.
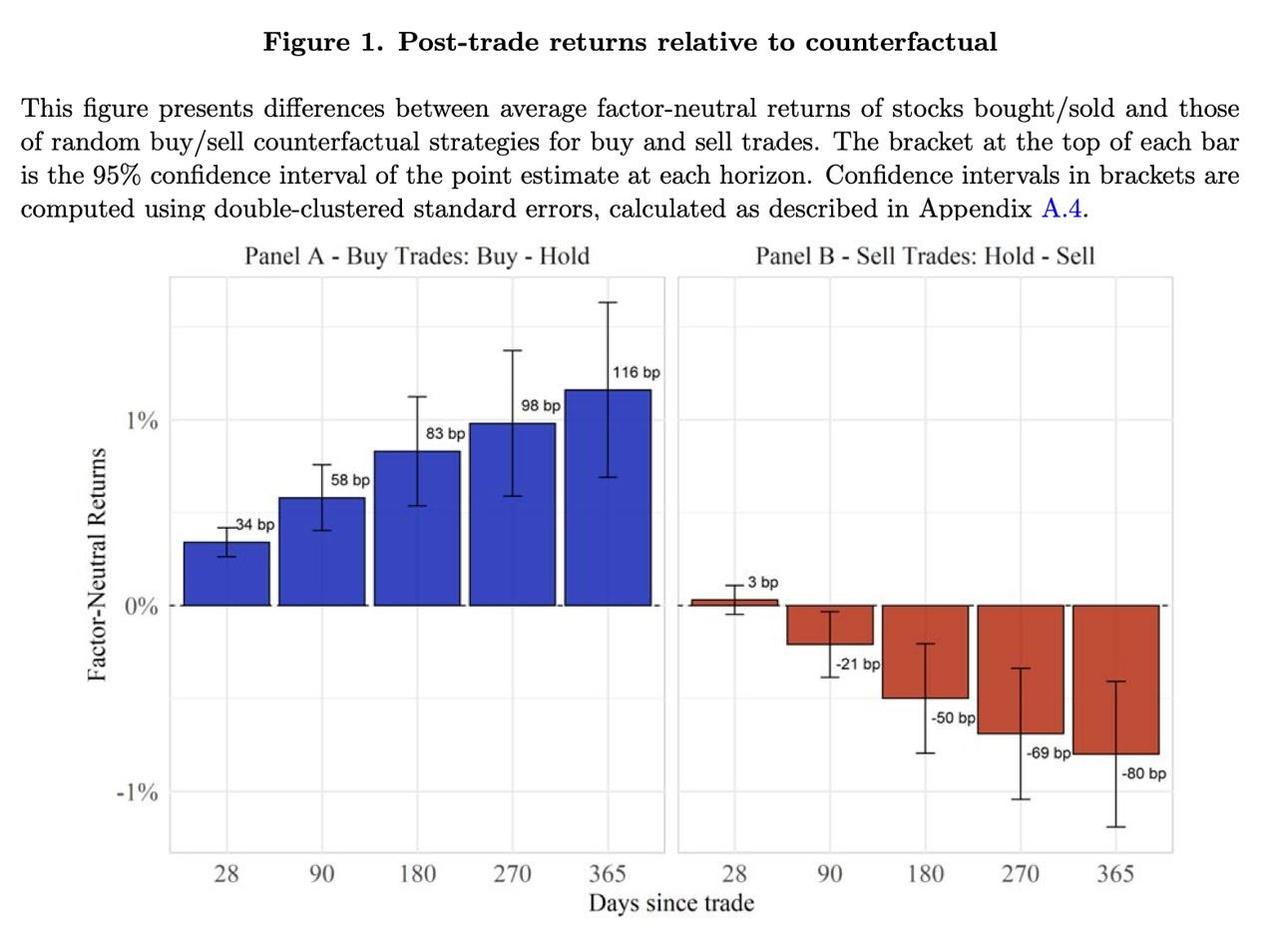
This graph summarizes the researchers’ key finding: these PMs were great at buying the right stocks, but not so great at knowing which names to sell out of their portfolios. The left side bar graph shows that these managers on average picked winners versus their benchmark. Great, but … The graph on the right shows they would have been better off either 1) selling a small part of every name in their portfolio or 2) randomly picking a name to ax, rather than selling the name they chose to cut loose.
The paper’s authors believe that “the stark discrepancy in performance between buys and sells is consistent with an asymmetric allocation of limited cognitive resources towards buying and away from selling”.In layman’s language, there’s only 24 hours in a day and PMs spend most of that time looking for the next hot investment idea. That leaves less time for keeping up on the names they already own. When pressed to sell out a position, therefore, they lean on counterproductive heuristics (mental shortcuts).
As odd as all this sounds, the realities of running a money management business do (sort of) demand it:
Describing new and interesting investment ideas is a huge part of the marketing process for investment managers. Many fund-raising meetings start with the allocator asking “OK, tell me a stock story I haven’t heard before”. Of course a PM is going to allocate more time to finding a new name rather than having to discuss something they’ve owned for a while and will therefore seem stale.
Wall Street doesn’t care about counterfactuals. If a PM has a winning record, they will generally be able to find new clients. “You’re a great money manager, but you sell the wrong names so I’m not giving you any money to manage” has never been said by anyone, ever.
Even with that cynical (but absolutely correct) second point, the paper does still offer 4 actionable observations that we believe are applicable to anyone looking to improve portfolio performance:
When a good investment process leads you to an idea, do all the work up-front and size it appropriately (i.e., no “cheerleading positions” – make it count). Selling low-conviction ideas (as measured by portfolio weighting) was responsible for most of the underperformance the researchers found in the data. These were names the PM had put on the sheet in a small way, but had not felt confident enough to size up. When they found something they thought was better, they ditched the small holding to fund their next purchase.
It can often be a good idea to wait for the next earnings report before selling. Researchers found that sales made on earnings announcement dates “substantially” outperformed the random-sale counterfactual (randomly selling a name or just cutting back the entire portfolio evenly). Oddly, purchases made on earnings announcement days saw no net outperformance versus other buys.
Don’t just focus on whether a name has been a big winner/loser for you when deciding to sell. Past performance is not a predictor of future returns, but the PMs studied still sold outliers (big winners or big losers) at rates “more than 50 percent higher” than other positions. As with the prior point, this bias did not exist when PMs made Buy decisions.
Value investors beware; the paper found that “funds that score higher on value appear to underperform most in selling”. Momentum strategy portfolios, by contrast, had no selling underperformance over the 1 year after their sales.
The bottom line to all this: where the head goes, the portfolio follows. Finding new ideas to own requires a disciplined approach, but so does making sales. The paper’s key finding is that even highly skilled managers mentally overweight “buying” and underweight “selling”, leaving them open to a range of unproductive heuristics when deciding to unload a position. The good news – for them and for all investors – is that correcting this imbalance comes down to just paying a bit more attention to what’s already in the portfolio.
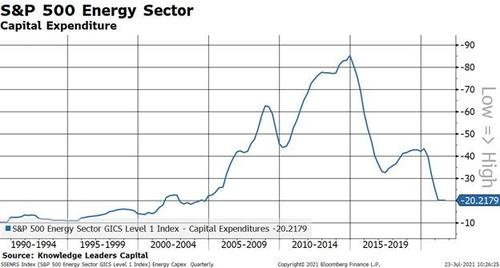
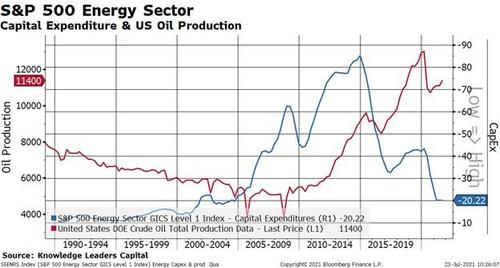
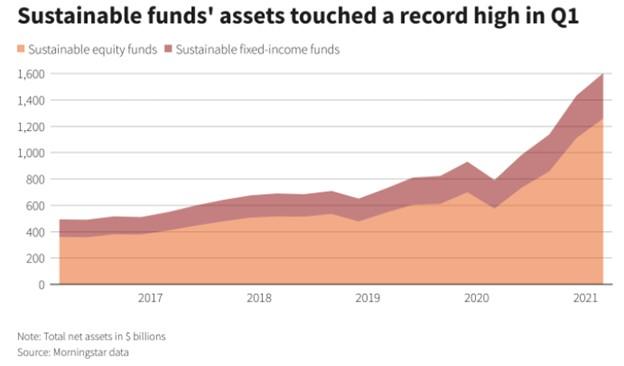
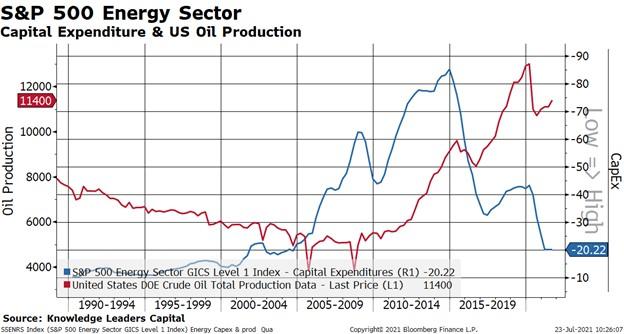
Public attitudes toward energy companies are changing, and with it capital investment in energy companies is shrinking. Perhaps nothing speaks louder than actions. In the first quarter of 2021 investment in environmental, social and governance (ESG) focused funds hit a record high by a wide margin.
Meanwhile, capital expenditures by US energy companies hit the lowest levels since 2004. Put another way, the energy sector is being starved of capital.
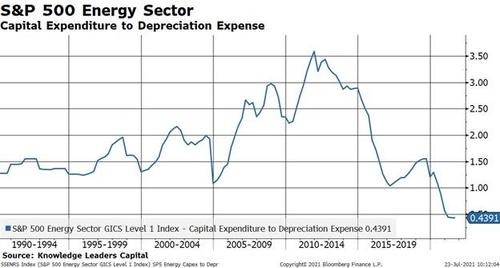
This concept of capital starvation is crystal clear when we compare capital expenditures to depreciation expenses. A ratio above one indicates an expansion of assets net of depreciation and a ratio below one indicates a shrinking asset base. Currently, energy assets are shrinking at the fastest rate on record. In the latest quarter, only 44% of depreciated assets were being replaced by new assets.
This raises an obvious question as to how oil production can possibly be maintained at current levels if only 44% of assets are being replaced by new capex. The obvious answer is that, over time, it cannot. If energy capex levels remain at these levels investors may want to seriously consider if US crude oil production will in the foreseeable future return to the previous highs of about 12.5 million barrels per day.
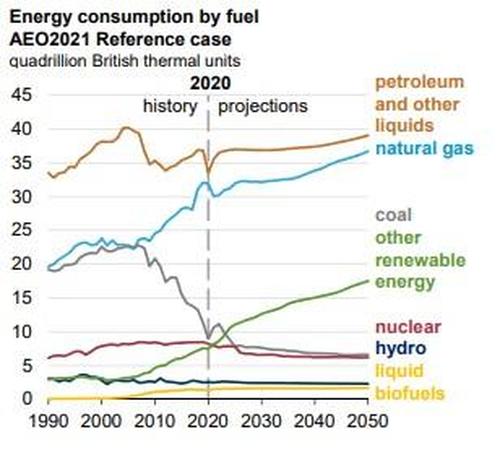
Of course, if crude oil and natural gas consumption was shrinking, an atrophying fossil fuels sector wouldn’t be that big of a deal. But, according to the US Energy Information Administration, petrol and natural gas consumption will steadily rise through 2050 even as renewables gain significant share.
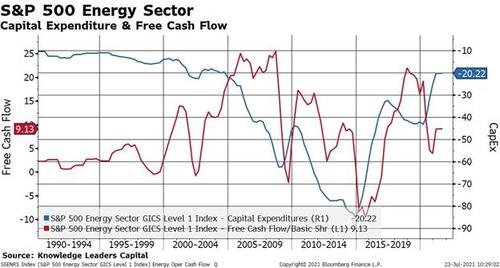
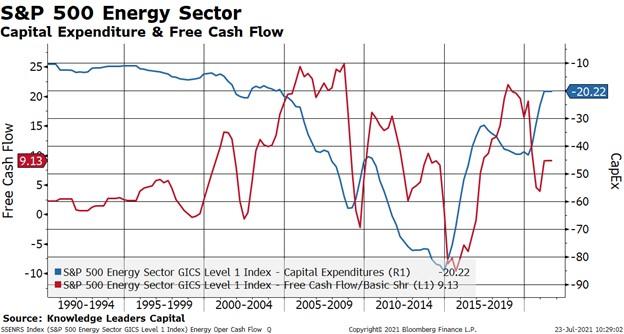
Rising consumption combined with flat to falling production due to capital starvation would seem to be a good thing for both the price of petrol products as well as the fundamentals of energy companies themselves. Indeed, free cash flow does track the level of capital expenditures quite nicely over time, and the 17-year low in capex may portend the highest levels of free cash flow for energy companies in at least a decade.
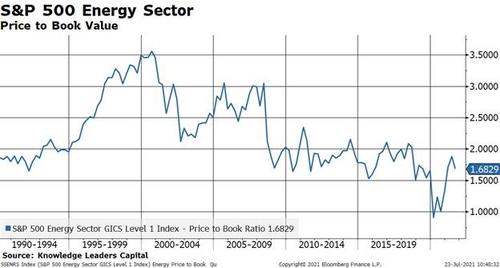
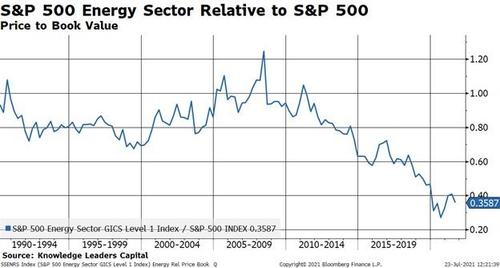
Even as the fundamentals of energy companies may be improving, valuations remain stubbornly subdued, thanks in part to the trend of investors adopting ESG strategies at a torrid pace. For example, the absolute price to book value ratio remains near the lowest levels of the last decade.
The price to book value ratio for energy companies relative to the S&P 500 is close to the lowest levels in our dataset.
All this suggests that, for investors willing to buck the trend, providing some capital to a capital starved industry may pay dividends.


