TECHNICAL ANALYSIS: OUTLOOK FOR 2019 – MARKETS LOOKING FOR LIQUIDITY

Mehul Daya and Neels Heyneke are out with a fantastic technical report on global markets……..they write,Last year, global dollar liquidity contracted, and the dollar and emerging markets reacted to this contraction. This year will determine whether the tighter global financial conditions will continue to work their way into the bond and equity markets or if central banks will come to their rescue. A lot of research effort is spent on future Fed policy, but we believe the Chinese monetary system is the weakest link right now and that it needs to be monitored closely.

• We have been warning since early last year that deflationary, and not inflationary, forces remain the bigger headache.

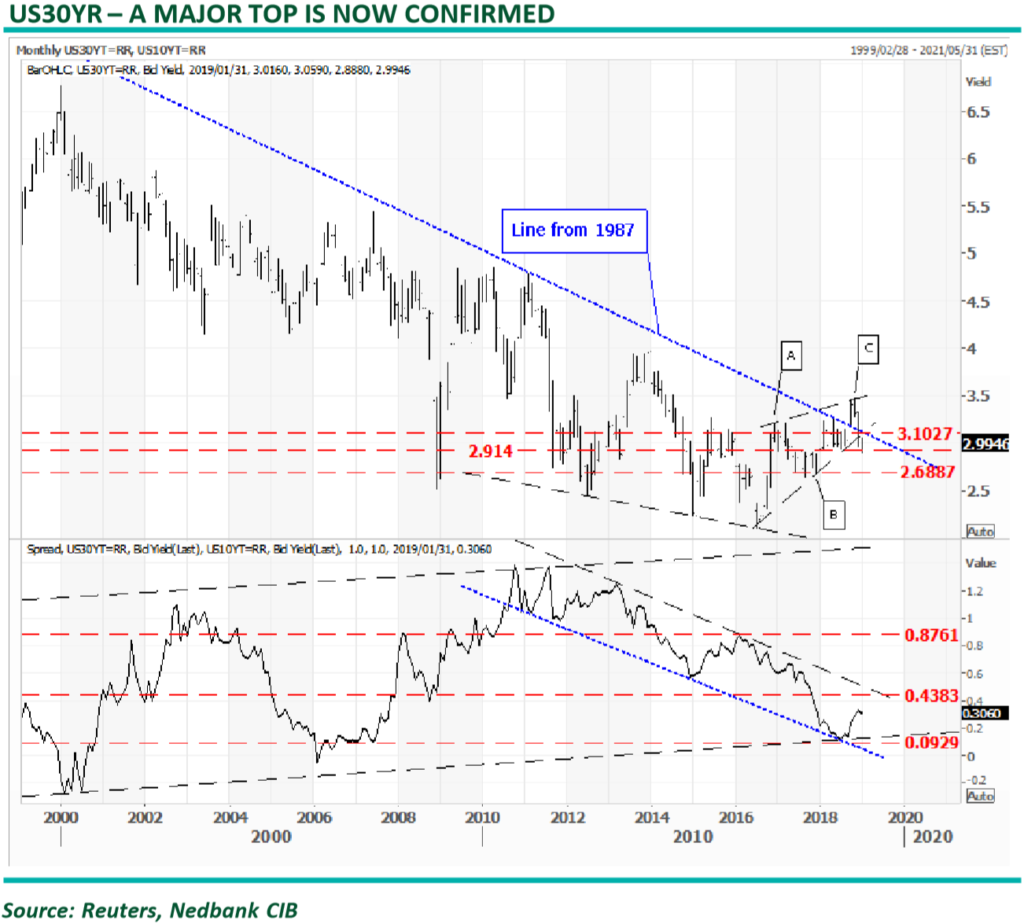
• The fact that the break out of the bull trend since 1987 has proved to be false on the US government 30-yr is a buy signal in itself. The break below 3.10% projects a move to 2.68%, with more downside potential after that.

• The 30-10yr spread remains in the bull trend that started in 2012 as QE programmes compressed term premia and volatility. A break above 43 basis points will indicate the markets are starting to price risk into the curve, which will not be good news for risk assets.
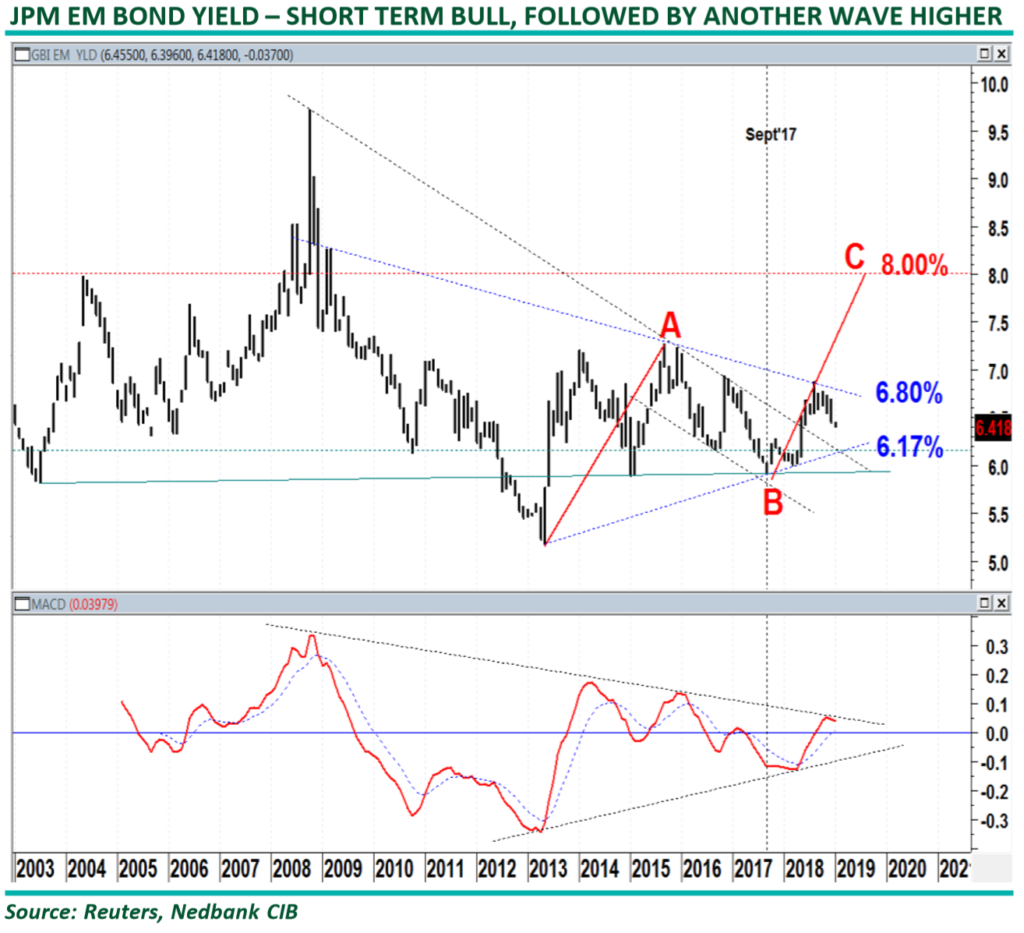
The JPM emerging market bond yield bottomed with the “Taper” statement in 2013. Yields peaked in early 2016 with the “Shanghai accord” and bottomed out in September 2017. This was several months before the risk-off started in other asset classes – in late January 2018, with the VIX sell-off. • Wave A was in the region of 2%, and in theory, wave C should also be 2%, targeting 8%.

• We believe the fundamental driver of this move will be the Chinese economy and, subsequently, a further contraction in global dollar liquidity. • We have had the view, since early last year, that a repeat of the 1998 SE-Asia is a likely outcome. This time, China will be the victim of the impossible Trilemma, which states that it is impossible to have all three of the following at the same time: a fixed foreign exchange rate, free capital movement and an independent monetary policy.
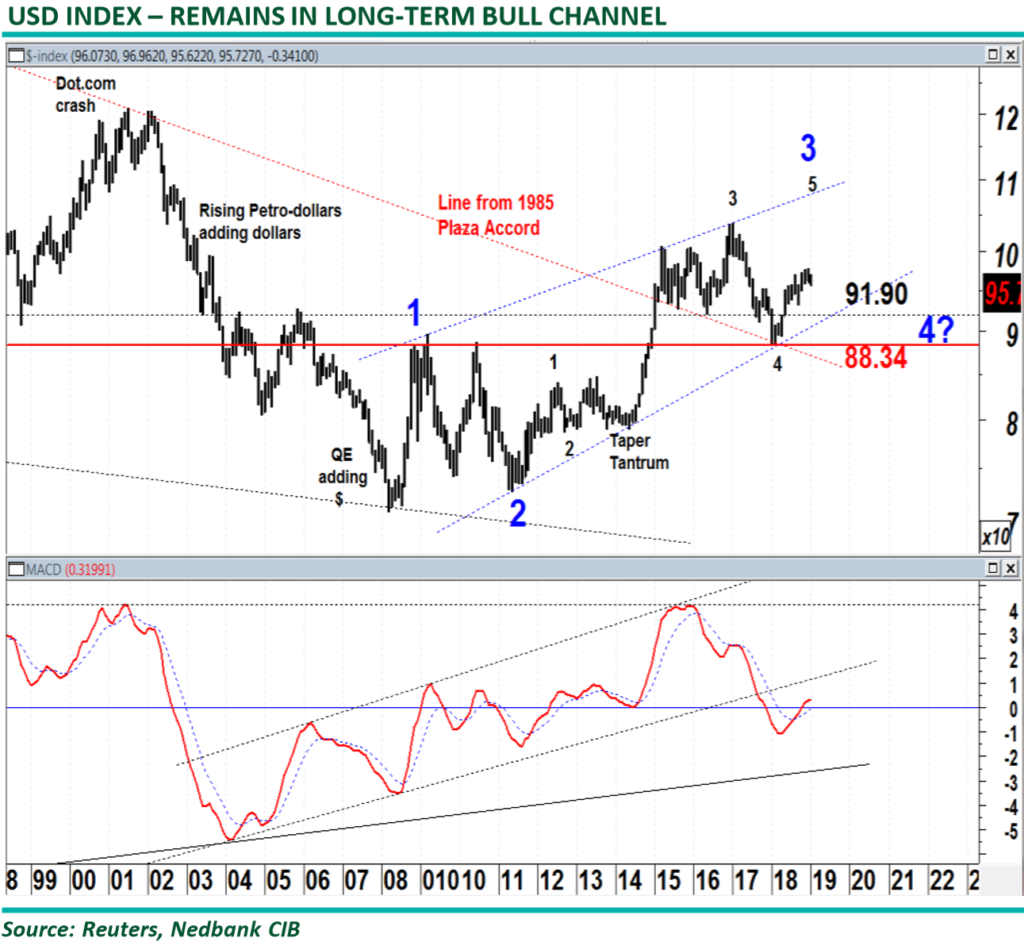
The dollar has been in a bull market since the GFC and rallied in early 2018 from the important support line from 1985 at 88.34. • We have written extensively over the last few years that interest rate differentials alone are not the only drivers of currencies anymore. The quantum of dollars in the system, stemming from Fed policy, developments in the euro-dollar system, global growth (velocity of money) and shadow banking activities need to be taken into consideration. • The dollar bull lost momentum during 4Q18, and a correction is playing out. The target levels for this correction are 93.09 and the neckline and support line at 91.90. • Only a break below the latter level, out of the bull trend since 2010, will force us to revisit our long-term bullish view on the dollar.
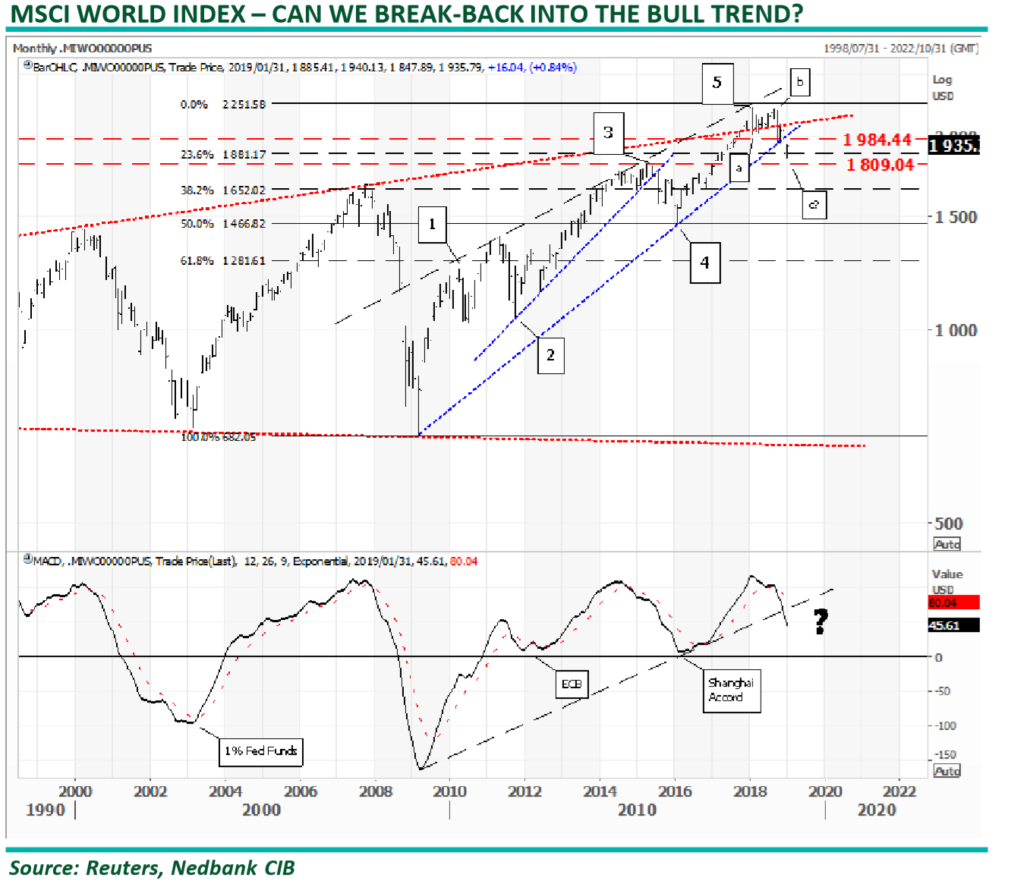
The performance of the US markets helped the MSCI World Index to remain above the resistance line through the highs since 2000. The break was, however, not sustainable, and the break back below the resistance and below the support line from 2009 is a bearish signal. At this point, the correction from the 1Q18 is still an ABC pattern, which indicates a correction phase. Any further downside move below 1,809 will, however, confirm that the market is trending to the downside, targeting the wave 4 low at 1,466. • The Shanghai Accord, however, managed to stop a bear trend from unfolding. There are many views that the central banks must reverse their tightening biases. That is surely possible, but we are sceptical about whether a new Shanghai Accord can be reached, as the global geopolitical landscape is quite different today vs that in 2016. • In a geared world of shadow banking and asset inflation, bear markets do not always start with the economy slowing down. In 1998, 2000 and in 2008, tighter financial conditions derailed markets, triggering an economic slowdown. The reason being, as asset prices fall, the re-hypothecation process slows down, triggering a major liquidity squeeze that works its way back into the real economy.
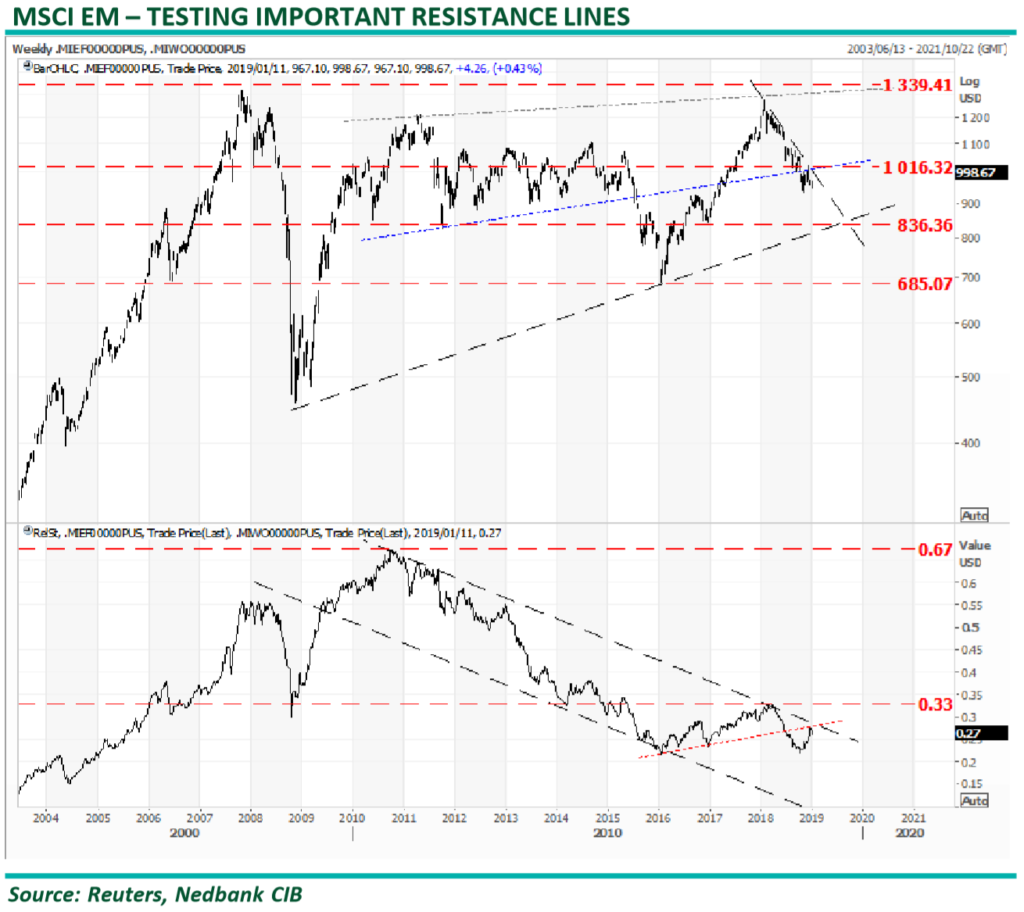
The MSCI EM has been in a bear market since the start of 2018. The EM equities bottomed out, along with the EM currencies, during 4Q18. However, EM equity markets failed to rally, as the US equity markets came under pressure. • The EM index is currently trading against an important resistance line at 1,016. It is crucial for the bull story that the EMs must accelerate through this resistance in the near future. • If the index fails at current levels, it would project further downside to the support line and previous low at 836. The JSE Top-40, in USD terms, is already consolidating against an equivalent support line to the 836line. • The bottom panel is the relative of EM over DM equities performance. The relative rallied within this well established bear channel during the riskon phase of 2016 and 2017 but turned down sharply during 2018. We believe the latest rally will turn out to be a goodbye kiss against the red neckline and expect the relative to turn down from current levels.
Signs of Monetary Restraint

Lacy Hunt writes… our current lower rate and inflation circumstances are due to lower velocity of money, higher debt, and poor demographics. Therefore, a larger percentage decline in inflation and interest rates can be expected. Even a mild recession in 2019 would put the Fed in an untenable situation.
It is conceivable that the Fed, constrained by the zero-bound interest rates and in attempting to raise economic activity, could engage in another untested experiment with unforeseen consequences to boost debt levels. If that occurs, the U.S. debt overhang would worsen and the country would follow a path pursued by other heavily indebted countries such as Japan, Europe and China. The risk is rising that the U.S. will not only return to zero short rates but, as they have in Japan, might remain there for several years.

http://hoisingtonmgt.com/pdf/HIM2018Q4NP.pdf

The Three R’s: Relapse, Reflate And Rebound

Alpine Macro writes…Stepping into 2019, global financial markets are fraught with risk and uncertainty. The steep drop in global equity prices since October 2018, the sharp decline in oil prices and the strong rally in government bonds have seriously dented investor sentiment, creating a heightened sense of pessimism.
However, we believe that 2019 will play out differently from how it has begun, because policy reflation is on the way. Barring major policy mistakes by the Fed, the Trump administration or Chinese policy makers, risk assets should rally on policy reflation and, eventually, an improving global growth outlook.
Specifically, the losers of 2018 could be the winners under our scenario: They’ve been beaten down in anticipation of a growth relapse, will benefit from policy reflation and should subsequently rebound.

https://cp-in-13.webhostbox.net:2096/cpsess9364934343/3rdparty/squirrelmail/src/download.php?startMessage=1&passed_id=18358&mailbox=INBOX&ent_id=2&passed_ent_id=0

The “Big One”(vol event) hasn’t happened yet

Chris Cole explains in this must read interview…The first thing to understand is that volatility is not just the left tail. It’s not just the world ending. One of the highest periods of volatility in history was during the Weimar Republic in Germany when they went into their hyperinflation. Vol went up to 2000%, all on the right tail. So you can have periods where there is a massive amount of volatility with higher asset prices.

A great example of that in recent history was during the Nasdaq bubble in the late 2000s. Volatility was actually averaging higher than where it is today and the market was going up and up and up. You had a 100% increase in the stock market during a period of plus-20% or more volatility. That’s pretty amazing.

You can have right tail and left tail vol. You just need movement. You need change. Vol is the profiting from change.

It’s difficult to explain our entire suite of what we do, but I can give some glimpses of the philosophy behind it. One aspect is you can never predict what spark will cause a forest fire but you can predict the underlying conditions that lead to a higher probability of a forest fire.

An example of that is that if you’re looking to gauge whether or not a forest fire is going to start in California (and the forest service does do this), you look at things like buildup of dry chaparral, high wind conditions, dry weather conditions, lots of lightning strikes. These things, when put together incrementally, increase the probability of a fire breaking out.

On the same vein, we can scan thousands of cross-asset global macro conditions and use those to probabilistically build an expectation as to whether or not right- or left-tail volatility will be
realized in any given asset class. That produces an ability for us to dynamically size that exposure when the probability of a volatility wildfire is greatest. That’s one of the most effective ways that we can do it.

Another thing to do is to use vol arb techniques. There’s situations where you are paid to own volatility – usually you’re just buying into a vol spike when term structures are inverted – is an example of that type of opportunity where you’re actually paid to own that convexity exposure.

There’s other situations where – I think in one of my papers I talked about this – the George Lucas trade where, when Lucas was making a space opera, which we now know as Star Wars, the studio came to him and he was given about a million dollar salary. And he said, well, you know, I don’t want a million dollars. Give me $150 thousand, but I want to own the merchandising and sequel rights to my new property.

Of course, we all know how that turned out. That $850 thousand option that Lucas bought by giving up his carry turned into about $46 billion. Not a bad trade. George Lucas was a very smart options trader.

In some aspects, when you have an opportunity to own some linear carry, you can recycle that carry into very powerful convexity exposure on either tail. And that convexity exposure, it usually takes a big move for that convexity exposure to pay out. But that’s an example of when you can carry volatility in an efficient way.

So it’s a combination of these types of strategies that enables you to own the optionality on change without the significant negative bleed.

Can you do this yourself? Boy, it’s tough. I mean, I’ve got a whole team of PhD data scientists and experts – we even have an Olympic swimmer on staff – it takes an entire team scanning a lot of data and working very, very hard on this one specific task.

So, yeah, you know what? Will you lose money buying VIX futures? Yeah, of course. That’s not a very smart way to do it. That’s why it takes a lot of hard work and a lot of experts spending a lot of time and energy and effort and upfront money to be able to find smart ways to carry long-vol exposure

https://www.macrovoices.com/macro-voices-research/podcast-transcripts/2446-2019-01-03-transcript-of-the-podcast-interview-between-erik-townsend-and-chris-colef

Issues 2019

Doug Noland writes….When I began posting the CBB some twenty years ago, I made a commitment to readers: “I’ll call it as I see it – and let the chips fall where they will.” Over the years, I made a further commitment to myself: Don’t be concerned with reputation – stay diligently focused on analytical integrity.

I attach this odd intro to “Issues 2019” recognizing this is a year where I could look quite foolish. I believe Global Financial Crisis is the Paramount Issue 2019. Last year saw the bursting of a historic global Bubble, Crisis Dynamics commencing with the blow-up of “short vol” strategies and attendant market instabilities. Crisis Dynamics proceeded to engulf the global “Periphery” (Argentina, Turkey, EM, more generally, and China). Receiving a transitory liquidity boost courtesy of the faltering “Periphery,” speculative Bubbles at “Core” U.S. securities markets succumbed to blow-off excess. Crisis Dynamics finally engulfed a vulnerable “Core” during 2018’s tumultuous fourth quarter.

As we begin a new year, rallying risk markets engender optimism. The storm has passed, it is believed. Especially with the Fed’s early winding down of rate “normalization”, there’s no reason why the great bull market can’t be resuscitated and extended. The U.S. economy remains reasonably strong, while Beijing has China’s slowdown well under control. A trade deal would reduce uncertainty, creating a positive boost for markets and economies. With markets stabilized, the EM boom can get back on track. As always, upside volatility reenergizes market bullishness.

I titled Issues 2018, “Market Structure.” I fully anticipate Market Structure to remain a key Issue 2019. Trend-following strategies will continue to foment volatility and instability. U.S. securities markets rallied throughout the summer of 2018 in the face of a deteriorating fundamental backdrop. That rally, surely fueled by ETF flows and derivatives strategies, exacerbated fragilities. Speculative flows fueling the upside destabilization eventually reversed course – and market illiquidity soon followed. Yet short squeezes and the unwind of market hedges create the firepower for abrupt rallies and extreme shifts in market sentiment.

Market Illiquidity is a key Issue 2019. Its Wildness Lies in Wait. Rallying risk markets create their own liquidity, with speculative leverage and derivative strategies in particular generating self-reinforcing liquidity. Recovering stock prices ensure bouts of optimism, along with confidence that robust markets enjoy liquidity abundance. Problems arise with market downdrafts and De-Risking/Deleveraging Dynamics. Rally-induced optimism feeds unreasonable expectations and eventual disappointment.

Crisis Dynamics tend to be a process. There’s the manic phase followed by some type of shock. There is at least a partial recovery and a return of optimism – often bolstered by a dovish central bank response. It’s the second major leg down when things turn more serious – for sentiment, for market dynamics and illiquidity. Disappointment turns to disenchantment and, eventually, revulsion. It’s been a long time since market participants were tested by a prolonged, grinding bear market.

The February 2018 “short vol” blowup was a harbinger of trouble to come. I believe the January 3, 2019 “flash crash” portends serious Issues 2019 in global currency markets. An 8% intraday move in the yen vs. Australian dollar exposed problematic liquidity dynamics. Last year, the “short vol” market signal was initially dismissed then soon forgotten. The recent currency market “flash crash” is an ominous development of potentially momentous significance.

Our so-called “king dollar” is indicating some vulnerability to begin the new year. Newfound Fed dovishness has caught many traders too long the U.S. currency and short the yen, Canadian dollar, renminbi and EM currencies more generally. A clash among a band of fundamentally weak currencies is a critical Issue 2019. When the current currency market short squeeze runs its course, I see a marketplace that’s lost its bearings. A new global currency regime of extraordinary uncertainty, instability and volatility is an Issue 2019. This unsettled new regime is not conducive to speculative leverage.

The U.S. dollar has serious fundamental issues: Trillion-dollar fiscal deficits; large structural Current Account Deficits; huge government, corporate and household debt loads; fragile securities markets; a maladjusted Bubble Economy; political dysfunction and, potentially, Washington chaos; and festering geopolitical risks.

The world’s reserve currency is fundamentally unsound. The dollar is also the nucleus for a financial apparatus financing much of the world’s levered speculative holdings. De-risking/Deleveraging Dynamics in 2018 saw waning liquidity and widening funding and hedging costs in the entangled world of dollar funding markets. With the likes of Goldman Sachs and Deutsche Bank seeing CDS prices rise significantly late in 2018, mounting systemic fragility would appear a serious Issue 2019.

China’s currency has serious fundamental issues: A vulnerable banking system approaching $40 TN of assets (more than quadrupling since the crisis), with Trillions of potentially suspect loans; a troubled “shadow” banking apparatus; an historic housing Bubble with an estimated 65 million vacant units; a deeply maladjusted economic structure; Bubble economic and financial structures dependent upon ongoing loose financial conditions and rapid Credit expansion; huge financial and economic exposures to the emerging markets and the global economy more generally; a population with significantly elevated expectations prone to disappointment and dissatisfaction; and mounting geopolitical risks. In short, China’s historic Bubble is increasingly susceptible to a disorderly collapse.

Hong Kong’s Hang Seng China H-Financial Index dropped 18% in 2018, although China’s banks outperformed the 28% fall in Japan’s TOPIX Bank Index. I would tend to see Asian finance as especially vulnerable to the unfolding global Bubble collapse. Waning confidence in the region’s financial stability would portend acute currency market instability. China’s currency is especially vulnerable to capital flight and the imposition of draconian capital controls. The big unknown is how much “hot money” and leverage has accumulated in Chinese markets. The Indonesia rupiah remains vulnerable to tightening global finance. I worry about India’s banking system after years of Bubble excess. I have concerns for the region’s financial institutions generally. The stability of the perceived stable Hong Kong and Singapore dollars is on the list of Issues 2019.

Fragile Asian finance has company. Italian banks sank 30% in 2018, slightly outperforming the 28% drop in European bank shares (STOXX 600). Italy’s 10-year yields traded to 3.72% in late-November, before ending 2018 at 2.74% (up 73bps in ’18). Italian – hence European – stability is an Issue 2019.

I believe a problematic crisis is likely to unfold in 2019, perhaps sparked by dislocation in Italian debt markets and the resulting crisis of confidence in Italy’s fragile banking system. Serious de-risking/deleveraging in Italian debt would surely see contagion in the vulnerable European periphery – including Greece, Spain and Portugal. Italy’s Target2 balances (liabilities to other eurozone central banks) almost reached $500 billion in 2018. Heightened social and political instability would appear a major Issue 2019, not coincidental with the end of ECB liquidity-creating operations. Draghi had kicked the can down the road. Markets, economies, politicians and protestors have about reached the can.

A crisis of confidence in Europe would ensure problematic currency market instability. Such a scenario would portent difficulties for vulnerable “developing” Eastern European markets and economies. Many economies would appear vulnerable to being locked out of global financing markets. A full-fledged financial crisis engulfing Turkey cannot be ruled out. Last year saw significant currency weakness also in the Russian ruble, Iceland krona, Hungarian forint and Polish zloty. I would see 2018 difficulties as a harbinger of much greater challenges ahead.

Bubbles are mechanism of wealth redistribution and destruction. This reality has been at the foundation of my ongoing deep worries for the consequences of history’s greatest global Bubble. We’ve witnessed the social angst, a deeply divided country and waning confidence in U.S. institutions following the collapse of the mortgage finance Bubble. I fear that the Bubble over the past decade has greatly increased the likelihood of geopolitical tensions and conflict. Aspects of this risk began to manifest in 2018, as fissures developed in the global Bubble. Geopolitical conflict is a critical Issue 2019. Trade relations are clearly front and center. Going forward, I don’t believe we can disregard escalating risks of military confrontation.

Bubbles inflate many things, including expectations. I worry that the protracted Chinese Bubble has so inflated expectations throughout China’s large population. With serious cracks in their Bubble, Beijing will continue to craft a strategy of casting blame on the U.S. (and the “west”). The administration’s hard line creates a convenient narrative: Trump and the U.S. are trying to hold back China’s advancement and ascendency to global superpower status. A faltering Bubble and deteriorating situation in China present Chinese leadership a not inconvenient time to confront the hostile U.S. The South China Sea and Taiwan could loom large as surprise flashpoint Issues 2019.

There are a number of potential geopolitical flashpoints. Without delving into detail, I would say generally that geopolitical risks will continue to rise rapidly in the post-Bubble backdrop. Issues easily disregarded during the Bubble expansion (i.e. the Middle East, Russia, Ukraine, Iran, etc.) may in total become more pressing Issues 2019. I can see a scenario where the U.S. is spending significantly more on national defense in the not too distant future.

“Chairman Powell ‘very worried’ about massive debt” was an early-2019 headline. I believe the U.S. Treasury market in 2018 hinted at a momentous change in Market Dynamics. And while a bout of “risk off” and a powerful short squeeze fueled a big year-end rally, there were times when the Treasury market’s traditional safe haven appeal seemed to have lost some luster. The unfolding bursting Bubble predicament turns even more problematic if ever Treasury yields rise concurrently with faltering risk markets. Such a scenario seemed more realistic in 2018. With huge and expanding deficits as far as the eye can see, the suspect dollar and mounting geopolitical tensions, the potential for a disorderly rise in Treasury yields is a potential surprise Issue 2019.

Whether Treasury yields surprise on the upside or fall further in an unfolding crisis backdrop, U.S. corporate Credit is a pressing Issue 2019. Thursday (Jan. 10) ended a 40-day drought in junk bond issuance (longest stretch since at least 1995). Both high-yield and investment-grade funds suffered major redemptions in late-2018, exposing how abruptly financial conditions can tighten throughout corporate finance. Fueling liquidity abundance throughout the boom, ETF flows were exposed as a critical market risk.

Flows for years have been dominated by trend-following and performance-chasing strategies on the upside. The reversal of bullish speculative flows was joined in late-2018 by speculative shorting and hedging-related selling. Liquidity abundance abruptly transformed into unmanageable selling pressure and acute illiquidity. Pernicious Market Structure was revealed and, outside of short squeezes and fleeting bouts of optimism, I believe putting the ETF humpty dumpty back together will prove difficult. The misperception of ETF “moneyness” is being cracked wide open.

Enormous leverage has accumulated throughout corporate Credit over the past decade. This portends negative surprises and challenges in the unfolding backdrop. At this point, I’ll assume some type of trade agreement is cobbled together with the Chinese. This might provide near-term support for the markets and global economy. But I don’t believe a trade agreement would fundamentally change the backdrop of faltering global financial and economic Bubbles.

Expect ongoing global pressure on leveraged speculation. As an industry, the hedge funds did not experience huge redemptions in 2018. I expect redemptions and fund closures to be a significant issue following the next bout of serious de-risking/deleveraging. A similar dynamic should be expected for the ETF complex. Late-2018 outflows were likely just a warmup for the type of destabilizing flows possible in a panic environment.

In my view, an important interplay evolved during this protracted cycle between the ETF complex and a booming derivatives marketplace. Reliable inflows and abundant liquidity in the ETF universe created an advantageous backdrop for structuring and trading various derivatives strategies. This seemingly symbiotic relationship has run its course. The now highly uncertain ETF flow backdrop translates into a potentially problematic liquidity dynamic for derivative-related trading. ETF outflows pose risk to derivatives strategies, while a derivatives-induced market dislocation risks destroying investor faith in the liquidity and safety of ETF passive “investing.”

The possibility of a 1987-style “portfolio insurance” debacle except on a grander – global, multi-asset class – scale is an Issue 2019. The U.S. economy has vulnerabilities. Yet Unsound Finance is a predominant Issue 2019. Outside of possible dreadful geopolitical developments, I would argue that the key major risk for 2019 is the seizing up of global markets. Unprecedented amounts of risks have accumulated across markets around the globe. Consider a particularly problematic scenario: a major de-risking/deleveraging episode sparks upheaval and illiquidity across currencies, equities and fixed-income markets. Such a scenario might incite a crisis of confidence in major global financial institutions, including derivatives markets and counterparties. Central bankers better not disappoint.

Last week’s dovish turn by Chairman Powell broke the bearish spell and reversed markets higher, though this came weeks late in the eyes of most market participants. “We know that long periods of suppressed volatility can lead to the build-up of risks and to a disruptive ending, and the idea that monetary policy can ignore that and leave it to macroprudential tools just is not credible to me.” This prescient comment (released Friday) is extracted from 2013 Federal Reserve transcripts. Governor Powell at the time clearly had a firmer grasp of the risks associated with QE than chairman Bernanke and future chair Yellen.

It is my long-held view that the Fed (and the other major central banks) will see no alternative than to resort to QE when global markets “seize up.” Ten-year Treasury yields at 2.70%, German bund yields at 22 bps and JGBs at zero don’t seem inconsistent with this view. It’s been a decade (or three) of Monetary Disorder. Now come the consequences, commencing with acute market and price instability. I believe this instability will end in a serious and prolonged crisis. There will be policy interventions, of course. But it will become increasingly clear that flawed monetary doctrine and policies are more the problem than the solution. In an increasingly acrimonious world, how closely will policymakers coordinate crisis responses? Will central bankers stick with “whatever it takes”? How quickly will they react to the markets – and with how much firepower? Uncertainty associated with monetary policymaking in a global crisis environment is an Issue 2019.

http://creditbubblebulletin.blogspot.com/2019/01/market-commentary-issues-2019.html

Goose Eggs

Eric Cinnamond writes while many small cap stocks are down meaningfully from their highs, I believe valuations, on average, remain elevated. Nevertheless, given it’s been so difficult to find value for so long, it’s understandable to want to research and possibly buy a beaten-down stock. For absolute return investors diving in and searching for new ideas, happy hunting! Just watch those balance sheets. Financially distressed businesses and potential goose eggs can be devastating to performance and full-cycle absolute returns.

Higher debt levels can be seen from a bottom-up and top-down perspective. From a top-down perspective, most aggregate measurements of corporate debt are elevated. For example, the median net debt/EBITDA of the Russell 2000 is currently 3.2x versus 0.9x in July 2007 (the last market cycle peak).

http://www.ericcinnamond.com/

Early Tremors, Not Market Bottoms

In the past two months, the more traditional indicators of conventional market analysis have confirmed what complexity indicators (‘EWS’) had indicated all along: (i) multi-year breakdowns in trend-lines for major equities, bond and real estate markets; (ii) sharp tightening in financial conditions and inverted US rate curves; (iii) sudden gaps in equity multiples, typical during recessions; (iv) high yield bonds and leveraged loans breaking down, together with frozen capital markets; (v) weakening economic activity indicators from China to Europe to now the US; (vi) together with Apple and Samsung opening the season of supposedly-shocking profit warnings with fanfare.

http://www.fasanara.com/outlook-11012019

Crescat Capital – (The hedge Fund which is up 40% in 2018)-Investment outlook

Crescat Capital writes….Our macro model is telling us that the bull market has finally topped out for this cycle and that the economy will soon follow. The central bank liquidity tide is going out while equities, fixed income, real estate, and illiquid private assets have all recently reached historic high valuations. We strongly believe there is still ample opportunity to capitalize on the everything bubble meltdown in 2019 through select short positions and “proper” defensive longs. The extreme macro imbalances have only just begun to unwind based on:

  • Record global leverage compared to GDP;
  • Only-recent record US equity valuations across eight comprehensive measures;
  • Recent record financial asset valuations relative to GDP in the US;
  • A record currency and credit bubble in China;
  • Historic housing bubbles in Canada and Australia;
  • Record cheap valuations for precious metals and related mining stocks;
  • The second longest economic expansion and second longest bull market in US history;
  • Recently historic US market-top indicator levels on Crescat’s 16-factor macro model; and
  • Lack of widely recognized global recession with corresponding low equity market valuations, investor despondency, and capitulation necessary to signal a cyclical market bottom.
  • Read More https://www.crescat.net/crescat-capital-quarterly-investor-letter-q4-2018/

Could Oil End the Global Super Cycle?

We know a few things about oil in the coming years:

1) Investment is down significantly

2) We are finding less oil than we have in 75 years

3) Shale loses money

4) Shale depends on investors willing to fund the losses

5) Shale depends on low interest rates

6) About half of US production is shale & the US is the world’s largest producer

7) We need more oil just to meet growing demand and old wells dying

http://www.pineconemacro.com/uploads/2/8/3/3/28331049/pinecone_macro_special_report_-_oil_and_the_super_cycle.pdf

Bear Trap?

Sven Henrik at Northman Trader writes some of the most fascinating weekend commentary on the market ..He writes “Are markets setting up for a major bear trap? Let’s explore the question. Look, I could show you a 100 charts that say the same thing that everybody already knows: Things are terrible. From crude crashing 7 weeks in a row, $FAANGS dropping a trillion bucks in market cap and individual stocks getting taken out back and shot. Crypto is a wasteland. Global growth is continuing to slow down hard (Germany just printed its lowest GDP growth in nearly 4 years) and US growth is heading back to a 2% regime. Bulls that were aggressively pushing for ever higher targets are sheepishly reducing them fast. One analyst dropped his 3,200 year end target on $SPX to 2,900, another dropped his 2018 Bitcoin target from $25K to $15K (it’s trading at $3,700 this weekend) and downgrades are permeating the daily news cycle. Long gone is the talk of global synchronized growth that dominated the headlines earlier in the year”.

read full commentary https://northmantrader.com/2018/11/25/weekly-market-brief-bear-trap/