Banks and the Digital Dollar- Pivot Analytics

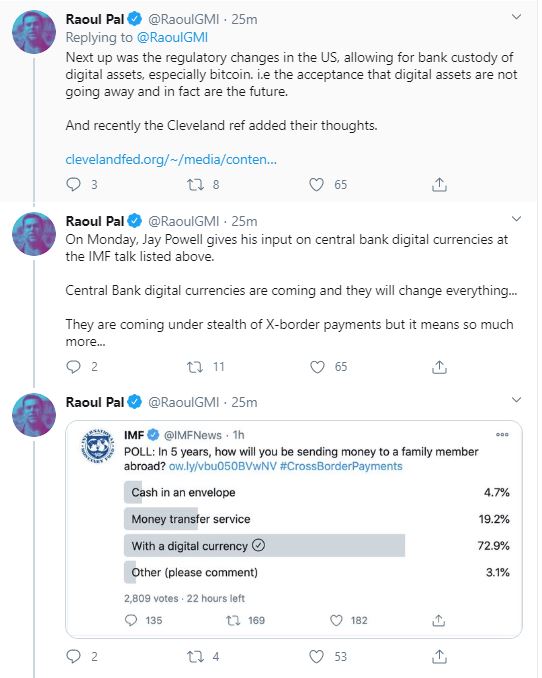
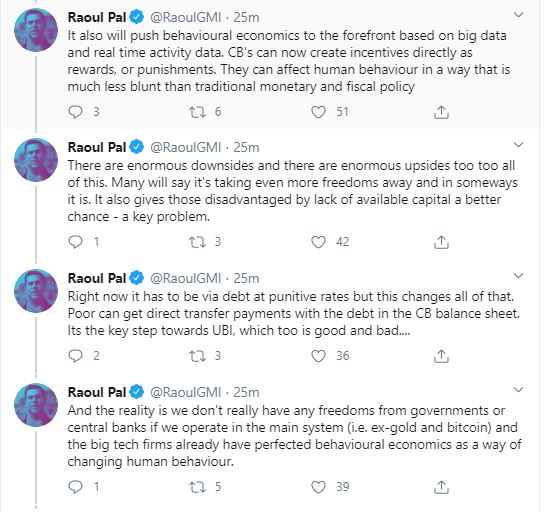
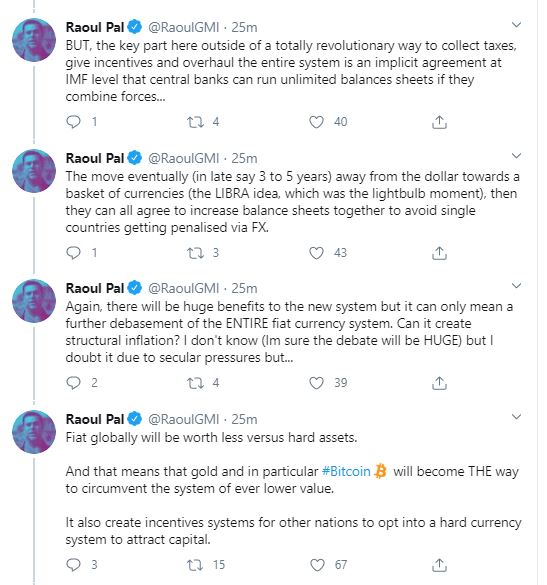
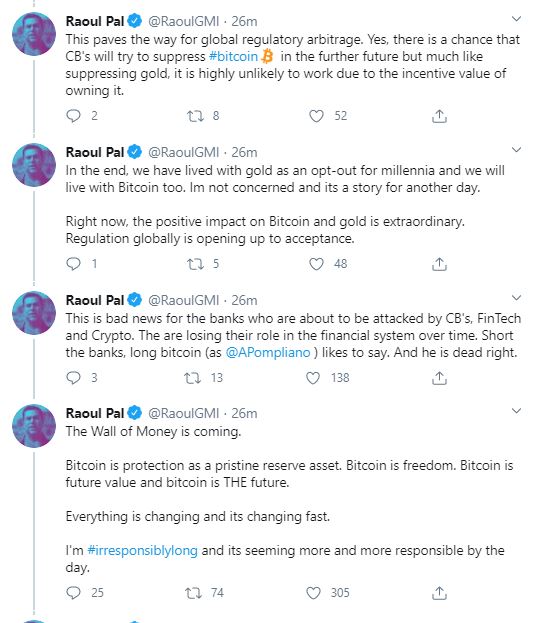
Paper money is going away in the very near future.  Sooner than you realize, paper money will be replaced by a “digital-USD”.  Money is already digital.  Your bank and brokerage accounts are book entries in a digital database.  These book entries are claims that can be exchanged for paper money or paper stock certificates.  Governments, including the US government, will be mandating the exchange of all paper money for its digital “upgrade.”  Why and when will this happen?  More importantly, what implications does it have for investing?

Regarding the when, its going to happen soon, very soon.  Within 7 or 10 years, paper money will be history and not legal tender anymore.  China is already testing a digital RMB, so our leading nation is well behind its competitor, and once China rolls out its digital RMB in 2023, our government will spearhead the rollout of our USD version.  In reality, China is already fully digital.  Nobody in China uses cash anymore, and credit cards are a very small piece of their market.  Chinese people use Alipay and other digital payment mechanisms on their phones.  Americans say “that can’t happen here, we value our privacy.”  That’s ridiculous.  If you buy with a debit or credit card, your grocery store knows when you buy broccoli and they know your brand of ice cream.  If you have a smartphone, your phone company knows where you are at all times, and, yes, they sell that location data to hundreds of companies who pay for it.   This location data is stripped of identifying records, rendering the data “blind” and “safe.”  Most people inherently understand this, but what they don’t know is that basic algorithms can then figure out exactly who you are even based on this blind data.  My friends at MIT get “blind” mobile phone data, merge it with other databases, and after they run it through algorithms, they know mostly everything about you, including your locations.   In 2020, if you used a smartphone and a credit card, “they” know everything about you.  In fact, most Americans choose to have very little privacy at all.  Google knows when you are at your girlfriend’s house, they know what gifts you buy her and most of your favorite topics.  This makes the digital dollar an easy sell for the government.  Try taking away free gmail, smartphones and credit cards and see the voters scream – people don’t want privacy. 

Later this decade, once the digital dollar is in place, the government can finally implement policy more effectively.  For example, right now, the main way that the government “prints money” is to buy bonds in the open market and hope that banks will lend the money.  The lent money is the increase in the money supply.  This system has contributed to the wealth gap, and it has also led to a lot of leverage in the system.  Furthermore, the Fed has tried to spur inflation with no luck.  Why?  The Fed really can’t make the banks lend under the current system.  The digital dollar can cure some of these issues because the government, if its smart, will retain the right to manufacture digital dollars, thus bypassing the banks.  The Feds are sick of trying to make the banks lend then regulating them because they are over-levered.  It’s a faulty system and it is likely to be replaced by digitally created money supply which can then be sent out to the people directly.  This will enable universal basic income (UBI) models to proliferate, and it will finally be easy enough for the government to make inflation go higher when they want. 

It will also wreak havoc on the underground economy, specifically drugs and tax evasion.  With the digital dollar, everything will be traced and tax evasion will drop substantially.  Giving the government more power over the money supply (disintermediating the banks) will eventually be very inflationary.  It could also be negative for the dollar exchange rate, but ultimately all governments will go this way so the FX rate implications are unclear at this juncture.  What is likely is that an aging workforce will get UBI payments in an inflation-first environment.  The government will try to inflate away the massive debt obligations, and they are likely to be successful.  In 10 or 15 years, we will see massive inflation on the order of the 1970s or even worse.  The Fed is on record saying they want inflation, and the politicians and public are addicted to the stimulus, so its print print print until we finally get sustained inflation.

How can one position themselves in this environment?  Think about purchasing multi-unit apartments with long-term fixed rate debt.  Getting a 25 year fixed rate mortgage in the year 2025 is going to be the safe way to short bonds in the inflationary environment.  Note that 2025 is a number of years away, and you will want to structure these purchases before the digital dollar is in place.   It doesn’t really look like we will get the runaway inflation now, so there are a few years prior to the inflationary spiral.

If you don’t want to own real estate, then consider buying medium-P/E equities.  In today’s market, the best stocks have the highest P/Es because they are the best companies and distant profits are discounted back at very low rates, making these high P/E stocks beneficiaries of the low rate environment.  When really-high inflation hits around 2030, these high P/Es are likely to be cut in half as interest rates spike upward.  You want to still pay up for some quality, but market-average valuations should suffice.  As always, stay away from the really “cheap” stocks unless you have done a ton of homework on each situation.

Finally, be wary of investing in traditional banking models.  Right now all bank stocks are very cheap on both earnings and tangible book values.  Banks are under siege from fintech solutions.  The fintechs are fee-based and are slowly disintermediating the banks turf.  Its safe and easy to have an online account, you don’t need a bank branch anymore.  Branches are quickly becoming an anachronistic cost-hurdle that disadvantage traditional banks vs. fintechs.  Even worse, fractional reserve banking is a terrible business model.  Imagine a 0.7% or 1% ROA, then you have to lever up 10x to get a reasonable ROE.  Of course, at 10x leverage, a 10% drop in collateral value mostly wipes you out.  The next round of inflation, late in the decade or in the early 2030s, will basically wipe out all the banks.  I predict the end of fractional reserve banking in its current form.  If the government retains the right to print and distribute digital dollars, banks in the fractional reserve system won’t be as necessary.   Its quite possible the next bank debacle will be significantly worse than 2008, so be wary of investing in banks later in the decade.  Right now, bank investors are waiting for higher interest rates, which could add to profitability.  Unfortunately, if rates really were to rise a significant amount, property values (collateral values) would fall, wiping out huge portions of bank equity – bank investors should be careful of what they wish for.  In my view, bank investing is difficult if rates stay low and also difficult if rates rise.  Keep time horizons shorter-to-medium term in any bank investments – don’t give the stocks more than a year to work.

Semiconductors Are the Closest Thing to Magic In the Modern World- Gavin Baker

The turmoil in technology stocks continues. Since early September, the Nasdaq 100 has corrected almost 13%. Heavyweights like Apple, Amazon and Facebook lost around 18%.

Gavin Baker knows how to keep a cool head in difficult situations like these. The founder of the US investment firm Atreides Management has been investing in technology companies for twenty years and ranks amongst the most renowned investors in the sector.

His core strengths include investments in semiconductor stocks like Nvidia, Intel or Micron Technology. «In the past, the semiconductor industry has gone through three negative demand shocks. Now, we have a positive demand shock in the form of artificial intelligence,» says Mr. Baker during an interview via Zoom from his company headquarters in Boston.

In this in-depth interview with The Market/NZZ, Mr. Baker explains what it takes to be a successful investor, why semiconductors become ever more important for the global economy and what the tech war between the US and China means for the industry. He also explains why he wouldn’t write off Intel despite recent production issues with its next-gen processors.

Mr. Baker, after the phenomenal run since the lows of March, technology stocks are experiencing some weakness. What’s your take on the current market environment as a veteran tech investor?

For the last forty years, technology has consistently been the most alpha-rich sector. This means there are always a lot of opportunities. Because of the pandemic, many technology companies were certainly accelerated this year. In many ways, Covid has pulled the world into the years between 2025 to 2030 which has resulted in some pretty spectacular moves for some stocks. But now, a lot of these stocks are at valuations that are historically quite extreme – and valuation actually always does matter. On the other hand, a lot of the big names that are driving the market are trading at less than 30x earnings. In the context of ten-year interest rates under 1% that’s not an aggressive multiple.

How can investors navigate today’s challenging environment?

To succeed as an investor, you have to be able to deal in paradoxes. You have to find the right balance between conviction and flexibility, between arrogance and humility: The arrogance to believe you can have a differentiated view on a stock in such a competitive market, and the humility to recognize that you could be wrong. As a technology investor in particular, you have to balance imagination with reality. You have to find the right balance between enthusiasm and dispassion. You also have to be very knowledgeable. What’s more, tech and consumer have kind of merged as a sector. For example, how can you look at Amazon and not study Walmart? How can you look at Airbnb and not be intimately familiar with Marriott and Hilton? All these businesses are merging in profound and important ways, and the lines between tech and consumer are blurring.

What does this mean for future investment returns in tech stocks?

It is a very interesting time in technology. Truth, valuation, interest rates and probability are gravitational forces for stocks. But trends in Free Cash Flow and Return on Invested Capital are quantum forces. One of the most fascinating things is that in the past, ROICs were highly mean reverting: Companies with high returns would generally see those returns mean revert over time. That stopped being true roughly fifteen years ago. Since then, high ROIC companies are maintaining those returns and they are showing no sign of falling.

How come?

I think it’s because of technology. Traditionally, we used to think about a natural monopoly of being a business with high fixed costs and extremely low variable costs. That’s why it makes sense to have only one cable, pipeline or railroad system because the costs of building these networks are so high. But today, a lot of these mega cap technology companies are natural monopolies of an entirely new kind the world has never seen – and that means they are much tougher to compete with.

Why are these companies a new kind of monopoly?

If you’re willing to spend enough capital, you can recreate the railroad systems in America with $500 billion. With a lot of money, you can also build a new cable system or a new electric or gas utility network. FedEx and UPS have shown us that you can recreate the postal system. But you actually cannot spend any amount of money and create a search engine that is better than the world’s dominant search engine today. People have tried: Amazon had an internal effort to build a search engine, and they concluded it was impossible. Microsoft has worked at Bing for many years and never really gained market share. The reason is that with any product where the quality is driven by artificial intelligence, it’s almost impossible to compete with the market leader.

What’s the reason for that?

To improve the quality of AI, you have to increase the amount of data you use to train the model. In essence, if you train an algorithm with 10x the data, the quality of the algorithm doubles. So you get these feedback loops: If you have a great product like a search engine, more people use it, you get more data, the product gets better, even more people use it and so forth. That fly wheel just spins and this is why it’s hard to replicate Google. It’s a game of cumulative knowledge and data. The primacy of data for AI quality means that some of these companies are truly unique because their competitive advantage is not just growing every year, it’s literally growing every second. Those are great dynamics for investors, but for society they create very difficult trade-offs: How do you regulate these monopolies? Do you regulate them in such a way that the product gets worse?

How does this impact a sector like semiconductors which propel artificial intelligence and the digital transformation of the world in general?

In the past, the semiconductor industry has gone through three negative demand shocks. Around eighteen years ago, the world’s most powerful computers were not utilized most of the time, meaning a lot of memory and microprocessor capacity was sitting idle. So the first negative shock was virtualization which helped to utilize servers much more efficiently. The next shock, at the beginning, was cloud computing because it increased the utilization of servers even further and decreased the importance of client devices like laptops. Strangely enough, the iPhone and smartphones in general were the third negative shock. That’s because they slowed down the growth of the PC market, and PCs are a lot more semiconductor intensive than smartphones in dollar terms. As semiconductors had to go through these three negative demand shocks, the whole industry, the whole supply chain, consolidated. As a result, you have one or two dominant companies in almost each area of semiconductors today.

So what’s next for the chip industry?

Now, we have a positive demand shock in the form of artificial intelligence. Sure, PCs have leveled out, smartphones are slowly additive, the electronic content of cars is growing and so is the internet of things. But AI, because data quantity is so important for quality, is much more semiconductor intensive. For me, a light bulb went off when I read this article in «Wired» about how Google’s engineers started to deploy voice recognition based on AI to Android smartphones. They realized that if each Android phone used Google’s voice search for just three minutes a day, Google would need to build twice as many data centers. What that means is that AI is so incredibly computation intensive that it led Google to develop its own chip called the Tensor Processing Unit or TPU. It’s kind of a graphics processor competitor and it saved Google from building a dozen new data centers.

How will AI translate into demand for semiconductors in general?

AI as a demand driver is just getting going. When humans write software, they understand that we want to limit the amount of computational resources. They write software in very elegant ways to minimize compute and memory. Artificial intelligence is none of that. AI is all about semiconductor brute force. Marc Andreessen wrote this famous op-ed article called «Why Software Is Eating The World». But if you were to rewrite it, you would say AI is eating the world. And, as AI eats the world, software not only becomes more important to every industry, but also more and more of that software is going to be created by artificial intelligence and not humans. That’s why one of my beliefs is that in fifty years, it will be illegal for humans to write software. It will be too important to be trusted to a human being. That means that naturally, the semiconductor intensity of global GDP will rise significantly as AI rises, and it’s happening against the backdrop of a very consolidated industry.

Exhibit A of this ongoing consolidation is Nvidia’s $40 billion Arm deal. What’s your interpretation of the largest semiconductor acquisition in history if approved?

Remarkably, Nvidia is basically paying the same price that SoftBank acquired Arm for four years ago, net of the earnout. The larger take away from this deal is the importance of software: Semiconductor companies themselves are writing a lot of software to enable AI algorithms to run on their chips. Specifically, in the data center you need to take a more holistic ecosystem approach. You’ve had that for Intel’s x86 architecture, but not with Arm. So one axis of the deal is creating a software ecosystem in the data center space for Arm. The other axis is embedding Nvidia’s graphics chips and Tensor cores IP with Arm and pushing that model out to the edge and to places where it makes sense for their chips.

In other words: This mega deal further cements Nvidia’s dominant status as the global leader for graphics processing units or GPUs?

The industry has certainly consolidated, but we will see what happens. Somebody once joked that Jensen Huang, the CEO of Nvidia, had single handedly brought back semiconductor venture capital because of the company’s success in the data center space. Most of the world’s deep learning runs on GPUs, and most of these GPUs are made by Nvidia. But over the last five years, billions of dollars have gone into semiconductor venture capital. In contrast to that, there was almost no venture activity in semiconductors until deep learning really took off. So at the same time as the industry has consolidated, you have a lot of new venture funded, innovative competitors like Cerebras or Mythic coming for different corners of the semiconductor industry and for Nvidia in particular.

Semiconductor stocks like Nvidia have yielded astonishing returns over the last decade. How hard is it to find attractive investment opportunities in the chip sector at these valuations?

There is a lot of dispersion. Nvidia is an expensive stock today, but other areas of the semiconductor industry are quite cheap. GPUs are very important for artificial intelligence, but so is memory. In fact, AI uses six times more memory computing power than software written by human beings. So memory chips are an interesting subsector of semiconductors today, and it’s heavily consolidated. It is a cyclical industry, and it’s slowly becoming less cyclical.

And what about analog chips? With the merger between Analog Devices and Maxim Integrated we’re seeing attempts for further consolidation in this subsector as well.

The analog space is really attractive. It’s an incredible long-term compounder, and the industry is already very consolidated. A lot of people used to make the mistake of thinking that we wouldn’t need analog chips in a digital world. That is not true at all because the world is analog, and taking analog information – light, sound and power – and helping to translate those signals into digital streams of 1s and 0s and manage them is super important. I often say semiconductors are the closest thing to magic in the modern world. Analog is like the black magic because there are only a small number of people in the world today who can design these analog chips. It’s trial and error, it takes a very long time, and it’s almost as much of an art as it is a science.

When it comes to developing leading-edge chips, semiconductor companies have to take bold and costly bets. How do you cope with these risks as an investor?

You watch them very carefully. It’s incredible what’s going on: Another part of magic are these leading-edge process nodes where Taiwan Semiconductor Manufacturing, Intel, Nvidia, Xilinx, Samsung and Micron are playing. It’s almost like they are developing recipes: Mainly, they are all using the same machines from Lam Research and ASML, and they are putting them together in slightly different ways, using slightly different materials on each layer, or they have slightly different transistors. So they are making these huge ten, twenty billion dollar bets on the right recipe. That’s because you have a big advantage if you get to a node first since you can optimize that node and learn and then apply those learnings for getting to the next node first.

Those giant bets can also go wrong as we just witnessed in the case of Intel.

Intel guessed correctly for the last forty years, and then they guessed wrongly. They probably inserted extreme ultraviolet lithography too late. That resulted in them losing process leadership to Taiwan Semi. This is one of the highest stakes games being played in the world today: In the logic space between Taiwan Semi, Intel and to some extent Samsung. Even in the processor design space Intel, AMD and Nvidia are making giant two, three, four billion-dollar bets on designing a processor, making it work on a manufacturing process. They have to continuously guess right.

For the first time ever, Intel has lost its technological leadership to Taiwan Semi. Is this the end of an era in the semiconductor industry?

The media loves narratives, big turning points and headlines like “The End of an Era”. It’s certainly possible, but Intel is a great and proud company. They have a lot of brilliant engineers, and they are one of the most important national assets for the United States. Today, the leading-edge semiconductor fabrication plants are in America, there are two Intel fabs in Israel, and then there are fabs in South Korea and Taiwan – that’s it! So as an American, I hope that’s not the end of an era for Intel. I would not be as quick to count them out, but for sure they have their work cut out for them. They were always ahead, and now they are behind. That’s a position that is new to them.

Against that backdrop: What are the implications of the rising tensions between the US and China for semiconductor investors?

If Intel falls further behind and leading-edge semiconductor manufacturing becomes concentrated in Taiwan then Taiwan will become geopolitically important in a way that the Middle East never was. Modern semiconductor manufacturing is at least as important to the economy as oil was in the 1970s. But in the case of oil, at least it was available all over the world albeit at higher prices than in the Middle East. Imagine a world where oil only came from one country, and how important that country would have been for the last hundred years. That is what the world would look like if Intel cannot find its footing and continue to manufacture chips at the leading-edge here in America. Taiwan could become by far the most geopolitically important country in the history of the world.

In accordance with the latest US sanctions, most chip suppliers have suspended dealings with China’s tech giant Huawei. How much of a concern is the tech war when it comes to investments in technology?

It does feel like the US and China are beginning to de-couple somewhat. A lot of companies have been moving manufacturing out of China. But outside of some of the obvious impacts, there is not much to say beyond this: If Huawei isn’t able to sell base stations and phones in much of the world because of US policy and if Huawei is unable to acquire the parts and components it needs to make phones even in China, then there are going to be a lot of winners and losers. But in general, I would just say that the current US industrial policy is very strange.

What do you mean by that?

Essentially, the US is saying to China: We are not going to sell you these semiconductors, but we are going to sell you all the equipment you need to make your own semiconductors. This means that in several years it may be irrelevant. In some ways, the entire global economy rests on a couple of relatively small American, Japanese and European semiconductor capital equipment manufacturers; whether it’s Lam Research, KLA-Tencor, ASML or Tokyo Electron or a couple of American electronic design automation companies with Cadence and Synopsys. Without those companies, you cannot build a semiconductor. In a metaphorical sense, it’s almost like current industrial US policy is saying to China: Airplanes are important. We are not going to sell you airplanes anymore, but we are going to teach you how to make your own airplanes. It’s very strange. If our goal is to limit China’s access to these advanced technologies, the US is doing the exact opposite of what would be logical.

What are you doing differently?

A lot of capital allocators like to ask me about the concept of edge. To me, an edge means a repeatable process that drives alpha. But I don’t believe in edge. I think it’s a fairy tale. The world is too competitive. Going back to AI, investing is where chess was in 1996, when there was an enormous race between human grandmasters and algorithms, and Deep Blue started to beat Garry Kasparov by using brute compute force. Today, that’s why value strategies have stopped working: Value investors used to have an edge. They were very quantitative. Maybe, they had a strong stomach and were willing to buy companies because they were cheap no matter how bad it sounded. But the problem is that anything that can be put in a spreadsheet will no longer generate alpha because it has been arbitraged away by quant investors. There is so much quantitative money chasing those same metrics.

So how do you try to generate alpha for your clients?

To me, all alpha comes from insights. An insight is kind of a differentiated long-term viewpoint about a stock. It’s a differentiated view about the long-term state of the world. Often, these insights are very simple, and a lot of them are right brain: imaginative, being slightly better in seeing the future states of the world. These insights need to be grounded and tested in reality regularly. Also, it pays to boil them down to just a few variables. Like Occam’s razor, the injunction not to make more assumptions than you absolutely need, simple is beautiful when it comes to investing. With electric vehicles for instance, all that matters is efficiency: battery capacity and range to get miles per kWh. You want to focus on the variables that are important instead of the variables that are interesting. So what I spent the most time on is focusing on competitive advantage, because in tech competitive advantage is never static. If you’re not growing your competitive advantage in technology, it is probably shrinking.

https://themarket.ch/interview/semiconductors-are-the-closest-thing-to-magic-in-the-modern-world-ld.2719

The Road Ahead- KKR

By HENRY H. MCVEY Oct 01, 2020

The Road Ahead

In recent weeks we have received a slew of requests for more insights about China’s changing role in the global economy, including its relationship with the United States, as well as the Federal Reserve’s ‘new’ shift towards average inflation targeting (AIT). Without question, both topics are important ones that reflect the increasing complexity of the current global macro environment. In our humble opinion, the U.S.–China relationship is likely to intensify further in the coming months, particularly ahead of the U.S. presidential election in November. However, given China’s importance to the global economy’s growth trajectory, we think there is still a significant benefit to investors who can thoughtfully deploy capital throughout Asia by leveraging an investment approach that is both local and global in nature. Meanwhile, we view the Federal Reserve’s new framework as a milestone announcement. In fact, AIT is likely the biggest shift in U.S. monetary policy since the introduction of quantitative easing (QE) at the end of the Global Financial Crisis. Not surprisingly, these two weighty topics — U.S.-China relations and the Fed’s recent shift in strategy — have significant long-term implications for all professionals of macro and asset allocation. Our base view at KKR is that inflation and rates stay low, and as such, we should heighten our focus on growth companies, yield, and collateral-based cash flowing stories. However, given that many central banks are now experimenting with helicopter money via direct deposits and looser inflation standards, we have also boosted our allocation to key markets such as Infrastructure, Asset-Based Finance, Gold, and parts of Real Estate.

“ There is a road, no simple highway, between the dawn and the dark of night ”

Grateful Dead American rock band

As summer winds down and autumn sets in, we typically welcome the onset of the ‘back to school’ season, which usually coincides with the end of summer vacation and the re-establishment of more formal routines. Yet, as we all know, that is not how we are going to remember the fall of 2020, given the challenges surrounding school re-openings, social distancing measures, and the troubling reality that at the end of August coronavirus cases surpassed the 25 million mark, which is more than a four-fold increase since just the beginning of June 2020.

At this point, we do take some comfort that medical professionals have learned more ways to manage the disease. That said, the overall case load in the U.S. remains quite high heading into the fall. Meanwhile, in Europe and Asia – after a fairly benign summer – cases have worryingly begun to tick up again in certain countries. Exacerbating all of this uncertainty is a fast-approaching and divisive election season in the United States and rising global tensions with China. These headwinds are offset by aggressive action by central banks, a sizeable slate of government transfer programs, and seemingly significant progress in the development of vaccines.

From our perch at KKR, we continue to balance the human tragedy associated with this disease, including sickness, death, job loss, and racial/social inequalities with our fiduciary responsibility to our limited partners to perform as investors on their behalf. This balance is certainly a complicated one, but as KKR’s founders Henry Kravis and George Roberts have been constantly telling us throughout the pandemic: If there was ever a time for us to intensify our efforts to “do well while doing good,” now is that time. To this end, we have tried to be present, engaged and to keep the channels of communication open with our investment teams, clients and our companies.

At the moment, there are two major issues that seem to dominate almost every “top down” discussion we have been having in recent weeks. They are as follows:

  1. Both real and nominal yields are collapsing amidst a significant change in Fed policy. What does this mean for risk assets as well as the U.S. dollar? Our base view is that, unlike the aftermath of the 2008 crisis, the U.S. – not China – is the most aggressive player when it comes to stimulus. All told, we estimate that, of the total $25 trillion in global stimulus flooding the system, the U.S. portion accounts for nearly 40%. Even with all this stimulus, the U.S. unemployment rate is still essentially on par with the Global Financial Crisis at its peak. Moreover, the burdens of unemployment are disproportionately harming low income and minority workers, which we think weighs heavily on the Fed as it thinks about its mandate. Importantly, this unsettled unemployment picture is happening at a time when there has been a landmark shift in the Fed’s focus towards a “flexible form of average inflation targeting.” As a result, real interest rates in the United States have collapsed to record low levels in absolute terms, while the relative level of real rates in the U.S. is now on par with or even below its global peers in many instances. The implications of these moves are significant, we believe. For starters, we think we are now transitioning away from a multi-year U.S. dollar bull market towards a more challenging period for the greenback. If we are right, then that backdrop could be a net positive for risk assets, particularly those linked to nominal GDP growth and upfront cash flow. Emerging Markets as an asset class could perform better, as currency typically accounts for nearly one percent of total EM returns in the public markets. The macro landscape we envision also means that — within Equities, both Private and Public — secular cash flow compounding stories are likely to remain in high demand, and as such, we look for valuations to remain stable or potentially even to expand in today’s low rate environment. However, the more dovish environment we are describing does come with some important caveats. Specifically, Chairman Powell also made it known that the Federal Reserve will use additional tools, including less QE and more regulation of the financial services industry, to ward off any financial instability that will “impede the stability of our goals” of maximum employment and price stability. So, while the monetary backdrop is still quite favorable, this warning represents a change in tone that could – at times – weigh on risk premiums well into 2021. Further details below.
  2. Is China still an investable growth story? Our work shows that China and its trading partners are still the ‘swing factor’ in global growth. All told, we still expect China to account for one third or more of global growth over the next few years, and when coupled with its immediate trading partners, this pact of Asian EM countries could account for nearly two thirds of incremental global growth. However, geopolitical tensions between China and the U.S. as well as other nations (Australia, India, and some in the EU) are escalating sharply, and we stick to our call that we are at a major inflection point for U.S.-China relations. To this end, we detail how we see not only well-established global supply chains beginning to alter their footprints in China but also what it means for regional growth trends. We also delve into declining future intentions by global multinationals to spend on both investment and research and development. Importantly, though, China is not sitting idle. In fact, China is responding to these changes in corporate behavior using a variety of techniques, including becoming a larger and more powerful domestic economy that relies on its own production (what President Xi Jinping calls “domestic circulation”). In the current environment China may also better leverage its higher interest rate curve (both real and nominal) to try to attract capital to support this more permanent shift towards a consumption economy. A more stable currency outlook is also helping. Our bottom line: Expect a heightened rivalry across multiple facets of the relationship, including some decoupling. However, given the absolute size of the opportunity in China, now is actually the time to think through different ways to harness China’s growth in thoughtful, risk-adjusted fashion, particularly investments that reward long-term, patient capital. Specifically, we think that further implementation of domestic circulation as a policy will lead to the rise of more domestic corporate leaders, and as a result, more – not less – corporations will look to find ways to serve this emerging consumption base.

Looking at the big picture, we continue to believe we are in a decent environment for risk assets. Liquidity remains ample, and both real and nominal yields are near record lows. Meanwhile, corporate earnings are rebounding in the near-term faster than many investors think. Consistent with these improving trends, we are raising our 2020 and 2021 earnings per share for the S&P 500 to $125 from $115 and to $164 from $155, respectively. One can see the details on these upgrades in Exhibits 1 and 2. Based on these upgrades, we also lift our fair value target for the S&P 500 to 3,350-3,450 from 3,020-3,120 (Exhibit 4). From a GDP perspective, we too are making upward revisions. Specifically, we are lifting our 2020 forecast to negative 3.8% from negative 6.5% previously. Even with the recent surge in COVID cases during the summer, economic growth remained steadfastly resilient. That’s all good news.

EXHIBIT 1

We Have Bolstered Our Earnings Estimates to Reflect Both Better Revenue Momentum and Tight Cost Controls

Data as at September 18, 2020. Source: S&P, KKR Global Macro & Asset Allocation analysis.

EXHIBIT 2

In Terms of Sectors, Technology, Healthcare and Consumer Discretionary Account for About 85% of the Upward Revisions Relative to Our June Estimates

Data as at September 18, 2020. Source: S&P, KKR Global Macro & Asset Allocation analysis.

EXHIBIT 3

Despite a V-Shaped Start to This Recovery, We Envision More of a Square Root Over Time

Data as at September 24, 2020. Source: S&P, KKR Global Macro & Asset Allocation analysis.

However, the “road” ahead will, as noted above, likely remain a bumpy one, not the “simple highway” for which many are hoping. Beyond the two topics we address in this paper — a shifting posture by the Fed as well as intensifying U.S.-China relations — there are others crosscurrents to consider, including a growing chance of a disputed election in the U.S. Meanwhile, the disruptive role that technology is playing in the global economy has never been bigger, a trend we see poised to accelerate further. There is also a record increase in debt loads, which ultimately will affect growth (Exhibit 6). Finally, after a historic period of outsized activity by the Federal Reserve and the U.S. Treasury relative to its global peers, it feels like the secular bull market in the U.S. dollar and its interest rate advantage may now have finally run its course. We do not make these statements lightly.

EXHIBIT 4

Given Higher EPS Estimates and a More Benign Risk Premium, Our Base Case Now Pegs S&P 500 Fair Value in the 3,350-3,450 Range

Notes: Key Assumptions – 2020e EPS growth = -24% (vs prior estimate of -30%); Long-Term Risk-Free Rate = Current 10y U.S. Treasury yield = 0.7% pull; up to 0.7% Long-Term Growth Rate = 1.2% (50bps higher than the risk-free rate to account for the new Fed regime); Cash payout (dividends and buybacks) falls to 80% (better than GFC levels of 65%) and recovers back to 90% by 2025. Key Metrics – Fair Value Estimate = (3,350-3,450); high case is around 3,900 and low case is <3000; 2021e EPS = $164/share; P/E Multiple on 2021e EPS = 21.4-22.0x (versus prior estimate of 19.5-20.1x).

EXHIBIT 5

Long-Term Global Growth Will Continue to Fall…

Data as at July 30, 2018. Source: OECD, Haver Analytics.

EXHIBIT 6

…Particularly As Global Debt Continues to Rise

Data as at April 14, 2020. Source: IMF, Haver Analytics.

Against this backdrop, we believe a thoughtful macro framework becomes even more important than in the past. From our perch at KKR, we believe that CIOs will need to bring down loss rates across all products, given our more muted expectation for forward returns (see Exhibit 44 in our recent Insights note, The End of the Beginning). Somewhat ironically, this requirement to bring down loss rates is occurring at a time when we think most allocators will actually need to take more risk – not less – to achieve their stated goals. Given the low cost of financing, some CIOs will pivot towards adding some leverage to boost overall returns. We are not opposed to this idea, but we strongly believe that getting the right asset allocation with the right top-down themes will become the most important differentiator over the next five years.

So, where to invest? For our nickel, we continue to advocate even more strongly for a mix that is overweight secular growth companies that can also compound their earnings, which we view as an increasingly rare achievement (Exhibits 7 and 8). Also, remember that real rates are now deeply negative, which increases the value of upfront cash flows that are well in excess of the current rate of inflation. From a thematic perspective within this bucket of our asset allocation, we favor e-commerce, digitalization, pet care, personal safety, and nesting.

EXHIBIT 7

The Number of Companies With Sustainable Growth Continues to Wither

Data as at August 3, 2020. Source: Datastream, I/B/E/S, Goldman Sachs Global Investment Research.

EXHIBIT 8

Interestingly, Even Asia – Which Boasts the Strongest Growth – Is Seeing a Decline in the Number of Its Fast Growing Companies

Data as at August 31, 2020. Source: Factset, MSCI, Goldman Sachs Global Investment Research.

We also favor assets linked to nominal GDP with upfront cash flow. We do not see inflation surging in the near-term, but current fiscal and monetary policies are unprecedented. Recent comments by Federal Reserve members about average inflation targeting only increase our conviction that now is the time to buy a little extra insurance. As a result, we have moved to an even more overweight position in Asset-Based Finance in Credit, Infrastructure, Logistics, and parts of Real Estate. Finally, we continue to advocate for a significant slug of non-correlated assets, including Gold.

EXHIBIT 9

Equity Investors Have — Until Recently — Rewarded Growth, Not Yield, Amidst a Bifurcating Market

Data as at August 14, 2020. Source: Barrons, Bloomberg.

Importantly, though, as Exhibit 9 shows (and we noted earlier), being in the right verticals with the right themes likely matters more than ever. So, our goal at KKR is to continue to effectively marry our macro themes with our micro insights and to use our portfolio construction tools to deliver investment outcomes that we believe are reflective of our firm’s 44-year history as not only a leading alternative investment manager, but also as a thoughtful partner to our clients.

DETAILS

Question #1: Real yields are collapsing. What does it mean for yields and for the dollar?

Coming out of the July FOMC meeting, the headline was that there were no policy changes. However, that is not how we interpreted events. In particular, what was most interesting to us was Chairman Powell’s press conference, where he continued to elevate his concerns for the U.S. real economy amid the ongoing pandemic — flagging, for example, the significant backtracking in job creation for minorities since February (Exhibit 10). Indeed, we think that the Fed is heavily influenced by the unsavory skew of recent unemployment trends. The reality is that unemployment – even after adding back nearly 11 million jobs since March — is still running just below where it was at the peak of the Global Financial Crisis. Without question, these elevated levels of worker displacement are making a huge impression on the way the central bank governors think about policy for the foreseeable future.

EXHIBIT 10

Minorities Have Experienced a Tougher Job Market During the COVID-19 Pandemic…

Data as at August 31, 2020. Source: Bureau of Labor Statistics, Haver Analytics.

EXHIBIT 11

…Including More Dramatic Fall-Offs in Labor Participation Rates

Data as at August 7, 2020. Source: Bureau of Labor Statistics, Haver Analytics.

By comparison, Powell has consistently downplayed the substantial healing we have already seen in financial conditions, emphasizing that his prime focus is keeping credit markets open and liquid. Indeed, despite tightening credit spreads, he has been unwavering in his message that “preserving the flow of credit is essential” to minimize the damage caused by the virus. In fact, even after credit spreads had almost fully normalized to the pre-pandemic range, the July statement by the Federal Reserve announced that, “To support the flow of credit to households and businesses, over the coming months the Federal Reserve will increase its holdings of Treasury securities and agency residential and commercial mortgage-backed securities at least at the current pace to sustain smooth market functioning, thereby fostering effective transmission of monetary policy to broader financial conditions.”

EXHIBIT 12

The Unemployment Rate for Black/Hispanic Americans Has Increased More Substantially Than for the Average American

Data as at August 31, 2020. Source: Bureau of Labor Statistics, Haver Analytics.

EXHIBIT 13

At the Same Time, Low Wage Workers Have Suffered More Mightily Than High Wage Workers

Data as at August 31, 2020. Source: Bureau of Labor Statistics, Haver Analytics.

EXHIBIT 14

The Federal Reserve Is Winning the Day, as Financial Conditions Have Steadily Been Improving

Data as at September 3, 2020. Source: Bloomberg.

EXHIBIT 15

Employee Wages, Particularly At the Low End, Have Been Hard Hit. We Believe This Reality Is Heavily Weighing on the Federal Reserve’s Posture

Note: High-Wage = Information Services, Utilities, Finance, Prof Services And Mining/Logging; Medium-Wage = Wholesale Trade, Construction, Manufacturing, Education/Healthcare, Transport; Low-Wage = Retail Trade, Leisure/Hospitality. Data as at August 31, 2020. Source: Bureau of Labor Statistics, Haver Analytics.

At the annual Jackson Hole summit (held virtually in 2020) in late August, the Fed – as we indicated earlier – shifted its inflation mandate towards an average goal of two percent. In our view, the lion’s share of central bank committee members now believe that inflation is so structurally low that the committee’s change “reflects [their] view that a robust job market can be sustained without causing an outbreak of inflation.” This statement is important because it reveals two things. First, it suggests that, despite the Fed’s dual mandate, it appears to be intensifying its focus on employment relative to inflation. In fact, Powell recently stated that, “This change (in the inflation mandate) reflects our appreciation for the benefits of a strong labor market, particularly for many in low- and moderate-income communities.” Second, when it comes to future inflation trends amidst further downward pressure on wages, he certainly sees a negative skew. Recent trends support this view as inflation has only reached two percent for six months during the last 10 years, despite the U.S. reaching a generational low in its unemployment rate in 2019.

EXHIBIT 16

Price and Wage Inflation Typically Remains Subdued for Several Quarters Following the End of a Recession

Data as at September 11, 2020. Source: BEA, Haver Analytics.

EXHIBIT 17

The Fed Is Going to Have to Work Hard to Create Inflation, Given Many of Its Largest Components Are Facing Downward Price Pressure

Data as at July 31, 2020. Source: BEA, BLS, Haver Analytics.

Another important consideration is what the market is discounting. As we show in Exhibit 23, the rates market is actually embedding potentially negative fed funds in coming quarters. This set-up is significant because it means that Chairman Powell must remain extremely dovish just to prevent a ‘taper tantrum’ situation from unfolding, we believe.

The Fed then held what we view as a ‘watershed’ meeting on September 15th, 2020. At this meeting it officially pivoted to an average inflation targeting framework and committed to formally maintaining rates at the zero lower bound until inflation rises above two percent with solid labor market trends. We believe that there are six main conclusions for investors to digest. They are as follows:

  1. A robust new pre-commitment on rates. While we knew the Fed would pivot to a framework targeting two percent inflation on average, the new development was that the FOMC made an explicit, robust commitment to hold rates at zero “until inflation has risen to two percent and is on track to moderately exceed two percent for some time.” Importantly, though, employment trends – more so than inflation – will drive its willingness to raise rates. Under its new policy, the Fed would not have raised rates in either 2015 or 2016.
  2. From here, the focus is on the economy over markets… The Fed is now pre-committed on rates, but it has no such pre-commitment on QE or macro prudential regulation. In fact, Powell noted that the Fed seeks to promote its employment and inflation goals while warding off any risks to financial stability (i.e., asset bubbles) “that impede the stability of our goals.” Put differently, the Fed’s new framework seems to be about mashing the accelerator on the economy via rates, while maintaining the option of tapping the brakes on markets via macro prudential regulation (bank oversight, stress tests, leveraged lending guidelines, etc.) and QE scaling. This approach is new, and we believe it represents growing caution about retail trading activity, particularly in high growth sectors like Technology.
  3. …With a particular emphasis on social equity and income inequality. Chairman Powell noted the FOMC’s concern that the pandemic has disproportionately harmed women, BIPOC communities1, and service workers. Addressing inequality has historically been more the bailiwick of elected officials than central bankers, but COVID has reminded all Americans of the structural racial inequities in our society. This awakening is just and good, and, the Fed’s focus on these issues helps explain the strong measures it is taking to promote job and wage growth.
  4. The Phillips Curve is out. Disinflation is in. Chairman Powell noted that “low unemployment is not necessarily a policy concern unless it leads to unwanted increases in inflation.” He also acknowledged that we are in a “new normal” wherein “rates are near the effective lower bound even in goods times.” Bottom line: In essence, we think the Fed has now divorced itself from the traditional Phillips Curve, and is placing a particular new emphasis on the disinflationary forces exerted by technology and demographics.
  5. The Fed assumes more fiscal support is coming… While stopping short of making any specific fiscal policy prescriptions, Powell did assert that “fiscal support has been essential in the good progress we see so far” in the economy. He also noted that “most private forecasters assume there will be substantial additional fiscal support,” which we view as his way of telling us this is the Fed’s assumption too.
  6. …Helping to support a continued strong recovery. See Exhibit 18 below for details, but the Fed revised up its assumptions for GDP, employment, and inflation across the board. It now sees U.S. GDP at -3.7% in 2020 versus its forecast of -6.5% back in June. We agree that the opening phases of the recovery have been quite strong, and as we indicated earlier (Exhibit 3), we too have boosted our GDP forecasts for 2020.

EXHIBIT 18

The Fed’s New Economic Projections Reflect Better Growth and Lower Unemployment in 2020

Data as at September 16, 2020. Source: FOMC, Bloomberg, KKR Global Macro & Asset Allocation analysis.

As we look ahead towards the winter, we still expect an extension of the current regime of declining U.S. real yields amid pinned nominal rates and rising inflation expectations. Importantly, 10-year inflation expectations have recovered significantly to 1.77%, but current levels still remain below the Fed’s stated two percent goal. As such, we now see further scope for break-evens to grind higher and real rates to grind lower after the Fed fleshes out in a credible manner how it will implement flexible average inflation targeting (FAIT).

EXHIBIT 19

The Federal Reserve Is Using Average Inflation Targeting as a Way to Try to Bolster Inflation Expectations Back Towards More Normal Levels

Data as at September 3, 2020. Source: Bloomberg.

EXHIBIT 20

While the Unemployment Rate Has Improved, It Is Still at Very Concerning Levels for the Federal Reserve

Data as at September 3, 2020. Source: Bloomberg.

EXHIBIT 21

The Amount of Global Stimulus Has Been Breathtaking, But We Actually Believe There Is Likely More to Come

Data as at July 31, 2020. Source: Cornerstone Macro.

EXHIBIT 22

Given Its Currently High Valuation Amidst Record Stimulus, We Think That the Dollar Could Be Poised to Finally Fall

Data as at August 31, 2020. Source: Federal Reserve Board, JP Morgan, Bank of England, OECD, IMF, World Bank, Bank for International Settlements, Haver Analytics, Bloomberg.

What does all this policy rhetoric mean for asset allocation on a go-forward basis? For starters, it means monetary policy in the United States will remain significantly accommodative for quite some time. As part of this worldview, we think that U.S. dollar assets will depreciate more so on a relative basis than they have during the past 5-10 years. In particular, such negative U.S. real rates are supportive for the euro to increase to at least 1.25 relative to the dollar. We also see the potential for many emerging market currencies to gain ground versus the dollar as well. To this end, my colleague Frances Lim has done some interesting work to show that, despite significant debt loads in China, U.S. debt loads have increased even more. All told, the U.S. has spent 44% of its GDP to try to temper the adverse effects of the coronavirus. Against this backdrop, we believe that the Chinese renminbi seems well poised to appreciate against the U.S. dollar, which could bring a major change in the attitude of global investors.

Meanwhile, within Private Credit, we think that investors should be aggressive around sourcing hard asset-based investments with upfront cash flows (e.g., Asset-Based Finance). We are currently seeing a compelling opportunity set for providing solutions via housing platforms where there are supply-demand imbalances pressuring both home prices and rents, or lending against the embedded value of an asset (EV) with favorable coupons. Along those same lines, we also like asset classes that tend to pay relatively higher excess coupons for which there are sound underwriting disciplines and fundamentally driven borrower behavior. One such example includes auto loans, for which the backdrop of personal mobility and independence is a near term tailwind; we also like that, if underwritten properly, there is significant asset value in many autos that can serve as collateral, particularly when the auto is viewed as a personal safety item for the driver (e.g., a commuter).

EXHIBIT 23

The Market Anticipates Steadfast Dovishness From the Fed, Which Means Powell Essentially Must Remain Dovish to Avoid a Taper Tantrum

Data as at September 11, 2020. Source: Bloomberg.

EXHIBIT 24

Record Stimulus by the Federal Reserve and Treasury Are Finally Lifting Inflation Expectations

Data as at September 11, 2020. Source: Bloomberg.

EXHIBIT 25

U.S. Real Rates Have Crashed Into Negative Territory, Converging With European Levels

Data as at September 11, 2020. Source: Bloomberg.

EXHIBIT 26

Gold Prices Have Reacted Positively to the Decline in Real Rates

Data as at September 11, 2020. Source: Bloomberg.

The environment we envision also means that Infrastructure should do well. Coupled with rapidly aging populations that are not confident that they will have enough money to retire, the desire for income producing investments should only increase in our view. We believe these trends are secular, not cyclical, and will likely continue to positively affect valuations of “growth-oriented” yielding securities or investments, including global infrastructure. Last mile build-out in optical fiber has been a significant overweight for us, but we are also seeing a growing number of infrastructure opportunities emerge from over-levered corporates. At the moment, Europe and Asia have been the most active areas, but we do also expect the U.S. to participate in our deconglomeratization thesis. As Exhibit 28 shows, our work suggests this transition towards more simplicity in corporate structures generally leads to a significant increase in value.

EXHIBIT 27

Infrastructure Yields Have Remained Relatively Stable, While Bond Yields Have Collapsed

Data as at September 1, 2020. Source: MSCI, Bloomberg.

EXHIBIT 28

A Simple Corporate Structure Typically Holds a Higher Valuation Than a Complex One

Data as at August 6, 2019. Source: MSCI, Factset Global, KKR Global Macro & Asset Allocation analysis.

On the traditional equity side of the portfolio (and despite the cyclical rebound we are forecasting), the current structural global GDP slowdown is having a profound impact on the ability of companies to grow. All told, the percentage of companies in the MSCI All Country World that are poised to grow eight percent or more has fallen sharply to 16% in 2020 from 45% during the 2000-2001 period (Exhibit 7). So, our view is to find companies that have established cash flowing business models with identified economies of scale that will result in material improvements in cash flow and book value as these businesses grow in size. We also think that these companies should have clearly defined sources of support for those cash flows, including access to growing end markets, clear ability to scale in production or distribution, brand loyalty, and defensible margins. This underscores our view that owning some secular growth in the portfolio has become of paramount importance. In terms of where to invest behind our favorable outlook on secular growth stories, we currently favor several regional themes over global ones, including business services, logistics, digitalization, payments, and automation.

Our bottom line: Led by outsized U.S. monetary policy that is more flexible in nature and a surge in fiscal stimulus, we are at an inflection point in the global capital markets, one that requires a rethinking of traditional asset allocation. Beyond the more restricted role that government bonds can play in a diversified portfolio (see our recent Insights note, The End of the Beginning), we are using this piece to strengthen our view that the recent decline in the U.S. dollar will emerge as a more permanent feature during this recovery. Just consider that real yields in the U.S. are now on par with Europe – which makes the euro more competitive – while nominal yields greatly favor China’s currency (see below Exhibit 46). Consistent with this view, we are also suggesting that weightings to European and Asian Private Equity likely need to trend higher. We also believe that collateral-based, private investments like Infrastructure, Real Estate Credit, and Asset-Based Finance will likely be re-rated upward in the coming quarters if we are correct about the intentions of the Federal Reserve.

However, the Fed’s revelation that it will monitor financial stability means that the background will be less of a one-way trade in favor of risk assets. In particular, the Fed is now starting to publicly remind everyone that monetary policy is intended to ‘fix’ the economy, not continually bolster financial asset prices. Hence, it has made the decision to flag ‘financial stability’ more aggressively in its mandate. Walking this line as a committee will not be easy. Indeed, we view the dissension in September by Fed governor Robert S. Kaplan as an important signal for the investment community to watch. Were more Fed governors to adopt his viewpoint, it could quickly reduce some of the excess froth that now appears to be building up in some of the more speculative parts of the debt and equity markets.

Question #2: Is China Still an Investable Growth Story?

In recent weeks, investor’s interest in Asia, China in particular, has – not surprisingly – surged. This heightened level of inquiry makes sense to us, given ongoing technology disputes, noise around the South China Sea area, and a continued ‘blame game’ around the onset of the coronavirus. Given this backdrop, we thought it might make sense to discuss our current thinking on several major trends in China, including areas where we still have high conviction and areas where our thoughts might have changed or become more conservative.

In terms of what has not changed in our outlook, there are several long-term trends to embrace, we believe. First, we still expect China to remain the dominant force in global growth, even in the slow growth ‘world’ we envision. One can see that China alone makes up about one third of global growth; with its immediate trading partners across the emerging markets that proportion climbs to almost 75% (Exhibit 29). That part of the story has not changed.

EXHIBIT 29

Growth in the Global Economy Continues to be Driven by the Emerging Markets

Data as at April 16, 2020. Source: IMFWEO, Haver Analytics.

EXHIBIT 30

Asia Will Further Dominate Global Consumption Trends by 2030

Data as at April 9, 2019. Source: IMFWEO, World Bank, National Statistical Agencies, Haver Analytics, KKR Global Macro & Asset Allocation analysis.

We also believe that China remains steadfastly committed to aggressively internalizing its economy. Of late, President Xi Jinping has been promoting his new ‘dual circulation’ strategy, which emphasizes domestic manufacturing and services for the domestic consumption economy. In other words, the country is pivoting from one focused on international trade/exports to one that is focused on self-sufficiency for its burgeoning consumer market and domestic businesses. However, as we show in Exhibit 31, this transition actually began to take place immediately and steadfastly after 2007, the exact point when China realized it needed – for both economic and national security reasons – to pivot away from an export-driven model that was largely dependent on the U.S. consumer.

Fast forward to today, and exports as a percent of GDP are now just 17%, compared to nearly 36% in 2007. Moreover, the type of exports has shifted, as China has boosted the proportion linked to higher value-added products (read China 2025) to nearly 60% from around 44% in 2008 (Exhibit 32). In our view, the coronavirus as well as the recent trade spats will only reinforce China’s commitment to this initiative.

EXHIBIT 31

Importantly, Trade Is Becoming a Smaller Part of China’s Economy

Data as at August 31, 2020. Source: China Customs, Haver Analytics.

EXHIBIT 32

Chinese Exports Continue to Rebalance Towards Higher Value Added Goods

Data as at December 31, 2019. Source: China Customs, Haver Analytics.

Importantly, we see more running room ahead, particularly given the huge size of China’s middle class. One can see this in Exhibit 30. As part of this growth, we expect the trends towards digitalization, e-commerce, fintech, and online experiences to accelerate. Moreover, we think the collective arrival of the Internet of Things (IOT), Artificial Intelligence (AI), and 5G (5th Generation Connectivity) mark a pivotal point that will reshape the global economy. Indeed, while many hoped that the AOL-Time Warner merger would herald in the Internet age in 2000, it was missing the processing speed, swaths of data, and mature algorithms to fuel AI. Today, however, we believe 5G, AI and IOT will revolutionize every industry. We now have massive amounts of data, a technologically skilled workforce, high tech communications infrastructure, and high speed processing power. As a result, 5G will remain a key battleground, and as such, China’s ability to differentiate itself during its rollout/adoption could be significant to the country’s overall growth and competitive positioning in the global economy.

On the other hand, there are several important influences that have changed direction in recent months. The first is China’s role in the global liquidity picture, and then its response to the coronavirus in particular. Specifically, whereas China used record amounts of stimulus essentially to reinvigorate the entire global economy in 2008, this cycle, it has been the United States leading the charge in terms of throwing the greatest amount of liquidity at the problem. One can see this in Exhibit 33.

EXHIBIT 33

In 2008, China Led the Way. Today, However, the U.S. Is the Most Stimulative

Data as at June 30, 2020. Source: Cornerstone.

EXHIBIT 34

U.S. Money Supply Is Surging Relative to Other Countries That We Track

Data as at July 27, 2020. Source: Haver Analytics.

Heightened geopolitical tensions are also changing the way China and its trading partners think about their role in the global supply chain. Importantly, we do not believe that the current geopolitical frictions centered in the Indo-Pacific region are an anomaly – the product of the particular personalities presently in power or election year dynamics in the U.S., although the latter is certainly exacerbating certain trends. Rather, we see great-power competition – not only between China and the United States, but between China and other major powers – as an enduring, transformational force on the international stage, akin to globalization, that is likely to play out for the foreseeable future.

Without question, this transformational shift will definitely impact supply chains. To this end, we recently spent time analyzing some excellent work done by the U.S.-China Business Council as well as comparing best practices across our nearly 200 portfolio companies. As we show in Exhibit 35, the punchline is that many companies are slowing down their investment in China. Some of this shift in sentiment is linked to heightened geopolitical tensions, while some of it stems from the aftermath of COVID-19. As we show in Exhibit 38, research and development too has fallen dramatically.

Interestingly, though, our conversations with many CEOs operating in China suggest that there is an important bifurcation occurring. Specifically, management teams who believe that their companies have built competitive advantage – either by product or by process – are actually ramping up their investments in China to try to capture more of the market. The goal, we believe, is to extend their lead over local players in such a way that they build a competitive, sustainable moat around their businesses. This viewpoint is significant, as large U.S. multinationals have $900 billion in assets and more than $500 billion in book value now located in China, according to a recent report by the Economist. By contrast, smaller and more marginal players, particularly those who today face a more formidable local competition, are now pulling back more aggressively than in the past.

EXHIBIT 35

Almost 25% of U.S. Multinationals Surveyed Have Reduced Or Stopped Planned Investment in China in the Last Year, A Historic High for This Survey

Data as at June 2020. Source: U.S. China Business Council Member Survey.

EXHIBIT 36

The Top Reasons for Curtailing Investment in China Are Increased Costs and Uncertainties from U.S.-China Tensions and COVID-19

Data as at June 2020. Source: U.S. China Business Council Member Survey.

EXHIBIT 37

Besides Trade Tensions and COVID Uncertainty, Businesses Are Facing Increased Competition from Domestic Companies and Market Access Restrictions

Data as at June 2020. Source: U.S. China Business Council Member Survey.

EXHIBIT 38

Data Flow Restrictions and Export Control Policies in China Are Likely Impacting R&D Spending

Data as at June 2020. Source: U.S. China Business Council Member Survey.

We also do not ascribe to the bearish view that all supply chains will exit China immediately. There are several influences to consider. First, our contacts on the ground inform us that local Chinese officials are working very hard to create an attractive environment in which U.S. multinationals can continue to operate. Consistent with this view, we are increasingly hearing of more approvals, particularly in financial services, for foreign operators to own majority stakes in China.

Second, because China has such a strong and proficient infrastructure, it is hard to replicate the ‘supply chain pods’ that exist inside China elsewhere. As such, while some capacity is either re-shoring or moving to other low costs countries like Thailand, the majority of those we polled in our informal survey are keeping more than 70% of their production in China for the foreseeable future. This reality is one of the main reasons we are not surprised that China has continued to gain market share in the export market. One can see this in Exhibit 39.

EXHIBIT 39

China Is Importing Less Goods and Services, as It Makes Its Economy More Self-Sufficient…

Data as at July 2020. Source: China Bureau of National Statistics, Haver Analytics.

EXHIBIT 40

…All While Growing Export Market Share Despite the Trade War

Data as at July 2020. Source: China Bureau of National Statistics, Haver Analytics.

From a strategic standpoint, China is also changing the way it thinks about its capital markets. Remember that as it continues its transition from a fixed investment economy to a services and consumption based one, China will almost inevitably run a current account deficit. If it does, it will need to fund that ‘hole’ in its current account with positive flows into its capital account. To do this, it must either attract foreign direct investment and/or portfolio flows. Our ‘gut’ instinct is that China will do both.

EXHIBIT 41

China’s Stock Market Should Grow Faster, As the Country Begins to Attract More Foreign Capital

Note: The size of stock market refers to the total market capitalization of domestic listed companies. Data as at September 23, 2020. Source: World bank global financial development database, BIS, KKR Global Macro & Asset Allocation analysis.

EXHIBIT 42

China’s Bond Market Should Deepen Further, As It Transitions Towards a More Mature Consumption Economy

Note: The size of bond market refers to total securities outstanding including domestic and international. Data as at September 23, 2020. Source: World bank global financial development database, BIS, KKR Global Macro & Asset Allocation analysis.

EXHIBIT 43

Going Forward, China Will Likely Need Upwards of Several Hundred Billion in Net Capital Inflows Annually to Finance the Current Account Deficit

Data as at June 30, 2020. Source: State Administration of Foreign Exchange, Haver Analytics.

EXHIBIT 44

A Declining Savings Rate Will No Longer Support Increased Investment. As Such, Our Base View Is That China Will Need to Import Substantial Amounts of Foreign Capital Over Time

Data as at October 7, 2019. Source: IMF, Haver Analytics.

EXHIBIT 45

The U.S. Bond Market Is the Biggest, But China’s Higher Yields Give It the Opportunity to Grow Its Market Share…

Data as at March 31, 2020. Source: BIS, Haver Analytics.

EXHIBIT 46

…Particularly When Developed Market Bond Yields, the U.S. in Particular, Now Offer Very Little Return to Investors

Data as at September 24, 2020. Source: Bloomberg.

Importantly, with the size of the capital markets being quite small relative to size of GDP, there could be significant room for growth if China were to catch-up in relative size with some of its developed market peers. While China’s banking system as a share of GDP of 292% is much larger than that of the U.S. (119%), its bond market is much smaller. Specifically, China’s bond market is now just 114% of GDP, compared to 193% in the United States, 252% in Japan, and 92% in Germany. In our view, herein lies the opportunity, we believe, particularly given China has so much higher real and nominal rates (Exhibit 46). If we are right, China will work hard to ensure that its bond market, which can be supported by more foreign capital, can replace its bank lending market as a primary source of funding growth and pricing risk. The key, of course, will be assuring investors that their capital will not get stuck in China, an issue of concern for many global investors with whom we speak.

On the equity side of the Chinese capital markets, we are also optimistic about China’s ability to import foreign capital. Already, since 2019, China’s A-share representation in the MSCI Emerging Markets Index has quadrupled from five percent to 20%. Yet, even with this sizeable increase, the size of China’s capital markets is still comparatively much smaller than its peers. All told, its stock market capitalization stands at 59% of GDP, which is much lower than that of the U.S. at 148% of GDP, Japan at 122% of GDP, and Australia at 107% of GDP (Exhibit 41). Moreover, as Exhibit 47 shows, recent new issue activity has remained extremely robust, despite rising geopolitical tensions, a trend we expect to continue.

EXHIBIT 47

While the U.S. Is Still an Important IPO Market for Chinese Companies, More Are Now Raising Capital in Local Markets

Data as at June 19, 2020. Source: CEIC, Morgan Stanley.

EXHIBIT 48

U.S. Delisting Activity Is Not Affecting Chinese Companies Ability to Raise Capital, As Many Have Pivoted Back to Asia

Data as at June 11, 2020. Source: Citigroup.

So, in sum, while Frances Lim and I think we are at an important inflection point for U.S.-China relations, many of the current trends that led to this inflection point have been bubbling up for a decade or more. In terms of key areas of focus, our top belief is that investors should expect China to continue to internalize its economy. A consumption economy lifts millions out of poverty, which helps to ease social unrest. A consumption economy also makes China less dependent on others, including the United States. “Domestic circulation,” or the intent to source more parts locally, will also drive more innovation as well as growth in new Chinese industries. However, as consumption becomes more important, so too will the ability to attract foreign capital. In our view, understanding the nuances of this transition will be a critical one for all global investors.

EXHIBIT 49

The U.S. and China Currently Have Much Deeper Economic Linkages Than Other Actual or Potential Adversaries of the Last 100 Years

Data as at December 31, 2016. Source: JPM Asset Management, UNCTAD, World Bank, UN, U.S. Treasury, Baribieri/Keshk COW Trade data, U.S. Trade Representative Office, Setser (CFR), Bank of England, St. Louis Fed, Eichengreeen (Berkeley), Howson (Princeton), East-West Center, O’Neill (CNA), Ritschi (LSE) Accominotti (LSE), Wilkins (FIU), Villa (CEPII).

EXHIBIT 50

However, the Focus May Become Supply Chains As National Security Issues

Data as at December 31, 2019. Source: Goldman Sachs.

Nonetheless, there will likely be a higher risk premium associated with investing in China. In particular, tensions around economic prowess, national security, human rights, and ideology likely mean that investors will need to approach China with a more nuanced lens, one that requires both local and global perspectives. For example, as we show in Exhibit 50, China’s dominant position in the production of active pharmaceutical ingredients is already being questioned by national security experts in Europe and the United States. Parts of supply chains too as noted earlier may be rethought.

EXHIBIT 51

National Security Is Now Bundled With Rule of Law and Trade Negotiations

Data as at May 29, 2019. Source: KKR Global Macro & Asset Allocation analysis.

As we mentioned at the outset of this Insights note, the path forward for China could be a rocky one, but there is a lot we can learn from where China has been in order to invest behind where it will be going in the future. Indeed, as Confucius said, “study the past if you would define the future.” In our humble opinion, after traveling to China for nearly three decades, never have these words of wisdom been truer.

EXHIBIT 52

All Global Technology Companies, Including Ones in the U.S., Rely On the Chinese Market for Growth

Data as at July 31, 2020. Source: Deutsche Bank, The Economist.

Conclusion

As we head into the fall, we feel confident about the upside potential for our global investors if we can correctly marry our macro themes with the micro opportunities that our investment teams continue to uncover. However, as we detail in this piece, understanding the long-term implications of the change in Fed policy and also in the U.S.-China relationship is paramount to that success. Importantly, similar to the introduction of QE as an inflection point in monetary policy during and after the GFC, we view the Fed’s new inflation framework as another important milestone.

Our base view is that inflation and rates will remain low. So, from an asset allocation perspective, investors should increase their focus on growth companies, yield, and collateral based cash flowing stories. However, given that many central banks are now experimenting with helicopter money via direct deposits and looser inflation standards, CIOs should likely have more inflation-based protection in the mix. By comparison, given how deeply negative real interest rates are, the penalty for owning cash has gone up. As a result, periodic dislocations in the credit markets should be consistently bought, particularly at the short end of the curve. Finally, while the backdrop is still a good one for risk assets, the Fed’s intensifying focus on financial stability should serve as an important warning shot that more volatility and less consistent gains lie ahead.

EXHIBIT 53

Fed Policy Must Balance Long-Term Unemployment Concerns With Short-Term Stimulus Trends Linked to COV-19

Data as at August 28, 2020. Source: Cornerstone Macro.

EXHIBIT 54

We Generally Look for Lower Forward Returns Across Many of the Asset Classes We Forecast

Data as at June 30, 2020. Source: Bloomberg, Haver Analytics, Cambridge Associates, KKR Global Macro & Asset Allocation analysis.

On the China front, we expect heightened tensions to continue. Key to our thinking is that the U.S. and China are redefining their policies around a variety of different issues, including economic ties, ideology/human rights, national security, and law enforcement. Because there are so many differing constituents with separate agendas involved in the debate, the probability of near-term harmony is low. Largely, this is why we have dedicated so much of our research effort to better understand China’s long-term plan and what it means for the global economy and capital markets.

Overall, we view the current environment as an attractive one for investors who can translate their thematic macro work into actionable micro themes. The key, as we have described in all our recent post-COVID Insights pieces including this one, is to focus capital deployment on areas, including sectors and themes, where there is not only above average GDP growth but also the ability to translate the revenues into high cash flow returns. Without these disciplines, we believe that the ability to earn outsized returns during the next five to seven years is now much more limited (Exhibit 54).

https://www.kkr.com/global-perspectives/publications/road-ahead

Trying to Score two goals

Samuel rines is a very underrated economist and his commentary on FOMC is very thought Provoking

The Fed did not miss its opportunity. It delivered a surprisingly straightforward, easy to understand message of “we aren’t going anywhere”. The Fed stated it was not raising rates until maximum employment can be reached (unemployment around 4%), and inflation ran modestly above 2%. That is very dovish forward guidance from the Fed. By doing so, it locked itself into keep rate policy extremely accommodative for an extended period of time. With employment at the forefront of policy, policy should be more easily understood.Regardless, aiming for two goals is difficult. And the Fed will lean dovish until it manages to get both on target.  “I like to reinvent myself — it’s part of my job.”
― Karl Lagerfeld
The Fed need to reinvent itself before COVID. Because of COVID, its pivot was all the more necessary. By putting employment at the forefront of its mandate, the Fed creates a easy to understand goal. Here is what the policy setting Federal Open Market Committee (FOMC) said:

“The Committee decided to keep the target range for the federal funds rate at 0 to 1/4 percent and expects it will be appropriate to maintain this target range until labor market conditions have reached levels consistent with the Committee’s assessments of maximum employment and inflation has risen to 2% and is on track to moderately exceed 2% for some time.”

What does that mean? It means the Fed will try to hit about a 4% unemployment rate and get inflation higher before raising rates. How do we know it is around a 4% unemployment rate? Because the Fed tells us with its “longer-run projections”.  Interestingly, the FOMC seems to be a bit bullish on the speed of the return to full employment, but the lack of flexibility (having to get there before pivoting policy) is important. In the past, the Fed would “see emerging inflation pressures” or “robust labor market” and decide to tighten its policy stance. That has not worked out well in recent years, and the Fed has abandoned that policy. It is now a wait until it actually comes about- not could or should or might. 

That means that Fed projections do not matter anywhere near as much. The Fed has not been great at projecting the labor markets or inflation. So why trust those figures now?  Instead of worry about what the Fed thinks will come about (which was paramount a year ago), markets can assess the labor market for themselves and judge the duration and extent of monetary accommodation the Fed will provide. If the labor market recovery slows or accelerates, the duration of low rates and QE will change. 

Speaking of QE, there is more of that coming too. The Fed made clear that the current $120B monthly pace of US Treasury purchases will continue “at least at the current pace.” But what the Fed thinks will happen simply does not matter. That is powerful forward guidance. 

There is also an asymmetry in the forward guidance. If there is a downside surprise to the incoming data? “The Committee would be prepared to adjust the stance of monetary policy as appropriate if risks emerge that could impede the attainment of the Committee’s goals.” If there is an upside surprise? Does not matter. There is no movement in accommodation. It only reduces the duration of that accommodation. 

In other words, the Fed made the pivot official – it is all about employment now and the Fed will only do more, not less. Monetary policy is going to be stimulative for the foreseeable future. And it has more tools to use if necessary. The Fed’s New Rule is in effect, and it is going to try to score two goals.  As always, please do not hesitate to reach out with comments, questions, or suggestions.

 Here is the sign-up page, and here is the archive. 

 Samuel E. Rines
Chief Economist
Avalon Investment and Advisory 
Direct: 713-358-6077
2929 Allen Parkway, Suite 3000
Houston, Texas  77019
srines@avalonadvisors.com

Under the “Macroscope”: The Decade Ahead

Niels Bohr, my fellow countryman and Nobel laureate in Physics and father of the atomic model, is quoted as saying, “Prediction is very difficult, especially if it’s about the future!” However, change is the only constant and change is not an event; it is a process and as such, we can explore what such processes may look like. From there, we can map out different paths to major change and from that vantage point, we can monitor for signals that may help us determine the probable direction of travel in the key economic, financial, and social spheres. As investors and business owners, we can thus position ourselves to manage the risks and harness the opportunities.

In this exploration of the decade ahead, I will be putting the US under the ‘macroscope’ as it remains the key cog in the global economic and financial machine. It has been dominant on most fronts for the last 70 years, and in terms of financial flows and asset markets performance, it has been ‘exceptional’ for the last decade. However, many of the considerations I’ll raise will also be applicable to various degrees to the other key components of the global economy and all are interconnected at historically high levels.

As we exited the Great Recession in the early 2010s after unprecedented monetary and fiscal measures, there was much talk of the onset of the ‘Japanification’ of all developed economies. Many observers are expecting this to finally set in during the 2020s. The human mind likes to put neat labels on complex things and then file them away in an orderly spreadsheet-like mental space never to be questioned and thought much about again. This approach comes with great risk of a rude awakening in the real world. The US is not Japan – culturally, politically, economically, or financially. There are certainly overlaps: financial repression at the monetary level, debt dependency, centralization and zombification have gradually gained the upper hand in the financial and economic spheres during the last decade. The Covid-19 crisis has been an accelerant for all of these trends, and its effects will be with us long after the virus. While the monetary playbook has been the same, it’s the reactions to its outcomes that should be considered. Politically, culturally, and socially, the US is a very different place and, in my view, it’s those differences rather than the similarities that will be most important in terms of shaping the outcomes for the next decade.

A look back to the 1960s…

These political and social forces will turn ‘ice into fire’ as the 2020s get underway. The current “Molotov Cocktail” zeitgeist smells more like the late 1960s to early 1970s to me: coming out of increasingly unpopular foreign entanglements (Vietnam then – ‘War on Terror’ now), with the nation’s social fabric stretched to its breaking point, and matters of race and inequality dividing society across rural/urban and generational lines, only a short time after what felt like major social and economic progress. A world still shaped in the image of the ‘Washington consensus’, looking increasingly out of consensus and confused by the messages coming out of the ‘shining city on a hill’. As the 1970s got underway, it was clear that there were deep political and social problems. The late-60s were marked by riots in major US cities, the military was deployed on US streets, and protesting students were shot and killed by the Ohio National Guard at Kent State University. These were truly partisan times, while several high-profile civil rights leaders were assassinated, as was a presidential candidate.

Once it became clear that crackdowns and displays of hard power were only making matters worse, the chosen solution was to throw money at the problems. The ‘guns vs. butter’ debate turned into the ‘guns and butter’ framework that has been with us ever since. The political economy set in and fiscal measures became the answer to all ills. Debt became the remedy and central banks were co-opted to monetize it. In 1971, President Nixon abolished the post WWII Bretton Woods system and severed the USD’s final links to gold, thereby removing cumbersome restraints. The price was paid via the currency and eventually through exceedingly high levels of inflation. In 1972, an embattled Nixon left office in disgrace, after the fallout from the Watergate scandal.

Back to the future…

So where are we heading? Well, ‘history rarely repeats, but it does rhyme’ on occasion. The upcoming US presidential election is obviously on the forefront of most people’s minds. It may come to be a seen as a point of departure, but the dynamics of the 2024 election may prove more consequential in terms of actual policy changes beyond the rhetoric.

Let’s get fiscal…and soak the rich…

In 2020, the Millennial and Gen Z generations will numerically match the Boomer and Silent Generation in the electorate (if they come out to vote) and this trend will obviously only continue to tilt more and more in their favor, even with the quirks of the Electoral College for presidential elections factored in. Without getting into the party politics of it, one can clearly see the interests of this rising electorate majority. Millennials, who are now in their early 30s, own just 3% of the total US household wealth, according to the Federal Reserve. The Boomer Generation entered their late 30s in the 1990s with 21% of the household wealth and they currently hold 57% of it.

People tend to vote in line with their interests, especially in times of economic crisis, so fiscal spending focused on areas important to the younger generations and broader wealth redistribution measures would appear to be baked into the cake. The top marginal tax rate for individuals in the years between 1965 and 1981 was 70% and finally in 1978, faced with double digit inflation rates, income tax brackets were adjusted for inflation leading to fewer people being directly taxed at the highest rates. Currently, personal and corporate tax rates are at relatively low levels. Considering the current debt and fiscal dynamics alone, it is hard to see how they are not heading for significantly higher levels in the years ahead. Add in political sentiments and the required spending to get the economy back on track and you are looking at a fraught landscape.

The witches’ brew…

In the last decade, global monetary policy has been loose, but fiscal policy was relatively tight. The last couple of years in the US were the exception, with tax cuts and fiscal spending combined with relatively tighter monetary policy. Now both have been unleashed in the face of the Covid-19 crisis. Fiscal spending is politically hard to scale back, let alone stop, once you get started, and as we have seen, once monetary policy gets going and becomes a key driver of asset prices, that also becomes impossible to rein in.

The risk going forward is that there is a sense of ‘the boy who cried wolf’ attached to inflation risk, after many observers made strongly-worded predictions about high to hyper-inflation being just around the corner when those first rounds of QE were unleashed back in ‘08. Populations seeking simple, painless solutions to complex, difficult issues tend to find politicians who will make promises of exactly that. The ‘answer’ would appear to be ‘MMT’ by another name with never-ending ‘temporary’ fiscal programs paid for by more and more debt, which in turn is bought by the central bank spiced up with some ‘tax the rich’ efforts for good measure.

In the mid-1960s, US inflation was below 2% before exploding into double digits in the mid-1970s. Will this ‘rhyme’ with the 2020s? The ingredients are all there. What is for sure is that most central banks have lost their independence and are increasingly a tool for government policy. With global levels of debt reaching a record $258trln in Q1 2020, it will be very painful to raise interest rates and any policy errors will be felt far and wide.

This is a volatile brew that has been simmering for a while and may come to a boil in the decade ahead. Investors need to think about these dynamics – social, political, economic, financial – and make sure they are prepared to face the risks and harness the opportunities.

With financial repression set to spread beyond the monetary policy domain, ‘how you own’ will be as important as ‘what you own’, so make sure your vessel can weather the storm. On the investment front, it starts with comprehensive risk management and global cross asset class strategies. Finding companies supported by decade-long mega trends powered by innovation and with a proven ability to navigate change, and then building positions upon market disruptions when most are fearful, will be key.

It’s also worth noting that currently ‘Real Assets’ relative to ‘Financial Assets’ are at their lowest point since records began in 1926. Precious metals, productive land (farm & forestry) and real estate in stable jurisdictions might be a good place to start as you look to protect what is rightfully yours on the path ahead. On a final note, always stay humble and nimble and operate with a margin for error for optimal outcomes.

https://www.bficapital.com/post/under-the-macroscope-the-decade-ahead

A New Bull Market for Precious Metals

By Crescat Capital

Central banks are facing a serious predicament. After decades of ongoing accommodative monetary policy, the world is now sitting at record levels of debt relative to global GDP. In our view, there has never been a bigger gulf between underlying economic fundamentals and security prices. We are in a global recession, but equity and credit markets still trading at outrageous valuations. Markets are trading on a perverse combination of Fed life support and rabid speculative mania. Meanwhile, demand for gold and silver, which is fundamentally cheap, is starting to take off as central banks are engaged in new record easy monetary policies. Ongoing easy monetary policies in the face of today’s asset bubbles in stocks and fixed income securities has a high probability of leading to a self-reinforcing cycle that drives investors out of these over-valued asset classes and into under-valued precious metals. Here are just some of the reasons Crescat is selling richly valued stocks at large and buying undervalued gold and silver including mining companies today:

  • The economy is now reaching credit exhaustion with record amounts of government and corporate debt relative to GDP worldwide.
  • The debt burden ensures weak future real economic growth.
  • Monetary debasement is the only way to reduce the debt burden. Fiat currencies are now engaged in a race to the bottom.
  • Global monetary base expansion to suppress interest rates creates a supercharged environment for gold and silver.
  • The global economy is in a severe recession with structural underpinnings beyond Covid-19.
  • Unemployment has spiked an historic 6.7% in just five months from 3.5% to 10.2% even after settling back from temporary 14.7% Covid-19 lockdown levels.
  • US equities today trade at truly record valuations, a full-blown mania. Ongoing policy rescue has perverted both free market accountability and price discovery creating a simultaneous zombie economy and stock market bubble which is unsustainable. Speculative asset bubbles are ripe for bursting.
  • During the 1970s precious metals bull market, 10-year real yields got as low as -4.9%. We strongly believe we are headed in that direction and again with a long runway, especially with Jay Powell’s new signaling from Jackson Hole.
  • A colossal $8.5 trillion of US Treasuries will mature by the end of 2021 and will need to be refinanced. Our government’s own central bank, the Fed, is the only entity capable of swallowing its debt guaranteeing new record levels of money printing to top today’s already historic levels.
  • Precious metals became a forgotten class among large allocators of capital in the extended expansion phase of the last busines cycle.
  • With $15 trillion of negative yielding bonds, equities’ earnings real yields at a decade low, and corporate bonds near record prices, gold and silver are being rediscovered for their tactical as well as strategic risk reducing and return generating properties in prudently balanced portfolios.
  • The precious metals mining industry is the one clear industry to directly benefit from this monetary and fiscal indulgence. The aggregate market value of this industry still is almost 3 times smaller than Apple’s market cap.
  • Precious metals are now trading at historically depressed levels relative to money supply; overall stocks, on the other hand, are the complete opposite.
  • After a decade-long bear market, precious metals miners have been reluctant to spend capital. Now, they have historically low equity dilution, clean balance sheets, and record free cash flow growth.
  • The lack of investment in exploration and new gold and silver discoveries is setting up an incredibly bullish scenario for metals as supply is likely to remain constrained for an extended period at the same time while demand is poised to explode.
  • The year-over-year change in gold prices just broke out from a decade-long resistance. Last time we saw such strong appreciation was at the early stages of the 1970s gold bull market.

Financial markets simply cannot withstand higher interest rates. We believe the Fed has been forced into a new mandate, to suppress yields at all cost. This dynamic of expanding the monetary base to purchase assets and manipulate rates lower is an explosive mix for precious metals.

The break of the gold standard in 1971 was just as impactful as the Fed’s recent unlimited QE policy. Back then, it marked a period of lack of financial and fiscal discipline that triggered a frenetic 10-year bull market for gold. This time, we have arguably even stronger macro drivers for precious metals. As we show in the chart below, we have been in a clear trend of structurally increasing government deficits.

The S&P 500 real earnings yield is at its lowest level in a decade. Prior lows were also times that gold outperformed equities. In the early 2000s, for instance, the gold-to-S&P 500 ratio went up by 120% over 3 years. Even in 2010, a bull market for stocks, gold outperformed by 50%. The difference this time is that stocks have never been so overvalued at the same time as the economic growth outlook has been so challenged. We believe strongly this is the perfect time to buy gold and sell stocks. And when we say “buy gold”, we also include silver and precious metals mining stocks where there is even more upside exposure (both alpha and beta) to a macro move up in gold.

The debt quandary the US government faces also adds tremendously to our views on precious metals. From a funding perspective, 71% of all Treasuries issued in the past year matures in less than 12 months, resulting on Treasury Bills outstanding to surge to $5 trillion! The US Treasury is hoarding a record of $1.79 trillion of this cash. A similar buildup happened back in 2008-9. A major difference this time is the fact that Treasury Bills outstanding are almost $3.3 trillion higher than their cash balance. In such scenario, average maturity of government debt has dramatically declined to 64 months. As a result, there is a tsunami of $8.5 trillion of Treasuries that will be maturing by the end of 2021 ensuring astronomic levels of money printing in the near term.

Skeptics of Crescat’s long gold thesis often say real yields can’t move any lower. This is often because this are looking at the TIPS market which only dates back to 1997 and real yields are already at their lows for this time frame. Therefore, some investors assume interest rates when adjusted for inflation expectations have never been lower. That, unfortunately, fails to include one of the most important analogs to today’s set up, the decade of the 1970s. Back then, 10-year yields less inflation measured by CPI twice reach as low as about -4.9%. Those moments of large and declining negative real interest rates drove two of the US most significant surges in gold, silver, and precious metals mining stocks in US history. In today’s conundrum, corporations and governments are historically indebted and can’t take higher nominal yields, ensuring that strong monetary stimulus is here to stay to drive real yields lower, just like Jay Powell has promised.

A major narrative shift is underway. The old times of precious metals being perceived just as haven assets are probably over. With $15 trillion worth of negative yielding bonds, record overvalued stocks and a historically leveraged global economy, investors will likely begin to look at gold and silver, especially mining companies, with a fresh pair of eyes: growth and value. Precious metals miners are the only industry where we are seeing strong and sustainable growth in revenues and future free cash flow at still incredibly low valuations today. Investors are starting to take note. Silver mining stocks, for instance, have already started to outperform even the market darlings, tech stocks. We believe this is only the beginning of a new era for precious metals.

The mining industry built a reputation of being capital destroyers since it peaked in 2011. But today this skepticism is no longer warranted. It is mind blowing that gold prices have just hit record highs and the larger mining companies have barely engaged in share dilution. In aggregate, the top fifty gold and silver miners by market cap that trade in Canadian and US exchanges have only issued close to $266 million in equity in the last twelve months. That was the second lowest amount of 12-month equity issuance in the last 3 decades. These companies have also just paid down $200 million of debt in the last quarter.

We have also noticed extremely conservative capital spending by miners. Throughout history, the CAPEX cycle for the industry tends to follow gold and silver prices incredibly close. Logically, this makes sense. As metal prices move higher, these businesses become more optimist and therefore focus on advancing their projects. This time, however, even though gold and silver prices have moved significantly higher, companies remain reluctant to spend capital. This level of divergence never happened in prior bull markets for precious metals. This is fundamentally bullish for entire asset class as we expect the supply of gold and silver to stay constrained for longer. It is also fundamentally bullish for Crescat’s activist investment strategy in the industry where we we can deploy capital into undervalued companies with big, highly economic projects that are ripe to move forward in current macro environment.

Precious metals miners have never looked so financially strong. If the industry were a sector, it would have the cleanest balance sheet among all sectors in the S&P 500. The median company in the S&P 500 today has historically high total debt to assets of 35%. Top miners, on the other hand, have only 12%. For such capital-intensive businesses, today’s healthy industry-wide capital structure is nice set-up to kick off a new secular bull market in precious metals mining.

We think it is important to get a sense of the both the value and growth opportunity today to see the incredible appreciation potential ahead of us. When we look at the ratio of gold and silver miners to global equities, it is still is near all-time lows and appearing to form a very bullish base, similar to what we saw back in early 2000s. Mining stocks meanwhile are about to become free cash flow growth machines. Juniors with a large scale, high grade new deposits, carry mind-blowing NPVs and IRRs. It is far and away the industry with the strongest combination of deep value and high growth opportunity for today’s macro environment.

In contrast to the value and growth prospects for miners, it is shocking to see Apple’s market cap still about 3.5 times the size of the entire precious metals industry. If anything, this reflects the level of skewness to the upside for gold and silver stocks in the near and medium term. This is the only industry to truly benefit from today’s world of unlimited QE and deficits.

As we show below, Apple’s stock price appreciated at a much faster growth rate than its underlying free cash flow on a rolling twelve-month, forward-looking basis. The stock price is way ahead of its fundamentals. Apple is just one the many poster children for the manic speculation and excess in today stock market at large. Stocks like Microsoft, Tesla, and Netflix show similar looking disconnect.

With stock market indices making new highs, the narrowing breadth is ominous, especially in the tech-laden NASDAQ Composite.

The valuation of US stocks at large based a combination of eight factors compiled by Crescat is the most over-valued ever. We believe that the stock market is more over-valued than in it was in 1929 and higher than 2000.

To think that the stock market does not have any downside risk because the Fed has its back is absurd. False hope in the Fed’s ability to sustain these market valuations is perhaps the sole remaining illusion holding this market up. If your are in the crowded investor camp that believes easy monetary policy can prevent a market crash this time around because the Fed is engaged in easy monetary policy unlike the Great Depression, do yourself a favor and look up what happened to stock prices and multiples during the 1973-1974 bear market.

Easy monetary policies, as we have shown herein, are much more likely to drive investors out over-valued stocks and into under-valued precious metals. One precious metal that we are most excited about today is silver. Throughout history silver has played an important role in the monetary system. Its recent price surge made a lot of investors question the sustainability of this move, but in the grand scheme of things, silver remains near all-time lows relative to size of the US M2 money supply. The chart below is analytically important as it zooms out the still-early stages of what could be an incredible upsurge.

We have also recently noted that gold prices on a year over year basis just broke out from an over decade-long resistance. This is an important validation of our precious metals’ thesis. In our view, this looks a lot like the beginning of a late 70’s bull market.

Even after the largest liquidity infusion seen in history, equity markets are not only overvalued relative to their fundamentals but also relative to money supply. On the chart below, the S&P 500-to-M2 money supply ratio recently formed a double top from the insane tech bubble levels. It also still it well above peak of the housing bubble. For investors looking for bargains, it is not in the stock market at large. In our view, precious metals are almost solely the place to be today.

How does it all end? Colossal monetary dilution. None of us own enough gold. It is not just the US dollar that will be challenged. It is all the global fiat currencies of highly indebted countries. The Chinese yuan for instance is in an even worse predicament than the US dollar.

Chinese and Hong Kong banks are the most levered financial institutions in the global markets today. Chinese banks hold close to $43 trillion worth of highly inflated assets compared to China’s $14 trillion nominal GDP, an imbalance significantly greater than US and European banking imbalances that precipitated the Global Financial Crisis in 2008. Chronically troubled, the top four Chinese banks have been under pressure for years now and have significantly been diverging to the downside relative to the Chinese stock market at large, similar to US banks in 2007. We believe that China, formerly the growth engine of the global economy responsible for 60% of global GDP from 2009 to 2019, has finally reached credit exhaustion.

All fiat currencies are in a race to the bottom versus gold today. The macro environment is one of global synchronized monetary debasement.

Crescat’s Hedge Funds Top Bloomberg’s Performance Table for July

We are pleased to announce that Crescat’s hedge funds made the top of Bloomberg’s US hedge fund performance table for the second month in a row in July and the third month this year. The table below is from the Bloomberg Weekly Hedge Fund Brief, August 25, 2020, Melissa Karsh, Editor.

The first month that we stood out in the Bloomberg table this year was in March, a month in which the “sell stocks” side of our “buy gold and sell stocks” trade kicked in heavily. We continue to maintain a equity-hedged position in both our global macro and long short funds today: long precious metals mining stocks and pharmaceutical stocks combined with broad shorts of over-valued stocks across many industries and predominantly in the US. We have a substantial gross short-equity position in both of these funds still today to benefit from the re-ignition of the equity bear market that we foresee. It is important to note, that while we are still significantly gross short in both of these funds, but we are no longer “net short” like we were earlier this year because we deliberately became more aggressive on the long precious metals side of the portfolio in March and have allowed that side to grow.

Below see Crescat’s performance by theme for our flagship global macro fund in both the last quarter and last month.

Global Macro Fund Net Profit Attribution: Q2 2020 and July 2020

Note the strong performance of our global fiat debasement theme.

Crescat Firmwide Performance Since Strategy Inception

August Month-to-Date Performance

The Crescat Global Macro and Long/Short funds are up and estimated 5.6% and 6.7% net respectively in August month to date with short positions holding us back will our activist long precious metals positions continue to perform. Our separately managed account strategies are roughly flat MTD.

Crescat Precious Metals Fund

Our new private precious metals focused activist fund that we launched in August is off to an incredibly strong start. The Crescat Precious Metals Fund is up 50%+ net on an estimated basis in its first month to date in August! We are encouraged that we were able to accomplish this in a flat-to-slightly-down overall market for gold and silver stocks in August, which endured a significant pullback mid-month. It is myth that there is no big and profitable new gold deposits to be found on this planet. In this new fund, we are helping to capitalize exciting growth companies with potentially large high grade gold and silver deposits in sound jurisdictions.

You can learn about some of these stocks in our Crescat Gets Activist videos on our YouTube page where we have profiled Condor Resources, Eloro Resources, Eskay Mining, White Rock Minerals, New Found Gold, Novo Resources, Cabral Gold, and NuLegacy Gold.

At Crescat, we are carefully building a diversified portfolio of the best mining properties on the planet with the help of Quinton Hennigh, PhD, a world-renowned exploration geologist who is Crescat’s geologic and technical advisor.

Gold and silver mining stocks have essentially been through a ten-year bear market since peaking in 2011. We believe that the bear market ended with the lows in March of this year, especially for smaller cap, exploration-focused mining companies. These stocks at large successfully held above their early 2016 lows in a double-bottom retest and still represent exceptional value today.

The new precious metals bull is now firmly off and running. Our analysis shows that it is still very early in the cycle as we have laid out herein. Future Fed and global central bank money printing should continue to take the world by storm to prod this bull now more than ever. We encourage you to get positioned now. Just like at the end of last month, we have a handful of new deals already on deck for funding and more coming our way soon. We would appreciate your commitment of capital now to help us seize these outstanding opportunities.We believe that the early investors in this space are the ones who will reap the big rewards. 

what will stop the GOLD bull market? Louis Vincent Gave

via Evergreen gavekal blog

The sustained outperformance of very large-cap tech stocks means that any manager who substantially underweighted the sector has likely lost clients. The exception may be those who favored gold and gold miners, which have experienced a “stealth” bull market (see chart below). I say stealth because the precious metals rally has garnered limited headlines, scant investor interest and fewer reflections on either its causes, or consequences.

The reason that investors focus on tech—and don’t care about gold—is largely down to size, as the “Fab Five” tech stocks make up some 20% of the S&P 500. As a result, tech exposure has dictated relative performance in recent years, and this situation is almost certain to continue; performance will still revolve around the decision of whether, or not, to overweight tech. So given this backdrop, who cares about gold? After all, in spite of a near doubling over the past two years, the total market value of the precious metal mining sector is only about US$550bn—roughly what Amazon has added to its market value this year, or less than a month’s asset purchases by the Federal Reserve.

For now, the market for gold and gold mining stocks tick a number of boxes:

  • Both are showing strong momentum.
  • Unlike tech, both markets are small enough to keep running without hitting the big numbers problem (see Have Equities Become A Bubble?).
  • Neither has become a crowded trade.
  • There has been no rush of secondary placements and IPOs usually seen in gold miner bull markets (as repeated capital destroyers, gold miners normally jump at the chance to push paper down the market’s throat!).
  • Both assets remain a clear diversification choice for investors worried about runaway budget deficits and an unprecedented expansion of monetary aggregates globally, but especially in the US.

In short, precious metals are in a bull market. A concern may be that the gold price is about 12%, or one standard deviation, above its 200-day moving average (see right-hand chart below). But one has to question what will stop this run up. Historically, precious metals tend to “trend”, with both bull and bear markets lasting three years, or more. Indeed, looking back through gold bull markets in the post Bretton Woods era, one finds the following:

  • 1976-80: As inflation rose bonds and equities de-rated, while gold rallied. This changed when US short rates were jacked up to break inflation’s back.
  • 1985-88: The Plaza Accord saw major economies agree to a US dollar debasement. Gold and gold miners thrived in this era, only ending when Germany pulled out of the deal and US real rates started to rise.
  • 2001-11: President George W. Bush’s “guns and butter” policies spurred a weak US dollar. The concurrent rise of emerging markets meant that a new buyer showed up in the gold markets. This ended when the dollar began to strengthen.
  • 2018-?: Deglobalization, high US budget deficits, and surging monetary aggregates seem to have created a new gold bull market. Any breakdown in the US dollar from here will likely push gold higher. Looking at recent history, when gold bull markets get going they usually feed on their own momentum for quite a while and only end when facing (i) higher nominal interest rates, (ii) a stronger US dollar and (iii) a rise in real rates. Hence, consider these threats to the unfolding gold bull market.

Momentum: Gold bull markets may build up over multi-year periods as the metal speaks to the public’s imagination. For millennia, gold has been valued for its beauty, which may explain why it becomes more attractive as its price rises. The new thing—certainly in 2001-11—was most new wealth being created in emerging markets, where investors have a strong cultural affinity for gold. In contrast, the past decade saw most of the world’s wealth created around technology campuses on the US west coast by people with scant interest in the “barbarous relic”. This is interesting, as gold has ripped higher in the past two years in spite of a market consensus that global wealth creation in the coming years will match that of the last decade. In short, gold is showing strong momentum despite emerging markets having broadly been dogs with fleas for a decade. Imagine if the dollar is now done rising and EMs, led by Asia, again thrive. What a tailwind that would be for gold.

Higher nominal rates: It is easier to find an alluring candidate in the US presidential race than an OECD central banker even thinking of raising interest rates in his or her lifetime. Higher nominal interest rates are simply not a threat to the unfolding gold bull market.

Stronger US dollar: The main case for a stronger US dollar is that foreigners spent decades borrowing in the currency and a turnaround in the US’s current account deficit (thanks to its energy boom) will make it hard for foreigners to get dollars and service their debts. Cue a “US dollar short-squeeze” which would see the dollar exchange rate sky-rocket. There are many problems with this theory starting with the fact that—instead of improving—the US current account deficit is actually worsening (US consumers are shoveling ever more dollars offshore). Secondly, rather than rising, the cost of borrowing dollars continues to fall. Thirdly, since the Fed has swap lines with some 15 other key central banks, how can a dollar shortage develop? Moreover, how can dollars be scarce when US M2 is growing at about six times nominal US GDP growth, or 24.5% per annum—an absolute and relative record. Instead, the more interesting question is whether, over the next decade, foreigners find themselves using US dollars more to settle their foreign trade, or less. If less, then that should be structurally bearish for the dollar.

Surging gold supply: A key mantra of commodity investing is that the solution to high commodity prices is high commodity prices, just as the reverse holds true. Yet increases in commodity output, spurred by rising prices, is always lagged (why commodity prices usually trend for five to 10 years). A key question is thus whether the recent gold price rise is enough to trigger big production gains in the coming quarters. The answer is “no”. Rather than pour capital down new holes, gold miners have spent the past year consolidating with record takeover activity seen.

A rise in real rates: The above leaves a rise in real rates as the most credible threat to the unfolding gold bull market. Yet if nominal rates are not going to rise, the only way the US and other OECD countries can experience surging real rates is through an already low inflation rate collapsing more. But how? Energy prices seem to be done falling and labor costs are being supported by government diktat and purchasing power protection schemes. A possible source of future global deflation could be a collapse in real estate prices or alternatively a huge fall in the renminbi. So far, there are few signs of such shocks unfolding and it seems clear that policymakers in both the West and China are intent on stopping such developments. So with this in mind, it seems likely that a surge in real rates is not an immediate threat.

Putting it all together, the odds thus have to be that the stealth gold bull market will continue.

It’s About Jobs, Jobs, Jobs – Doug Noland

The Wall Street Journal referred to a “a milestone” – “a major shift in how [the Fed] sets interest rates by dropping its longstanding practice of preemptively lifting them to head off higher inflation.” The New York Times went with “a major shift in how the central bank guides the economy, signaling it will make job growth pre-eminent and will not raise interest rates to guard against coming inflation just because the unemployment rate is low.” 
The Financial Times underscored a note from Evercore ISI economists: ‘They view the shift as ‘momentous and risk-friendly’, saying it ‘takes the world’s most important central bank beyond the inflation targeting framework that has dominated global monetary policy for a quarter of a century’.” “A revolutionary change to its monetary policy framework” that “could have profound consequences for the price of pretty much everything,” was how it was viewed by the Financial Review.

August 28 – Australian Financial Review (Christopher Joye): “On Thursday night the world’s most powerful central bank – the US Federal Reserve – ushered in a revolutionary change to its monetary policy framework because it believes it has consistently missed its core consumer price inflation target. This new regime, which will allow the Fed to keep borrowing rates lower for longer, and tolerate periods of what would have been unacceptably high inflation, could have profound consequences for the price of pretty much everything. It also reveals the central bankers’ essential conceit: that they don’t want markets to clear, or asset prices to gravitate to their natural levels, in the absence of extreme policymaking interference.”

For the most part, equities took Powell’s Jackson Hole speech in stride. Stocks rose – but they pretty much rise whenever markets are trading. Understandably, bonds were a little edgy. Ten-year Treasury yields rose six bps on the announcement to 0.75%, a 10-week high. Investment-grade corporate debt was under notable pressure. The iShares Investment Grade Corporate Bond ETF declined 0.8%, trading to the low since July 1st (down 1.1% for the week).

There is certainly an element of “the emperor has no clothes” in all this. We know from experiences in Japan, the U.S. and elsewhere that central banks don’t control the inflation rate. The shift to an “inflation targeting” regime was ill-conceived from the start. Rather than admit to mistakes, the global central bank community will continue frantically digging ever deeper holes.

Can we at least admit that inflation dynamics have evolved momentously over recent decades? Could we accept that technology innovation has led to a proliferation of new types of products and related services – profoundly boosting supplies of high-tech, digitized and myriad online products? There has also been the seismic shift to services-based output, altering inflation dynamics throughout economies. Moreover, “globalization” – especially the capacity to manufacture endless low-cost technology components and products globally – has fundamentally changed the inflation axiom “too much money chasing too few goods.”

The above noted factors have placed downward pressure on many prices, altering traditional inflation dynamics and rendering conventional analysis invalid. This contemporary “supply” dynamic has worked to offset significant inflationary pressures in other price levels (i.e. healthcare, education, insurance, housing, and many things not easily produced in larger quantities) – putting some downward pressure on consumer price aggregates (i.e. CPI).

Moving beyond the obvious, can we contemplate that ultra-loose monetary policies work to exacerbate many of the dynamics placing downward pressure on consumer price aggregates? Clearly, the historic global technology arms race is a prime beneficiary – but cheap money-induced over-investment impacts many industries (i.e. shale, alternative energy, autonomous vehicles, etc.). I would further argue monetary-policy induced asset price Bubbles are a powerful wealth redistribution mechanism with far-reaching inflationary ramifications (CPI vs. price inflation for yachts, collectable art and such).

Let’s be reminded that central bank monetary management traditionally operated though the banking system, where subtle changes in overnight funding rates influenced lending along with Credit conditions more generally. Central bankers these days continue to expand this momentous policy experiment in using the financial markets as the primary mechanism for administering policy stimulus.

Why is it reasonable to believe that monetary policy specifically aiming to inflate securities markets will somehow simultaneously ensure a corresponding modest increase in consumer prices? It’s not. As we’ve witnessed for years now – and rather dramatically over recent months – such a policy course foremost fuels asset market speculative excess and price Bubbles.

There’s a strong case to be made that this dynamic pulls finance into the securities markets at the expense of more balanced investment spending throughout the general economy. Moreover, increasingly aggressive policy support (i.e. zero rates, QE and other emergency operations) over time exacerbates speculative excess and associated market distortions. As I posited last September when the Fed employed “insurance” rate cuts and QE with markets at all-time highs, it was throwing gas on a fire.

For now, damage wrought to Fed credibility is masked by record equities and bond prices. In the wanting eyes of the marketplace, the “inflation targeting” regime is mere pretense. Bernanke didn’t punt on the Fed’s “exit strategy” due to consumer prices. Below target CPI was not behind Yellen’s postponing policy normalization in the face of strengthening booms in both the markets and real economy. And Powell didn’t abruptly reverse course in December 2018 because of lagging consumer price pressure, just as CPI had nothing to do with last fall’s “insurance” stimulus measures.

Any lingering doubt the Federal Reserve has adopted a regime specifically targeting the securities markets was quashed with the $3 TN liquidity response to March’s downside market dislocation.

It’s tempting to write, “when future historians look back…” My ongoing commitment to weekly contemporaneous analysis of this is extraordinary period is fueled by the proclivity for historical revisionism (and the associated failure to learn from mistakes). Just this week a Financial Times article stated the Fed’s last September stimulus measures were in response to trade war worries – neglecting to mention the decisive role played by late-cycle “repo” market instability.

That said, I do believe skilled analysts will look back and point to the destabilizing impact of prolonged ultra-loose monetary policies stoking speculative finance, distorted asset price Bubbles, and general Monetary Disorder. The fixation on consumer price indices slightly below target in the face of such historic Bubbles will be a challenge to justify.

I have argued now for a long time that Bubbles and associated maladjustment are the prevailing risks – not deflation (as argued by conventional economists). And the greater Bubbles inflate the greater the risk of collapse unleashing deflationary outcomes.

The Fed has been undertaking a policy review for the past year, with the outcome seemingly preordained. But to announce preference for higher prices and tolerance for persistent above-target inflation in the current backdrop is not without risk. At $7.0 TN, the Fed’s balance sheet has ballooned sevenfold in twelve years. A traditionally conservative central banker would never take a cavalier approach with inflation after an almost $3.0 TN six-month increase in M2 “money” supply.

I’m sticking with the view that we’re in the end game to these multi-decade experiments in finance and monetary management. I understand how $3.0 TN in Fed purchases buys some bond market tolerance. But multi-Trillion federal deficits will not be a one-year phenomenon. The Federal Reserve has accommodated a massive expansion of Treasury securities at ridiculously low yields. Does the Fed really believe it could then accommodate rising inflation without a market backlash? Do they appreciate how an unexpected inflationary surge would wreak absolute havoc in highly leveraged markets and economies?

The Treasury yield curve steepened markedly this week. With 30-year Treasury yields jumping 18 bps to an 11-week high 1.50%, the spread to 3-month T-bill yields rose to 141 bps (wide since June 9th). Ten-year Treasury yields rose nine bps this week to 0.72%, with benchmark MBS yields gaining nine bps to 1.44% (6-wk high).

The dollar index declined 0.9%, nearing the low since May 2018. The Bloomberg Commodities Index jumped 2.3% to the highest level since March. Gold increased 1.3%, and Silver jumped 3.4%. Yet gains were notably broad-based. Copper rose 2.9%, Nickel 4.6%, Aluminum 2.0%, Coffee 5.8%, Corn 5.5%, and Wheat 2.6%. WTI Crude gained 1.5%, trading this week at the high since March.

Equities continue to go nuts. The S&P500 gained 3.3% to an all-time high, increasing y-t-d gains to 8.6%. The Nasdaq100 jumped 3.8% to a new record, boosting 2020 gains to 37.4%. It was another brutal short squeeze week, with popularly shorted stocks again outperforming. The Bloomberg Americas Airlines Index surged 14%, and the J.P. Morgan U.S. Travel Index jumped 8.8%. The NYSE Financial Index rose 4.3%, and the NYSE Arca Computer Technology Index advanced 4.2%. Tesla surged another 8%, pushing its market capitalization to $412 billion.

Ludwig von Mises’ “Crack-up Boom.” The Fed’s new “regime” is major, profound, momentous and more. It’s not the least bit surprising – yet it is nonetheless almost unimaginable to actually witness. The Powell Fed has given up – thrown in the towel. They’ve spent a year essentially crafting rationalization and justification in anticipation of doing little more than executing “money printing” operations for years to come. I have argued they’re trapped – and they have apparently come to the same conclusion. Acute fragility associated with speculative Bubbles and egregious leverage now prohibit any effort to unwind recent extraordinary stimulus, not to mention raising rates or tightening monetary conditions in the foreseeable future.

It’s as sad as it is frightening. Despite the lip service, they’ve deserted the overarching financial stability mandate. Speculative Bubbles are free to run wilder. Leverage – speculative, corporate, federal and otherwise – Completely Unhinged.

Listening to Chairman Powell’s speech, my thoughts returned to Secretary of State James Baker approaching the podium to announce the beginning of the first Iraq war: “The war is about jobs, jobs, jobs.” How would the Bush Administration justify an expensive war in the distant Middle East (removing Saddam Hussein from Kuwait) to the American people? I viewed our government in different light from that moment on.

Chairman Powell: “This change reflects our appreciation for the benefits of a strong labor market, particularly for many in low- and moderate-income communities… The robust job market was delivering life-changing gains for many individuals, families, and communities, particularly at the lower end of the income spectrum.”

August 28 – Bloomberg (Devon Pendleton): “It’s been one of the most lucrative weeks in history for some of the world’s wealthiest people. The net worth of Amazon.com Inc. founder Jeff Bezos topped the once-unfathomable amount of $200 billion. …Elon Musk added the title of centibillionaire when his fortune soared past $100 billion fueled by Tesla Inc.’s ceaseless rally. And by Friday, the world’s 500 wealthiest people were $209 billion richer than a week ago. Musk’s surging wealth expanded the rarefied club of centibillionaires to four members. Facebook Inc. co-founder Mark Zuckerberg, the world’s third-richest person, joined Bezos and Bill Gates among the ranks of those possessing 12-figure fortunes earlier this month. Together, their wealth totals $540 billion…”

The Fed has capitulated on its financial stability mandate as well as the increasingly grave issue of rapidly widening inequality. The Federal Reserve’s culpability for deleterious wealth inequalities and attendant social strife has been exposed. Trapped by financial Bubbles, the Fed will pay only lip service. Actually, it’s worse: Going forward, the Fed will justify precariously loose monetary policies by pointing to its determination to assist the unfortunate.

The entire Federal Reserve system should carefully ponder Powell’s comments following his Jackson Hole speech: “Public faith in large institutions around the world is under pressure. Institutions like the Fed have to aggressively seek transparency and accountability to preserve our democratic legitimacy.”

Bloomberg’s Lisa Abramowicz: “We are getting inflation in certain areas… Certainly asset prices have gotten incredibly inflated and continue to do so on the promise that the Fed will keep rates low. How concerning is this? At what point does this have to make the Fed take stock and raise rates?”

Former New York Fed President Bill Dudley: “I think they are a little bit uncomfortable with the fact that asset prices are so buoyant. But remember that is partly by design. The Fed basically did what they did in March, April, May to try to make monetary policy easy and financial conditions accommodative. And they succeeded. Now as the stock market keeps going up and up and up, that will cause some anxiety about the Fed. But remember, stock markets go up – stock markets go down. The consequences for financial stability have historically actually been pretty modest. We had the stock market crash in 1987. Lots of economists anticipated there’d be a recession. There was no recession. So, I think buoyancy in the stock market is probably less risky to the economy because there’s not a lot of people that use a lot of leverage to own stocks.”

Earth to Dudley: We’re today confronting a deviant financial structure unrecognizable to that from 1987. Have you already forgotten March’s near global financial meltdown? Why did a panicked Fed expand its balance sheet by an unprecedented $3 TN? Why has it capitulated and basically signaled to highly speculative markets that they are committed to looking the other way and just letting things run their course?

I could, once again, invoke the timeworn punch bowl analogy (spiked and overflowing endlessly). It no longer does justice. I was thinking instead of late on Halloween evening when it’s easiest to just fill the big bowl with candies and leave distribution to the trick or treaters. Yet most kids act responsibility, snagging one treat (OK, maybe a couple) and leaving the rest for their fellow treaters. But the thought came to mind of offering a huge bowl filled to the brim with five-dollar bills, with the instruction “Only One Per Family.” It’s a superior metaphor for the Fed’s chosen course – but with the inviting note: “Help Yourself. First Come, First Serve – We’ll Fill the Bowl Whenever It’s Empty.”  

For the Week:

The S&P500 jumped 3.3% (up 8.6% y-t-d), and the Dow rose 2.6% (up 0.4%). The Utilities declined 0.6% (down 7.8%). The Banks surged 5.6% (down 30.9%), and the Broker/Dealers gained 2.7% (up 2.3%). The Transports jumped 3.5% (up 3.9%). The S&P 400 Midcaps rose 1.9% (down 5.6%), and the small cap Russell 2000 gained 1.7% (down 5.4%). The Nasdaq100 advanced 3.8% (up 37.4%). The Semiconductors rose 3.0% (up 22.4%). The Biotechs slipped 0.4% (up 22.4%). With bullion rallying $24, the HUI gold index jumped 3.5% (up 44.1%).

Three-month Treasury bill rates ended the week at 0.095%. Two-year government yields declined two bps to 0.13% (down 144bps y-t-d). Five-year T-note yields added a basis point to 0.27% (down 142bps). Ten-year Treasury yields rose nine bps to 0.72% (down 119bps). Long bond yields surged 18 bps to 1.50% (down 89bps). Benchmark Fannie Mae MBS yields gained nine bps to 1.44% (down 128bps).

Greek 10-year yields increased a basis point to 1.09% (down 34bps y-t-d). Ten-year Portuguese yields rose seven bps to 0.40% (down 4bps). Italian 10-year yields jumped 10 bps to 1.04% (down 37bps). Spain’s 10-year yields gained eight bps to 0.38% (down 9bps). German bund yields jumped 10 bps to negative 0.41% (down 22bps). French yields gained nine bps to negative 0.11% (down 37bps). The French to German 10-year bond spread narrowed one to 30 bps. U.K. 10-year gilt yields jumped 11 bps to 0.31% (down 51bps). U.K.’s FTSE equities index slipped 0.6% (down 20.9%).

Japan’s Nikkei Equities Index dipped 0.2% (down 3.3% y-t-d). Japanese 10-year “JGB” yields gained three bps to 0.06% (up 7bps y-t-d). France’s CAC40 rose 2.2% (down 16.3%). The German DAX equities index gained 2.1% (down 1.6%). Spain’s IBEX 35 equities index advanced 2.2% (down 25.3%). Italy’s FTSE MIB index increased 0.7% (down 15.7%). EM equities were mixed. Brazil’s Bovespa index gained 0.6% (down 11.7%), while Mexico’s Bolsa declined 0.8% (down 13.2%). South Korea’s Kospi index rose 2.1% (up 7.1%). India’s Sensex equities index jumped 2.7% (down 4.3%). China’s Shanghai Exchange added 0.7% (up 11.6%). Turkey’s Borsa Istanbul National 100 index declined 0.8% (down 3.8%). Russia’s MICEX equities index dipped 0.5% (down 2.2%).
Investment-grade bond funds saw inflows of $6.029 billion, and junk bond funds posted positive flows of $1.392 billion (from Lipper).

Freddie Mac 30-year fixed mortgage rates dropped eight bps to 2.91% (down 67bps y-o-y). Fifteen-year rates fell eight bps to 2.46% (down 60bps). Five-year hybrid ARM rates were unchanged at 2.91% (down 40bps). Bankrate’s survey of jumbo mortgage borrowing costs had 30-year fixed rates up six bps to 3.11% (down 109bps).

Federal Reserve Credit last week expanded $10.0bn to $6.975 TN. Over the past year, Fed Credit expanded $3.251 TN, or 87%. Fed Credit inflated $4.164 Trillion, or 148%, over the past 407 weeks. Elsewhere, Fed holdings for foreign owners of Treasury, Agency Debt last week declined $4.1bn to $3.413 TN. “Custody holdings” were down $62.0bn, or 1.8%, y-o-y.

M2 (narrow) “money” supply jumped $46.6bn last week to a record $18.449 TN, with an unprecedented 25-week gain of $2.941 TN. “Narrow money” surged $3.533 TN, or 23.7%, over the past year. For the week, Currency increased $6.3bn. Total Checkable Deposits dropped $80.8bn, while Savings Deposits surged $126bn. Small Time Deposits fell $5.6bn. Retail Money Funds were little changed.

Total money market fund assets declined $4.1bn to $4.540 TN. Total money funds surged $1.176 TN y-o-y, or 35.0%.

Total Commercial Paper rose $4.9bn to $1.012 TN. CP was down $109bn, or 9.7% year-over-year.

Currency Watch:

For the week, the U.S. dollar index declined 0.9% to 92.371 (down 4.3% y-t-d). For the week on the upside, the Brazilian real increased 4.3%, the South African rand 3.4%, the New Zealand dollar 3.1%, the Australian dollar 2.9%, the British pound 2.0%, the Swedish krona 2.0%, the Norwegian krone 1.9%, the Singapore dollar 1.0%, the Mexican peso 1.0%, the euro 0.9%, the Swiss franc 0.8%, the Canadian dollar 0.6%, the Japanese yen 0.4% and the South Korean won 0.2%.

Commodities Watch:

The Bloomberg Commodities Index jumped 2.3% (down 9.6% y-t-d). Spot Gold rose 1.3% to $1,965 (up 29.4%). Silver surged 3.4% to $27.79 (up 55.1%). WTI crude gained 63 cents to $42.97 (down 30%). Gasoline rose 2.4% (down 22%), and Natural Gas surged 8.5% (up 21%). Copper jumped 2.9% (up 8%). Wheat rose 2.6% (down 2%). Corn surged 5.5% (down 7%).

Coronavirus Watch:

August 28 – Bloomberg (Riley Griffin and Jeannie Baumann): “A U.S. health official said Friday that hundreds of thousands of doses of coronavirus vaccines have already been manufactured in hopes that at least one of the candidates might succeed in clinical trials. The Trump administration’s ‘Operation Warp Speed’ program has reached agreements for eight coronavirus vaccine candidates that are in various stages of development, none of which have yet been approved or authorized for use.”

Market Instability Watch:

August 28 – Bloomberg (Katherine Greifeld and Liz McCormick): “Traders across major asset classes are sending the same message: Prepare for what could be the most-contentious U.S. presidential elections in decades. One measure of hedging in the stock market is higher than at any point in the past three presidential elections. In the interest-rates market, implied volatility is well above levels reached in 2016 or 2012. And three-month implied volatility in the dollar-yen pair — a classic haven trade — has risen above the two-month tenor by the most in two decades, signaling demand for protection from turbulence near Election Day. Trades protecting against election-induced volatility have been around all year, with ‘unprecedented’ levels of hedging seen as early as January.”

August 27 – Reuters (Tom Arnold and Karin Strohecker): “Reserves are running out for several emerging markets as governments from Belize to Zambia use up their financial firepower to fight the coronavirus crisis. The problem is particularly acute for those burning through reserves to tackle additional challenges, from sliding economies to a shortfall in commodity or oil revenues. Among the larger emerging markets, Turkey stands out, having seen its gross foreign exchange reserves nearly halve this year as it sought to defend its currency. But it is the smaller and riskier developing economies – so-called frontier markets – that are feeling the heat most…”

August 23 – Bloomberg (Marcus Wong and Livia Yap): “If the recent spike up in U.S. inflation numbers is a sign of things to come for global markets, that could prove especially bad news for investors in Indian, Russian and Mexican bonds. The fixed-income securities of the three countries appear the most vulnerable to any surge in consumer prices, according to a Bloomberg study of 10 emerging markets. Their real bond yields — those adjusted for inflation — are the lowest in the group versus their three-year average.”

August 27 – Bloomberg: “As a wave of global liquidity pushes assets ever higher, in China the opposite is occurring. Borrowing costs in the world’s second-largest economy are spiking, driving down bonds and stocks, as the central bank holds back on aggressive easing. While the People’s Bank of China has stepped up actions to mitigate the liquidity shortage, injecting the most funds this month since January, that’s done little to alleviate the relative drought. A gauge of interbank borrowing costs is close to a six-month high and an indicator of liquidity tightness in the foreign-exchange market has touched its highest level since 2017. The yield on 10-year government debt is above 3%, approaching a record gap with Treasuries…”

August 24 – Bloomberg (Joanna Ossinger): “Investors can no longer rely on bonds to help mitigate equity risk because the relationship between assets has broken down, according to Credit Suisse… The 21-day correlation between the S&P 500 Index and 10-year Treasury yield turned negative on Aug. 21, after having been at nearly 0.80 in mid-July. ‘The breakdown in that correlation, alongside record low rate volatility, suggests bonds are no longer an effective diversifier of equity risk,’ Mandy Xu, derivatives strategist, wrote… ‘We recommend investors look at equity-specific hedges instead, especially with the normalization in equity volatility.’”

August 23 – Wall Street Journal (Paul Vigna): “The price/earnings ratio on the S&P 500, measured against the past 12 months of earnings, stands at 25.26, according to FactSet. That is the highest level since 2002. The forward P/E, measured against earnings expectations for the next year, is at 25.98—a mark last hit in September 2000. And the valuation of the median stock in the S&P 500, measured by forward P/E, is now in the 100th percentile of historical levels, according to Goldman Sachs…, going back four decades—the highest level possible. The index itself is trading at the 98th percentile.”

August 24 – Bloomberg (Alan Mirabella): “The Federal Reserve has created a speculative bubble that has pushed debt levels beyond what the U.S. economy can support, Leon Cooperman said. ‘They have created a real speculative environment,’ Cooperman said… ‘I am uncomfortable at the present time, not because of the virus, because I’m focused on something the market isn’t focused on. And that is the amount of debt that’s being created. Who pays for the party when the party is over?’ It took the U.S. ‘244 years to go from zero national debt to $21 trillion,’ he said. ‘We will probably end this year with $27 trillion. That’s a growth rate in debt far in excess of what the economy is growing at and I think that’s going to be a problem down the road.’”

Global Bubble Watch:

August 25 – Bloomberg (Zoe Schneeweiss): “Global trade surged in June as governments started to reopen their economies from strict lockdowns earlier in the year. There was growth in almost all countries, according to CPB World Trade Monitor, after huge declines in the previous three months. Even after the 7.6% jump in June, trade was down 12.5% in the second quarter, with the headline index at the lowest since 2014.”

August 26 – Bloomberg (Björn van Roye): “Economic activity fell faster and deeper in emerging markets than in advanced economies as the Covid-19 shock hit, and the recovery is proving slower and shallower. Activity in emerging markets excluding China remained 33% below the pre-virus level at the end of August, according to Bloomberg Economics gauges that integrate high-frequency data such as credit-card use, travel and location information. China, Russia, Turkey and Brazil have made the most progress, while the rate of recovery in major Latin American countries — particularly in Argentina and Colombia — has been much slower and has recently declined further.”

August 24 – Reuters (Scott Murdoch and Patturaja Murugaboopathy): “Companies raised the most funds in global equity and debt markets for the month of August in a decade as homebound bankers spend their summer fixing deals off the back of trillions of dollars of stimulus worldwide to fight the coronavirus pandemic. Companies have raised $65.5 billion through initial public offerings (IPOs) and high-yield bond issuances globally so far in August, the highest for that month in at least 10 years, according to Refinitiv… They raised $98.6 billion in July and $126.5 billion in June, which was the highest in 20 years. It comes as governments and central banks have made at least $15 trillion of stimulus available to help economies withstand the fallout of the coronavirus pandemic.”

August 23 – Reuters (Marc Jones): “The coronavirus crisis will see the world’s biggest firms slash dividend payouts between 17%-23% this year or what could be as much as $400 billion, a new report has shown, although sectors such as tech are fighting the trend. Global dividend payments plunged $108 billion to $382 billion in the second quarter of the year, fund manager Janus Henderson has calculated, equating to a 22% year-on-year drop which will be the worst since at least 2009.”

Trump Administration Watch:

August 26 – Reuters (Susan Heavey, Idrees Ali, Daphne Psaledakis, Raphael Satter and David Brunnstrom): “The United States… blacklisted 24 Chinese companies and targeted individuals it said were part of construction and military actions in the South China Sea, its first such sanctions move against Beijing over the disputed strategic waterway. The U.S. Commerce Department said the two dozen companies played a ‘role in helping the Chinese military construct and militarize the internationally condemned artificial islands in the South China Sea.’ Separately, the State Department said it would impose visa restrictions on Chinese individuals ‘responsible for, or complicit in,’ such action and those linked to China’s ‘use of coercion against Southeast Asian claimants to inhibit their access to offshore resources.’”

August 26 – Wall Street Journal (Kate O’Keeffe and Chun Han Wong): “The U.S. unveiled a set of visa and export restrictions targeting Chinese state-owned companies and their executives involved in advancing Beijing’s territorial claims in the contested South China Sea, a new challenge to China involving the strategic waters. Wednesday’s actions by the State and Commerce departments apply to a range of state-owned enterprises, including units of China Communications Construction Co., a leading contractor for Chinese leader Xi Jinping’s Belt and Road initiative to develop infrastructure and trade links across Asia, Africa and beyond. The U.S. added 24 Chinese companies active in the South China Sea… to a Commerce Department list that restricts American companies from supplying U.S.-origin technology to them without a license.”

August 26 – Reuters (Richard Cowan and Bhargav Acharya): “Republicans in the U.S. Congress are working on a narrow coronavirus stimulus bill that could be circulated to rank-and-file lawmakers as soon as this week… For weeks now, Republicans and Democrats have been deadlocked over the size and shape of a fifth coronavirus-response bill, on top of the approximately $3 trillion already enacted into law.”

August 24 – Bloomberg (James Clark): “As the U.S. Treasury Department’s Deputy Assistant Secretary for Federal Finance during the Obama administration, I spent a lot of time talking to the major buyers of our nation’s debt. When I left my job overseeing the government’s finances in 2017, the unpaid tab for the first 240 years of the ‘American Experiment’ was $20 trillion. In less than four years, that number has risen to $26.5 trillion, the result of essential outlays on pandemic relief and completely non-essential tax cuts for the wealthy.”

Federal Reserve Watch:

August 26 – Bloomberg (Steve Matthews): “Federal Reserve Bank of Kansas City President Esther George, who has been among the most hawkish Fed policy makers, doesn’t oppose some overshooting of the central bank’s 2% inflation target and sees more risk of price pressures being too weak than too strong. ‘I have never thought of 2% as a ceiling but to really stay focused on what anchors inflation expectations in the economy,’ George said… ‘From a communications standpoint, I think we will be talking about the kinds of things that help us do a better job of achieving our objectives.’”

August 26 – Wall Street Journal (Greg Ip): “In a much-anticipated speech this week, Federal Reserve Chairman Jerome Powell is expected to lay out a new framework for meeting its often-elusive goal of 2% inflation. When he’s done, he should keep his jacket on, because a proliferation of other missions await. Full employment and low inflation are no longer enough. In recent years the Fed has been asked to prevent financial crises, shrink the trade deficit, tackle climate change and, now, eliminate racial economic disparities. Mission creep poses real risks. The Fed is being asked to meet goals for which its tools are poorly suited and often in conflict.”

August 26 – Bloomberg (Rich Miller): “The Federal Reserve looks likely to keep short-term interest rates near zero for five years or possibly more after it adopts a new strategy for carrying out monetary policy. The new approach… is likely to result in policy makers taking a more relaxed view toward inflation, even to the point of welcoming a modest, temporary rise above their 2% target to make up for past shortfalls… ‘I wouldn’t be surprised if interest rates are still zero five years from now,’ said Jason Furman, a former chief White House economist and now Harvard University professor.”

U.S. Bubble Watch:

August 25 – Associated Press (Martin Crutsinger): “U.S. consumer confidence fell for the second consecutive month, sinking to the lowest levels in more than six years as a resurgence of COVID-19 infections in many parts of the country heightened pessimism. The Conference Board… reported… its Consumer Confidence Index declined to a reading of 84.8 in August, the lowest level since May 2014. The drop, which followed a July decline to 91.7, put the index 36% below its high point for the year reached in February… ‘Consumer confidence has now taken two steps back after one giant step forward in June,’ said Jim Baird, chief investment officer at Plante Moran Financial Adisors. ‘Initial hopes for a faster return to a pre-pandemic normal have faded.’”

August 27 – CNBC (Fred Imbert): “The number of Americans who filed for unemployment benefits for the first time came in above 1 million for the 22nd time in 23 weeks as the economy struggles to recover from the coronavirus pandemic… Initial U.S. jobless claims totaled just over 1 million for the week ending Aug. 22, down from 1.104 million in the previous week… Continuing claims… fell by 223,000 to 14.535 million for the week ending Aug. 15.”

August 25 – Bloomberg (Prashant Gopal): “New-home sales in the U.S. jumped to the highest level in almost 14 years in July as low mortgage rates helped fuel a suburban construction boom. Purchases of new single-family houses climbed 13.9% from June to a 901,000 annualized pace from an upwardly revised 791,000… The median forecast… called for a 790,000 rate of sales. The median selling price rose 7.2% from a year earlier to $330,600… ‘It has been a rocket ship up since May,’ said Rick Palacios, director of research at John Burns Real Estate Consulting… ‘Demand is insatiable right now.’”

August 25 – CNBC (Diana Olick): “Home prices rose 4.3% annually in June, unchanged from the gain seen in May, according to the S&P CoreLogic Case-Shiller U.S. National Home Price NSA Index… The 10-City Composite increased 2.8% annually, down from 3% in the previous month. The 20-City Composite rose 3.5% year over year, down from 3.6% in the previous month.”

August 25 – CNBC (Kevin Stankiewicz): “Global investor Barry Sternlicht told CNBC… he believes masses of people are moving away from major U.S. cities in favor of the suburbs. ‘There’s hundreds of thousands of people looking for suburban homes, and I would say it’s not as driven by the Covid situation as it is safety and law and order, and that is now pervasive across the big cities of the United States, sadly,’ Sternlicht said…”

August 24 – Bloomberg (Ben Holland, Enda Curran, Vivien Lou Chen and Kyoungwha Kim): “There’s hardly any question that carries greater weight in economics right now, or divides the financial world more sharply, than whether inflation is on the way back. One camp is convinced that the no-expense-spared fight against Covid-19 has put developed economies on course for rising prices on a scale they haven’t seen in decades. The other one says the virus is exacerbating the conditions of the past dozen years or so — when deflation, rather than overheating, has been the big threat. The debate touches every area of policy, from trade rivalries to unemployment benefits, and everyone has an interest in the outcome. Governments and central banks may face pressure to curtail their pandemic relief efforts, already worth some $20 trillion according to Bank of America, if they trigger a spike in prices. Workers and consumers will see the impact in wage packets and household bills. More than $40 trillion of retirement savings is at risk of erosion if inflation returns.”

August 22 – Financial Times (Chris Flood): “Coronavirus, disappointing investment returns and declining interest rates, pose a triple threat to the health of the US public pension system, which is haemorrhaging cash and heading for a record funding shortfall. The total funding gap for the 143 largest US public pensions plans is on track to reach $1.62tn this year, significantly higher than the $1.16tn recorded in 2009 in the aftermath of the global financial crisis, according to Equable Institute… The weak financial condition of the US public pension systems poses severe risks for the living standards of millions of employees and retired workers.”

August 25 – Reuters (Pete Schroeder): “U.S. bank profits were down 70% from a year prior in the second quarter of 2020 on continued economic uncertainty driven by the coronavirus pandemic… Bank profits remained small as firms build up cushions to guard against future losses and business and consumer activity dropped, according to the Federal Deposit Insurance Corporation. Bank deposits climbed by over $1 trillion for the second straight quarter, and the regulator said the industry has ‘very strong” capital and liquidity levels.’”

August 26 – Reuters (Tom Wilson): “It sounds like a surefire bet. You lend money to a borrower who puts up collateral that exceeds the size of the loan, and then you earn interest of about 20%. What could possibly go wrong? That’s the proposition presented by ‘DeFi’, or decentralised finance, peer-to-peer cryptocurrency platforms that allow lenders and borrowers to transact without the traditional gatekeepers of loans: banks. And it has exploded during the COVID-19 crisis. Loans on such platforms have risen more than seven-fold since March to $3.7 billion…”

August 25 – Associated Press (Don Thompson and Haven Daley): “California’s firefighting agency is in talks with the National Guard and California Conservation Corps about providing reinforcements as an already devastating wildfire season threatens to get even worse… ‘Historically it’s September and October when we experience our largest and our most damaging wildfires. So to be in the middle of August and already have the second- and the third-largest wildfires in our state’s history is very concerning to us,’ Daniel Berlant, chief of wildfire planning and engineering at the California Department of Forestry and Fire Protection, said…”

August 23 – Wall Street Journal (Jimmy Vielkind and Katie Honan): “New York City faces a $9 billion deficit over the next two years, high levels of unemployment and the prospect of laying off 22,000 government workers if new revenue or savings aren’t found in the coming weeks. The growing economic crisis, brought on by the coronavirus pandemic, has alarmed New York Gov. Andrew Cuomo so much that he recently asserted greater control over a panel overseeing the finances of the nation’s largest city. Earlier this summer, Mr. Cuomo appointed three close allies to the New York State Financial Control Board. The board played a prominent role during the city’s last fiscal crisis in the 1970s, when it wielded broad legal power over the city’s budget and made difficult spending decisions.”

Fixed Income Watch:

August 24 – Bloomberg (John Gittelsohn): “Some of the largest real estate investors are walking away from debt on bad property deals, even as they raise billions of dollars for new opportunities borne of the pandemic. The willingness of Brookfield Property Partners LP, Starwood Capital Group, Colony Capital Inc. and Blackstone Group Inc. to skip payments on commercial mortgage-backed securities backed by hotels and malls illustrates how the economic fallout from the coronavirus has devalued some real estate while also creating new targets for these cash-loaded investors. ‘Just because a prior investment didn’t work out doesn’t necessarily mean that should tarnish the reputation for future endeavors,’ said Alan Todd, head of U.S. CMBS research for Bank of America Securities. ‘It’s not like something was done in bad faith.’”

August 26 – Bloomberg (John Gittelsohn): “U.S. commercial real estate prices are falling as the economic toll of the Covid-19 pandemic worsens — and the decline is just getting started. Indexes for office, retail and lodging properties all slipped year-over-year in July, data from… Real Capital Analytics Inc. show. Transaction volume plummeted to $14 billion across all sectors, down 69% from July 2019. ‘The worst is yet to come,’ Real Capital Senior Vice President Jim Costello said… ‘We’re not seeing the fallout yet of owners selling properties and taking a loss.’”

August 25 – Bloomberg (John Gittelsohn): “More than $54.3 billion in U.S. commercial mortgage backed securities have been transfered to loan workout specialists mostly because of payment delinquencies, a 320% increase since the start of the Covid-19 pandemic, according to Moody’s… Hotel and retail properties, the sectors hit hardest by restrictions on travel and public gatherings to reduce virus transmissions, make up the vast majority of the debt transferred to special servicers… The rate of severely delinquent loans — more than 121 days late — nearly tripled in August, jumping to 2.3% from 0.8% in July.”

China Watch:

August 25 – Reuters (Meg Shen, Ben Blanchard and Idrees Ali): “China has lodged ‘stern representations’ with the United States, accusing it of sending a U.S. U-2 reconnaissance plane into a no-fly zone over Chinese live-fire military drills…, further ratcheting up tensions between Beijing and Washington. China has long denounced U.S. surveillance activities, while the United States has complained of ‘unsafe’ intercepts by Chinese aircraft… China’s Defence Ministry said the U-2 flew without permission over a no-fly zone in the northern military region where live fire drills were taking place, ‘seriously interfering in normal exercise activities’.”

August 24 – Reuters (Roxanne Liu and Tony Munroe): “China said… it agreed with the United States to continue pushing forward the implementation of the bilateral Phase 1 trade deal reached earlier this year during a call between the two countries’ top trade negotiators. Vice Premier Liu He spoke with U.S. Trade Representative Robert Lighthizer and Treasury Secretary Steven Mnuchin… The two sides had constructive talks on the trade deal and strengthening macroeconomic policy coordination, the ministry said.”

August 23 – Bloomberg: “China’s fragile economic recovery is ushering in a dangerous new phase for the nation’s $4.1 trillion corporate bond market. With the economy now strong enough for policy makers to dial back financial support but still too weak to save the most distressed borrowers, some fund managers are bracing for defaults on domestic Chinese debt to hit record highs this year. Delinquencies have already started rising after a remarkably quiet second quarter, and pressure on borrowers is set to grow as 3.65 trillion yuan ($529bn) of notes mature by year-end.”

August 25 – Financial Times (Christian Shepherd): “An intensifying purge of disloyal Chinese Communist party law and order officials is setting the stage for President Xi Jinping to become party chairman and hold on to power beyond his second term, experts have warned. The anti-corruption campaign launched last month to target the party’s legal and domestic security apparatus kicked into a higher gear last week when the Central Commission for Discipline Inspection announced a probe into Gong Daoan, the Shanghai police chief and the highest-ranking official to fall since Mr Xi’s second term began in 2017. Officials have signalled the importance of the campaign by insisting it must channel the spirit of the ‘Yan’an rectification movement’ launched by Mao Zedong in 1941, the first big purge in the party’s history. “

August 24 – Wall Street Journal (Xie Yu and Mike Bird): “Financial stress at an upmarket developer is rattling Chinese families who paid big deposits for unbuilt homes—showing the risks in presales, one of the sector’s favorite funding tools in China. China’s real-estate firms have grown more reliant on customer down-payments as authorities have curbed access to other kinds of credit. In many cases, clients pay the full price for their home before it is built, handing over a lump sum and borrowing the rest from the bank, and the developer uses the cash as general funding for operations.”

August 24 – Bloomberg (Manuel Baigorri): “Chinese buyers have not only stopped snapping up iconic overseas assets, the coronavirus pandemic is ravaging the targets of deals that defined a headier era. Whereas some prolific acquirers such as HNA Group Co. and Anbang Insurance Group Co. began falling into disarray before the recent crisis, the impact on investments in sectors hit hardest by the outbreak means healthier owners are now feeling the pain. Conglomerate Fosun International Ltd. could soon see its 2015 investment in Cirque du Soleil Entertainment Group wiped out… Baggage handler Swissport International AG is also negotiating with investors over a rescue that could see HNA exit the cash-strapped firm it bought in 2015… At $15.1 billion, the volume of Chinese outbound M&A so far this year represents a 25% drop from a year earlier and a far cry from the peak in 2016…”

August 24 – Bloomberg: “China’s mega banks are ramping up their recruitment of fresh graduates as a record number enter the labor market, joining other state-owned firms in boosting employment even as lenders deal with plunging earnings and ballooning bad debt.”

EM Watch:

August 26 – Reuters (Anthony Esposito and Miguel Angel Gutierrez): “Mexico’s economy could contract by almost 13% this year, the central bank warned…, after GDP data showed the pandemic lockdown had thrown the country into the deepest slump since the Great Depression… Gross domestic product fell 17.1% in seasonally adjusted terms in the April-June period from the prior quarter…”

August 27 – Financial Times (Bryan Harris): “Brazil’s government is under increasing pressure to loosen or lift a constitutionally mandated spending cap, alarming investors who fear a sharp deterioration in the country’s fiscal position. Since its creation in 2016, the spending cap has been a fiscal anchor for Latin America’s largest economy. But it is under attack from forces both inside and outside the government, which want to spend in order to boost the economy, or Mr Bolsonaro’s popularity. The debate has spooked the country’s business community, which fears a looming fiscal crisis would trigger an exodus from Brazilian assets, weaken the exchange rate, spur inflation and generate instability.”

August 24 – Financial Times (Michael Stott): “Brazil and Mexico are leading Latin America out of a deep coronavirus-induced slump but chronic economic weaknesses will keep the region as the worst performer in the developing world. Latin America has been the global epicentre of the pandemic since early June, accounting for more than 40% of the world’s new Covid-19 deaths despite having only 8% of the population. The scale of the crisis has dealt a huge blow to already sickly economies. While Brazil and Mexico took a more laissez-faire approach to coronavirus, most of Latin America’s other economies were crippled by strict lockdowns lasting far longer than those in Europe or Asia.”

August 26 – Financial Times (Jonathan Wheatley): “Just like other risky assets around the world, emerging market bond and equity prices have snapped back into shape since the huge crisis-fighting injection of liquidity from the US and eurozone central banks in March. EM economies are likely to be hardest hit by the pandemic, but on aggregate, asset prices are close to the levels they held before the panic selling set in. ‘If you look at the fundamentals of many EMs and then look at the yields, you have to say something doesn’t add up,’ said Claudio Irigoyen, economist and fixed-income strategist at Bank of America… ‘For that to make sense, you have to add in that the [US Federal Reserve] and the European Central Bank are the buyers of last resort of all risky assets and [rely on] the perception that nothing can go wrong.’”

August 26 – Bloomberg (Dana Khraiche): “Lebanon suffered another dramatic inflation surge in July as the country’s financial meltdown continued with no end in sight. Consumer prices rose an annual 112.4%, compared with just under 90% in June… The cost of food and non-alcoholic beverages rose just over 336% compared with last year. Prices of housing, water, electricity, gas and other fuels rose only an annual 11.6% because the government has maintained subsidies for petroleum products.”

Europe Watch:

August 24 – Financial Times (Tommy Stubbington): “Banks in the eurozone are so awash with cheap cash from the European Central Bank that they no longer want to borrow from each other, in a striking reversal of the signs of stress in money markets in the spring. Three-month Euribor… has sunk to an all-time low of minus 0.49% in recent days. The plunge in borrowing rates comes after eurozone lenders took more than €1.3tn in cheap loans from the ECB in June… ‘You have a central bank that’s absolutely relentless in providing cheap liquidity,’ said Peter Schaffrik, a strategist at RBC Capital Markets. ‘That drives down lending rates across the board.’”

August 27 – Reuters (Balazs Koranyi): “Euro zone companies continued to tap bank credit in July, although lending growth slowed since the height of the coronavirus crisis… Lending growth to non-financial corporations in the 19-country euro zone expanded by 7.0% in July compared with a year earlier…”

Japan Watch:

August 28 – Bloomberg (Isabel Reynolds and Lily Nonomiy): “Japanese Prime Minister Shinzo Abe said he would resign to undergo treatment for a chronic illness, ending his run as the country’s longest serving premier in an announcement that surprised some members of his party. Abe confirmed reports that he was dealing with ulcerative colitis, a chronic digestive condition that also forced him to step down as premier in 2007. He said he would stay on until leaders of his Liberal Democratic Party hold an internal vote to pick a successor…”

Leveraged Speculation Watch:

August 25 – Financial Times (Laurence Fletcher and Richard Henderson): “Hedge funds that bet on market volatility have turned out to be some of the biggest losers from the financial turmoil that struck in March. Volatility hedge funds, which buy and sell derivatives to try and profit from the volatility of stocks, bonds and currencies, lost 2.4% this year to July… That compares with an average 0.3% loss among hedge funds more broadly, and a 2.4% return from the S&P 500 index. The stumble shows how painful it can be to assume a long period of calm will continue. Betting against flare-ups in markets, or shorting volatility, as many of these funds had done, can prove costly in a shock.”

Geopolitical Watch:

August 27 – Reuters (Ben Blanchard): “The risk of accidental conflict is rising because of tension in the South China Sea and around Taiwan and communication must be maintained to reduce the risk of miscalculation, Taiwan President Tsai Ing-wen said… ‘The risk of conflict requires careful management by all the parties concerned. We expect and hope that Beijing will continue to exercise restraint consistent with their obligations as a major regional power,’ Tsai told a forum…”

August 26 – Reuters (Ben Blanchard and Yew Lun Tian): “Numerous Chinese and U.S. military exercises, Taiwan missiles tracking Chinese fighters and plummeting China-U.S. ties make for a heady cocktail of tension that is raising fears of conflict touched off by a crisis over Taiwan. In the last three weeks, China has announced four separate exercises along its coast, from the Bohai Gulf in the north to the East and Yellow Seas and South China Sea, along with other exercises it said were aimed at ‘the current security situation across the Taiwan Strait’. Meanwhile Taiwan, claimed by China as its ‘sacred’ territory, said its surface-to-air missiles had tracked approaching Chinese fighters – details Taiwan does not normally give – as U.S. Health Secretary Alex Azar was visiting the island this month.”

August 24 – Financial Times (Zhou Bo): “The relationship between China and the US is in freefall. That is dangerous. US defence secretary Mark Esper has said he wants to visit China this year, which shows the Pentagon is worried. That Wei Fenghe, China’s defence minister, spoke at length with Mr Esper in August shows that Beijing is worried too. Both men have agreed to keep communications open and to work to reduce risks as they arise. The crucial question is: how? In July, US secretary of state Mike Pompeo inverted a famous line of Ronald Reagan’s about the Soviet Union and applied it to China: ‘trust but verify’ became ‘distrust but verify’. Washington suspects that an increasingly coercive China wants to drive the US out of the Indo-Pacific. Beijing meanwhile believes that the US, worried about its global primacy, has fully abandoned its supposed neutrality on the South China Sea. Haunted by economic recession and the pandemic, and desperate for re-election, President Donald Trump has also made confronting China his last-straw strategy to beat his opponent, Joe Biden. The risk of a mistake is therefore high.”

August 26 – Bloomberg: “China’s latest volley of missile launches into the world’s most hotly contested body of water served as a warning to two key U.S. targets: aircraft carriers and regional bases. The missiles launched into the South China Sea… included the DF-21D and DF-26B, the South China Morning Post reported, citing a person close to the People’s Liberation Army. Those weapons are central to China’s strategy of deterring any military action off its eastern coast by threatening to destroy the major sources of U.S. power projection in the region.”

August 26 – South China Morning Post (Kristin Huang): “China launched two missiles, including an ‘aircraft-carrier killer’, into the South China Sea on Wednesday morning, a source close to the Chinese military said, sending a clear warning to the United States. The move came one day after China said a US U-2 spy plane entered a no-fly zone without permission during a Chinese live-fire naval drill in the Bohai Sea off its north coast. One of the missiles, a DF-26B, was launched from the northwestern province of Qinghai, while the other, a DF-21D, lifted off from Zhejiang province in the east.”

August 27 – Financial Times (Kathrin Hille, Christian Shepherd and Emma Zhou): “Military tension between Washington and Beijing is surging after China launched missiles capable of hitting US warships and military bases into the disputed South China Sea. The People’s Liberation Army on Wednesday ‘fired four medium-range missiles into [an] area between Hainan and the Paracel Islands,’ said a US military official… Another US military official said the launch included a Dongfeng-21D, an anti-ship missile built to threaten US aircraft carriers, and several Dongfeng-26B medium-range missiles, known as the ‘Guam express’ because they can reach air force and naval bases in the US Pacific territory.”

August 26 – Reuters (Idrees Ali and Phil Stewart): “U.S. troops in Syria were wounded this week when a Russian military patrol slammed into their vehicle, U.S. officials said…, as Washington condemned the incident as a violation of safety protocols agreed with Moscow. Two officials, speaking on condition of anonymity, said several U.S. troops suffered concussive symptoms following the incident.”

August 24 – Reuters (Ezgi Erkoyun and Tuvan Gumrukcu): “President Tayyip Erdogan said… Turkey’s navy will not back down as Greece ‘sows chaos’ in the eastern Mediterranean Sea, where the countries have deployed frigates in an escalating rhetorical confrontation over overlapping resource claims. ‘The ones who throw Greece in front of the Turkish navy will not stand behind them,’ Erdogan said…”

August 26 – Financial Times (Laura Pitel): “Turkey will make no concessions in the eastern Mediterranean, President Recep Tayyip Erdogan declared as France announced that it would join naval exercises in the region amid a mounting stand-off over hydrocarbons. …Mr Erdogan warned that Turkey would do ‘whatever is politically, economically and militarily necessary’ to protect its rights. Turkey ‘will take whatever it is entitled to’ in the Mediterranean and other maritime regions, he said, adding: ‘Just as we do not covet anyone else’s territory, sovereignty or interests, we will never make concessions on what belongs to us.’”

August 27 – Financial Times (Henry Foy and James Shotter): “Russia has created a reserve police force for use in neighbouring Belarus on the request of its embattled strongman leader, President Vladimir Putin said, warning that he would deploy it across the border if protests in the country turn violent. The show of support for President Alexander Lukashenko came with a reiterated warning from Mr Putin that western countries should refrain from attempting to influence the situation in Belarus. It is almost three weeks since mass protests against Mr Lukashenko’s 26-year regime erupted after he was declared the winner of his sixth consecutive presidential election…”
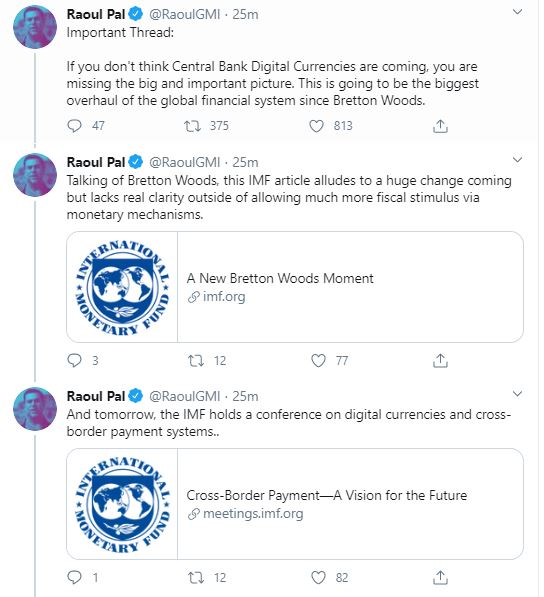
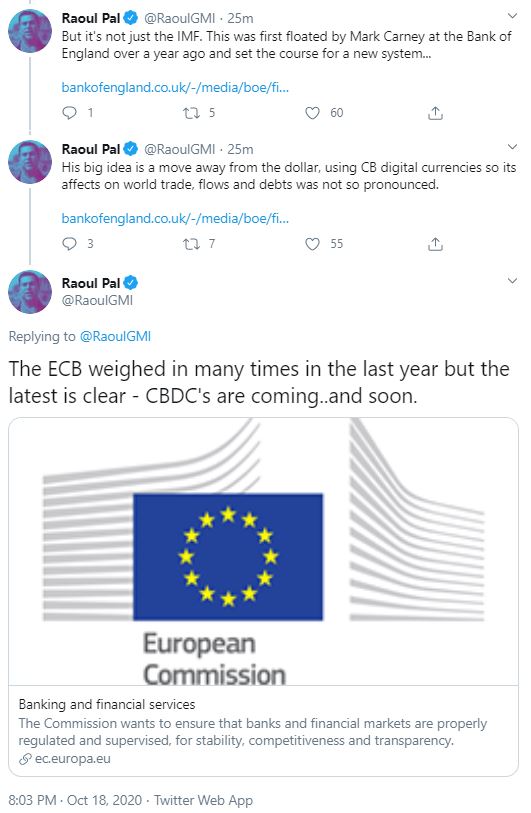
In search of a budget constraint

by Athansios Vamvakidis currency strategist Bank of America

First, Covid-19 infections continue to increase in Europe in recent weeks, reaching a new re-opening peak last week. We have been concerned that reopening will lead to higher infections, in Europe and everywhere else. The trade-offs between going back to normal and containing Covid-19 are clear to us.

Second, the Eurozone August PMIs dropped, confirming our view that the initial rebound was simply from base effects after the lockdown and that the cleaner data from now on will reflect a weaker recovery and output well below pre-crisis levels. US data has also started weakening, with our economists expecting further slowing this fall.

Third, markets were disappointed by the FOMC minutes last week, just because they were not dovish enough. The minutes told us that Fed policies would be outlook-dependent. However, the consensus was looking for a strong, unconditional dovish message. Effectively, markets are pricing both loose monetary policies and a strong recovery, which we have been arguing is not realistic.

US equities were back to an all-time high last week, with equities in the rest of the world also recovering strongly, before these red flags caused a pause in risk assets. In the meantime, there is no fiscal deal yet in the US, with some benefits already expiring. The bottom line we see is that the real economy remains weak and fragile, while macro policy support has its limits, but markets are optimistic on both fronts.

MMT to the rescue

Even if the real economy is weak and the recovery from the pandemic looks nothing like a V or a U, what prevents fiscal and monetary policies to keep supporting risk assets? By any measure, real output is well below pre-crises levels today and forecasts suggest it will remain so well into next year, if not the year after. And yet, global equities have almost fully recovered. In the meantime, deflation and not inflation is the risk today. What prevents more fiscal policy stimulus, funded by more money printing? And wouldn’t central banks keep policy rates low for as long as necessary, to help governments deal with the massive debts they are accumulating? Effectively, this is what markets are pricing in our view.

And why stop there? Is supporting the economy after a shock from a global pandemic more urgent than addressing rising income inequality or climate change, just to mention two of many other possible examples?Aren’t we implementing Modern Monetary Theory already? What’s the budget constraint?

We wouldn’t start from here

Things could have been different if the pandemic had found the global economy with lower debt and higher interest rates. Most countries did not take advantage of the good times in the years before to create enough policy space, just because they thought that these years were not “good enough.” Macro policies since the late 1990s have been loose in good times and even looser in bad times. Countries have been converging towards MMT, without even realizing that they do. Of course, extraordinary macro policy support is absolutely necessary, in our view, in response to a global pandemic that takes place once in a century. However, the problem is that policies were loose and debt high even before the pandemic.

Inflation could eventually be the budget constraint

As long as there is no inflation, there is no budget constraint, in MMT and in the current state of the world. For as long as the pandemic lasts, fiscal and monetary policies can provide as much support as necessary and even more. Even after the pandemic, we would expect no rush to tighten policies, to avoid jeopardizing the recovery, as was also the case in the years following the global financial crisis. After all, Japan has been in this reality for the last 30 years.

In theory, at some point, loose macro policies, in both a good and a bad state of the global economy, will likely lead to inflation. The longer it takes the more addicted markets become to macro policy support making the eventual adjustment harder. Even if central banks are willing to overshoot their inflation target, non-linearities may make their task challenging, while in any case markets may start pricing rate hikes and the so-called central bank policy put could weaken. Only low inflation has allowed the I-am-so-bearish-I-am-bullish market in recent years. If and when at some point we do get inflation, this equilibrium will likely break.

NEVER MISS THE NEWS THAT MATTERS MOST

ZEROHEDGE DIRECTLY TO YOUR INBOX

Receive a daily recap featuring a curated list of must-read stories.

Recurring bubbles in a lowflation scenario

The obvious pushback is that inflation has been the dog that has not barked in recent decades. It is certainly the least of our concerns today, with output well below potential and our forecasts for a very weak recovery. Markets are also pricing low inflation and low interest rates for the foreseeable future.

However, in a lowflation scenario, debt is likely to remain high in most countries. To reduce debt to pre-Covid levels, and even more to pre-global financial crisis levels, would require massive fiscal austerity and private sector deleveraging. As long as inflation remains low and central banks keep policy rates at zero, there is no reason for such pain.

However, this is a scenario of recurring bubbles. The real economy is weak, but asset prices are strong because of loose macro policy support-more decoupling between Wall Street and main street. This will continue until unexpected shocks take place, asset price bubbles burst, which then needs even looser macro policies to avoid an even weaker real economy, leading to new asset price bubbles. The result is a vicious cycle spiralling to even higher debt levels, lower interest rates and larger central bank balance sheets, without inflation, but with an even weaker real economy and even worse asset price bubbles.

Most likely, this spiral started with low inflation in the 1990s, because of structural forces such as globalization and IT, and the widespread adoption of inflation targeting in the years that followed. Macro policies took advantage of low inflation to loosen too much, and one thing led to another, with a crisis every few years also keeping inflation low.

The end game is not clear, but unlikely to be smooth

Most likely, major central banks and most governments are aware of these risks, but they are stuck. Efforts to tighten in the past, even in small steps, led to sharp market adjustments. We can mention many examples, from the Fed’s QE taper tantrum and its sharp U-turn last year cutting rates and expanding its balance sheet despite unemployment being well below the natural rate, to the ECB being stuck with negative rates well after the crisis and despite serious side effects and reintroducing QE last year at effectively full employment. Government debt is already too high in most cases, particularly after the pandemic, to reduce it with fiscal consolidation in the years ahead, without hurting the already weak economy.

We see no easy way out. Again, we wouldn’t start from here. This is not a good place to be in for the global economy and it is getting worse with every shock, despite the market euphoria in the meantime. An already bad situation before the pandemic has now become worse. We are not sure how and when we will see the end-game, but in our view this is not a sustainable situation in the long term.

https://www.zerohedge.com/markets/its-getting-worse-every-shock-bofa-turns-apocalyptic-coming-end-game