Another fascinating – if not comforting – week. A Friday Wall Street Journal headline: “Big Tech’s Embarrassment of Riches – Amazon, Apple, Facebook and Google all show resilience during pandemic while undergoing congressional scrutiny.” Amazon, Apple, Facebook and Google all reported booming earnings the day following appearances by respective CEOs before the House Antitrust Subcommittee. Down the road from Capitol Hill, the FOMC released their post-meeting policy statement. Chairman Powell then conducted a virtual press conference where he addressed key issues: “inflation running well below our symmetric 2% objective,” and “inequality as an issue has been a growing issue in our country and in our economy for four decades.”
While it is true that inequality has been building for decades, this trend has worsened markedly since the 2008 crisis. Much more so of late.
Powell: “So [inequality is] a serious economic problem for the United States, but it’s got underlying causes that are not related to monetary policy or to our response to the pandemic. Again, four decades of evidence suggests it’s about globalization, it’s about the flattening out of educational attainment in the United States compared to our other competitor countries. It’s about technology advancing too.”
If we could chart “inequality,” it would at this point be rising parabolically – following the trajectory of the Fed’s balance sheet. I had been assuming Fed holdings would at some point be getting a lot larger. It seemed clear inequality would only get worse. COVID dramatically accelerated both trends.
Bubble Analysis is these days as fruitful as ever. We’re in the waning days of a multi-decade super-cycle. Bubble markets have become extraordinarily distorted and increasingly disorderly. Protracted deep structural maladjustment has fostered pervasive Bubble Economy Dynamics. Aggressive monetary inflation and central bank market interventions – primary contributors to financial and economic Bubbles – are being deployed to hold Bubble collapse at bay. And we’re now witnessing the initial consequences of desperately throwing massive stimulus at speculative market Bubbles and a Bubble Economy.
Apple closed Friday trading at an all-time high $412, with a market capitalization of a world-leading $1.76 TN. After its 90% rally off March lows, the stock enjoys a y-t-d gain of 40%. Amazon has gained 72% so far in 2020, with market capitalization surging to $1.59 TN. Google has gained 9% ($995bn market cap), and Facebook 23% ($720bn). Microsoft sports a year-to-date gain of 28%, with a market value of $1.53 TN. Apple and Facebook traded to record highs this week, with Amazon, Microsoft and Google just below recent all-time highs.
If you have the great fortune to be employed at one of the tech giants (owning shares and option grants), you likely have never had it so good. Moreover, this windfall has created the wherewithal to trade the markets, likely furthering your good fortune.
Powell: “As I have emphasized before, these are lending powers, not spending powers. The Fed cannot grant money to particular beneficiaries. We can only create programs or facilities with broad-based eligibility to make loans to solvent entities with the expectation that the loans will be repaid.”
While Powell’s comments were directed to the Fed’s emergency lending facilities, it has become a critical issue that the Fed can and does “grant money to particular beneficiaries.” Owners of securities – Treasuries, agency bonds and MBS, stocks, investment-grade and high-yield corporate bonds, municipal bonds, CLOs, etc. – have been huge beneficiaries of Fed money. Many speculating in derivatives markets (i.e. call buyers and put sellers) have benefited hugely. Robinhood traders – and day-traders and equities speculators generally – have benefited. The leveraged speculating community has been a particular beneficiary.
It’s Central Banking 101 that central banks must stay well clear of “Credit allocation.” Choosing winners and losers puts a central bank’s credibility at risk and jeopardizes independence. The Fed let the genie out of the bottle with its move to QE and other emergency measures during the last crisis.
Compliments of COVID, inequality is now rightfully considered one of the critical issues of this era. Fed measures directly – and conspicuously – benefit Wall Street firms and clients, the general markets, corporations, and the wealthy. Why, then, shouldn’t the Federal Reserve today turn its full attention to supporting the less fortunate and disadvantaged – especially during the worst pandemic in a century. It’s a reasonable question, and the Fed faces very serious credibility and independence issues if it can’t muster a good answer. The Federal Reserve should never have ventured into the wealth creation and allocation business.
Ironically, markets these days actually fancy all the focus on inequality.
Powell: “So [inequality is] a critical, critical problem for our society but one that really falls mainly to fiscal policy and other policies. Our part of it is to push as hard as we can on our employment mandate… We saw what happened to people at the lower end of the income spectrum late in the last expansion. It was the best labor market in 50 years they told us. We saw that the biggest wage increases were going to people on the bottom end of the wage spectrum… So a tight labor market is probably the best thing that the Fed can foster to go after that problem which is a serious one.”
“Pushing as hard as we can on our employment mandate” translates to “pressing monetary stimulus to the absolute limit.” Results are essentially preordained: inequities will only worsen. Markets, meanwhile, celebrate the reality that monetary policy is trapped in a dynamic of securities markets Bubble inflation, with bursting Bubbles poised to inflict irreparable damage to Fed credibility. In the meantime, the Fed is stuck knee-deep in political muck (of its own making).
From the FT (James Politi): “Mr Biden made the US central bank a key focus on his plan for a ‘major mobilisation of effort and resources’ to help ‘advance racial equity across the American economy’, his campaign said… In particular, it said that Mr Biden would work with Congress to amend the Federal Reserve act to force the central bank to ‘aggressively enhance its surveillance and targeting’ of ‘persistent’ racial inequalities.”
Chairman Powell and the FOMC would clearly prefer to defer to fiscal policy to help rectify inequality and festering social stress. QE and aggressive market interventions have essentially granted Washington a blank check book. I’ll assume eventual stimulus legislation bipartisan compromise will push this year’s fiscal deficit to $5 TN.
Dump aggressive monetary stimulus on a speculative marketplace and the outcome will be a more unwieldy Bubble. Dump extreme stimulus on a maladjusted Bubble Economy – in the throes of a pandemic – and expect strange results. How many tens of billions flowed to Robinhood and other trading accounts? Just imagine the enthusiasm generated when free chips are handed to patrons as they enter a casino. How much stimulus flowed freely into stock and bond funds?
How many fiscal stimulus dollars flooded into the already overflowing coffers of the big tech companies, as millions of restaurants and small businesses were breathing their dying breaths. How much free money was used to purchase iPhones, computers, tablets, TVs and such, helping secure the manufacturing jobs of workers throughout Asia? How much stimulus went into software, cloud and online services, myriad downloads and such, completely bypassing millions of struggling small businesses and most U.S. workers.
This is not your granddad’s Economic Structure. And to hear the Federal Reserve still focused on below target inflation is a farce. For decades now, the shift to new technologies and a services-based economy placed downward pressure on many consumer prices. And seemingly tepid consumer price pressures empowered a transformation to permanent policy accommodation (the Fed and global central banks). Loose monetary policies stoked asset price inflation and Bubbles, while accommodating economic structural transformation. When bursting market Bubbles exposed economic vulnerabilities, the Fed resorted to ever more aggressive stimulus measures.
It’s now all coming home to roost. Fed stimulus only stokes dangerous speculative excess, while the Bubble Economy structure is revealed as a financial black hole. Despite massive monetary and fiscal stimulus, U.S. GDP contracted at a shocking 33% annualized pace during the second quarter. Ominously, Trillions of fiscal stimulus were absorbed like a dry sponge.
This is key: There was a chance for a rapid return to some semblance of normalcy. If the virus had been quickly contained, brisk economic recovery would have restored confidence. Previous spending patterns would have returned, and the vast majority of businesses would likely have survived. But the virus became more contagious and, as a society, we didn’t make the necessary sacrifices to gain the upper hand on COVID.
The outbreak resurgence came with major consequences. The recovery – in confidence and economic activity – was disrupted. The return to previous spending patterns was significantly postponed – if not crushed. Importantly, this ensures that hundreds of thousands (millions?) of sole proprietorships to major corporations will fight for survival. Severe Credit issues are now unavoidable.
“Hogwash!” would be the reply from today’s fearless stock market bulls. Clearly, equities markets are playing a different game – with the assumption aggressive monetary stimulus can sustain Bubble excess for the foreseeable future.
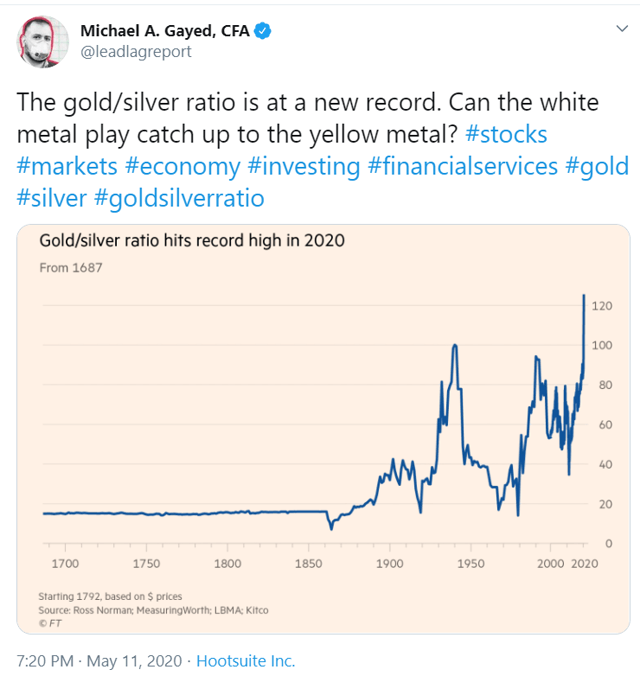
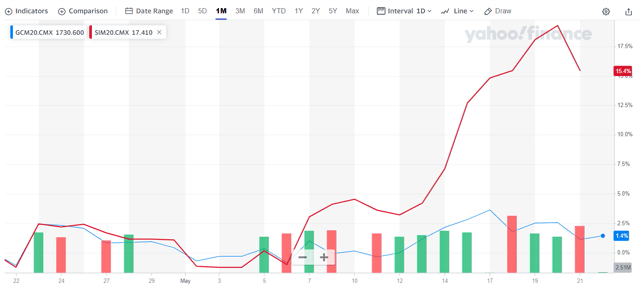
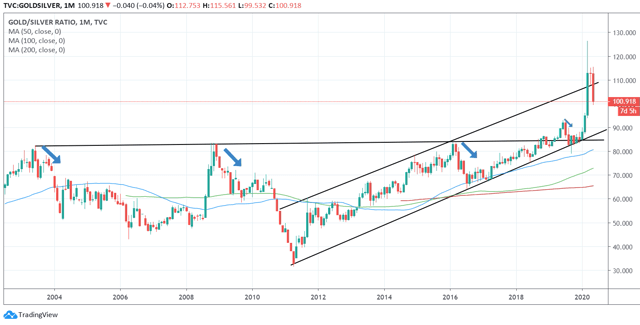
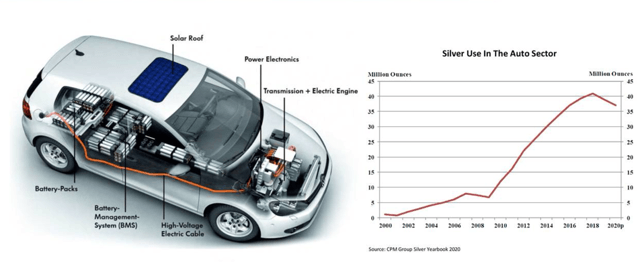
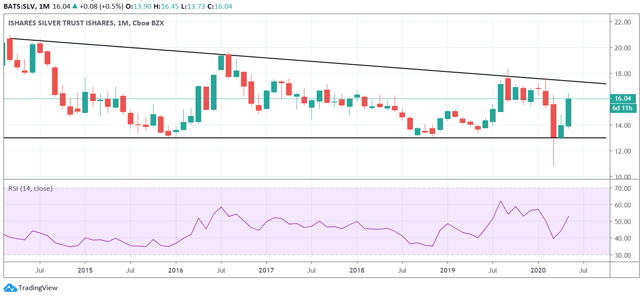
Yet other markets corroborate my analysis. Ten-year Treasury yields ended the week at a record low 53 bps – down 13 bps for the month. Perhaps more reflective of the deteriorating environment, the U.S. dollar index suffered its worst month since 2010 – losing 4.8% versus the euro, 6.2% against the Swedish krona, 5.7% against the Norwegian krone, 5.5% to the British pound and 2.0% to the Japanese yen. Over the past month, Gold gained $195, or 11%, to a record $1,976. Silver surged 34% in July. And how about some of this week’s equities declines: Germany’s DAX down 4.1% and Japan’s Nikkei sinking 4.6%.
The U.S. has been inflating historic financial and economic Bubbles – and these Bubbles are faltering. Financial Bubbles and Deep Structural Economic Maladjustment will force policymakers into The Precarious World of Ongoing Massive Monetary and Fiscal Stimulus. Significant dollar devaluation is inevitable, with the dollar’s world reserve currency status in jeopardy. An equities market speculative melt-up only exacerbates instability and systemic fragility. Risk of major social, political and geopolitical instability is escalating. And the safe havens signal a major crisis is unavoidable.
For the Week:
The S&P500 gained 1.7% (up 1.2% y-t-d), while the Dow slipped 0.2% (down 7.4%). The Utilities increased 0.9% (down 4.6%). The Banks fell 1.4% (down 34.3%), and the Broker/Dealers dropped 1.5% (down 4.1%). The Transports jumped 2.7% (down 8.3%). The S&P 400 Midcaps rose 0.8% (down 9.7%), and the small cap Russell 2000 gained 0.9% (down 11.3%). The Nasdaq100 advanced 4.0% (up 24.9%). The Semiconductors surged 4.8% (up 15.5%). The Biotechs fell 1.9% (up 11.6%). With bullion surging $74, the HUI gold index gained 2.7% (up 45.0%).
Three-month Treasury bill rates ended the week at 0.0825%. Two-year government yields fell four bps to 0.11% (down 146bps y-t-d). Five-year T-note yields dropped seven bps to 0.21% (down 149bps). Ten-year Treasury yields fell six bps to 0.53% (down 139bps). Long bond yields declined four bps to 1.19% (down 120bps). Benchmark Fannie Mae MBS yields sank 18 bps to 1.24% (down 147bps).
Greek 10-year yields increased three bps to 1.08% (down 35bps y-t-d). Ten-year Portuguese yields declined a basis point to 0.35% (down 9bps). Italian 10-year yields rose two bps to 1.01% (down 40bps). Spain’s 10-year yields slipped one basis point to 0.34% (down 13bps). German bund yields dropped eight bps to negative 0.52% (down 34bps). French yields fell five bps to negative 0.19% (down 31bps). The French to German 10-year bond spread widened three to 33 bps. U.K. 10-year gilt yields declined four bps to 0.10% (down 72bps). U.K.’s FTSE equities index sank 3.7% (down 21.8%).
Japan’s Nikkei Equities Index dropped 4.6% (down 7.1% y-t-d). Japanese 10-year “JGB” yields were little changed at 0.02% (up 3bps y-t-d). France’s CAC40 lost 3.5% (down 20.0%). The German DAX equities index fell 4.1% (down 7.1%). Spain’s IBEX 35 equities index sank 5.7% (down 28.0%). Italy’s FTSE MIB index dropped 4.9% (down 18.8%). EM equities were mixed. Brazil’s Bovespa index increased 0.5% (down 11.0%), while Mexico’s Bolsa declined 0.9% (down 15.0%). South Korea’s Kospi index rose 2.2% (up 2.4%). India’s Sensex equities index fell 1.4% (down 8.8%). China’s Shanghai Exchange jumped 3.5% (up 8.5%). Turkey’s Borsa Istanbul National 100 index dropped 5.4% (unchanged). Russia’s MICEX equities index rose 1.7% (down 4.4%).
Investment-grade bond funds saw inflows of $7.904 billion, and junk bond funds posted positive flows of $295 million (from Lipper).
Freddie Mac 30-year fixed mortgage rates declined two bps to 2.99% (down 76bps y-o-y). Fifteen-year rates fell three bps to 2.51% (down 69bps). Five-year hybrid ARM rates sank 15 bps to 2.94% (down 52bps). Bankrate’s survey of jumbo mortgage borrowing costs had 30-year fixed rates down six bps to 3.12% (down 92bps).
Federal Reserve Credit last week added $4.4bn to $6.917 TN, with a 47-week gain of $3.195 TN. Over the past year, Fed Credit expanded $3.165 TN, or 84.4%. Fed Credit inflated $4.106 Trillion, or 146%, over the past 403 weeks. Elsewhere, Fed holdings for foreign owners of Treasury, Agency Debt gained $5.1 billion last week to $3.407 TN. “Custody holdings” were down $55.5bn, or 1.6%, y-o-y.
M2 (narrow) “money” supply fell $70.2bn last week to $18.318 TN, with an unprecedented 21-week gain of $2.811 TN. “Narrow money” surged $3.448 TN, or 23.2%, over the past year. For the week, Currency increased $6.5bn. Total Checkable Deposits jumped $55.9bn, while Savings Deposits slumped $113.9bn. Small Time Deposits declined $6.9bn. Retail Money Funds fell $11.9bn.
Total money market fund assets declined $18.3bn to $4.570 TN. Total money funds surged $1.292 TN y-o-y, or 39.4%.
Total Commercial Paper slipped $1.6bn to $1.019 TN. CP was down $133bn, or 11.5% year-over-year.
Currency Watch:
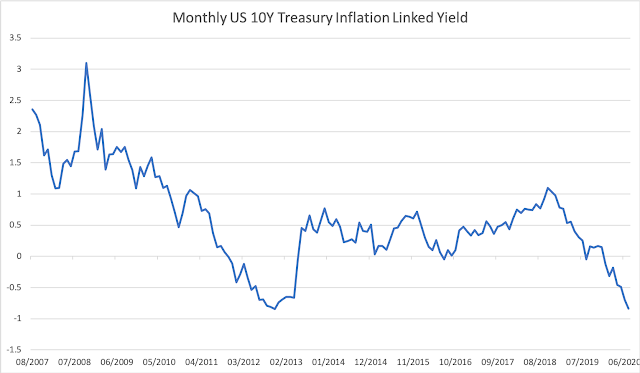
July 28 – Bloomberg (John Ainger and Liz Capo McCormick): “Goldman Sachs… put a spotlight on the suddenly growing concern over inflation in the U.S. by issuing a bold warning… that the dollar is in danger of losing its status as the world’s reserve currency. With Congress closing in on another round of fiscal stimulus to shore up the pandemic-ravaged economy, and the Federal Reserve having already swelled its balance sheet by about $2.8 trillion this year, Goldman strategists cautioned that U.S. policy is triggering currency ‘debasement fears’ that could end the dollar’s reign as the dominant force in global foreign-exchange markets… ‘Gold is the currency of last resort, particularly in an environment like the current one where governments are debasing their fiat currencies and pushing real interest rates to all-time lows,’ wrote Goldman strategists including Jeffrey Currie. There are now, they said, ‘real concerns around the longevity of the U.S. dollar as a reserve currency.’”
For the week, the U.S. dollar index fell 1.1% to 93.349 (down 3.3% y-t-d). For the week on the upside, the British pound increased 2.3%, the euro 1.1%, the South Korean won 0.9%, the Swiss franc 0.8%, the Swedish krona 0.8%, the Singapore dollar 0.6%, the Norwegian krone 0.6%, the Australian dollar 0.5%, the Japanese yen 0.3%, and the Brazilian real 0.2%. For the week on the downside, the South African rand declined 2.4% and the New Zealand dollar dipped 0.2%. The Chinese renminbi gained 0.62% versus the dollar this week (down 0.17% y-t-d).
Commodities Watch:
The Bloomberg Commodities Index increased 0.8% (down 15.1% y-t-d). Spot Gold jumped 3.9% to $1,976 (up 30.1%). Silver surged 6.0% to $24.216 (up 35.1%). WTI crude fell 2.5% to $40.27 (down 34%). Gasoline sank 6.8% (down 31%), and Natural Gas declined 3.6% (down 18%). Copper slipped 0.8% (up 3%). Wheat fell 1.5% (down 5%). Corn dropped 2.4% (down 16%).
Coronavirus Watch:
July 29 – Reuters (Kate Kelland and Julie Steenhuysen): “It’s dog eat dog in the world of COVID-19 vaccines. That’s the fear of global health agencies planning a scheme to bulk-buy and equitably distribute vaccines around the world. They are watching with dismay as some wealthier countries have decided to go it alone, striking deals with drugmakers to secure millions of doses of promising candidates for their citizens. The deals – including those agreed by the United States, Britain and the European Union with the likes of Pfizer, BioNtech, AstraZeneca and Moderna – are undermining the global drive, experts say.”
July 30 – Financial Times (Edward Luce): “It is late October and Donald Trump has a surprise for you. Unlike the traditional pre-election shock — involving war or imminent terrorist attack — this revelation is about hope rather than fear. The ‘China virus’ has been defeated thanks to the ingenuity of America’s president. The US has developed a vaccine that will be available to all citizens by the end of the year. Get online and book your jab. It is possible Mr Trump could sway a critical slice of voters with such a declaration. The bigger danger is that he would deepen America’s mistrust of science. A recent poll found that only half of Americans definitely plan to take a coronavirus vaccine. Other polls said that between a quarter and a third of the nation would never get inoculated. Whatever the true number, anti-vaccine campaigners are having a great pandemic — as indeed is Covid-19. At least three-quarters of the population would need to be vaccinated to reach herd immunity.”
July 27 – Wall Street Journal (Philip Wen and Yoyu Wang): “Australia reported only a handful of new coronavirus cases in early June, while Hong Kong went three weeks without a single locally transmitted infection that month. Japan had already lifted a state of emergency in May after the number of new cases dropped to a few dozen nationwide. All three reported new high-water marks in daily infection numbers in the past week, showing how difficult it can be to keep the virus at bay, even in places lauded for taking early and decisive action.”
July 28 – Financial Times (Guy Chazan and Anna Gross): “Public health officials are sounding the alarm over a resurgence of coronavirus cases in Europe as countries ease lockdowns and international travel ramps up with some experts warning citizens have become too complacent. The increase is marked in countries such as Spain, while eastern Europe and the Balkans, which were largely spared the worst of the early pandemic, are seeing a steep increase in recorded cases. Boris Johnson, Britain’s prime minister, warned of a looming ‘second wave’ of Covid-19 across Europe on Tuesday, while the head of Germany’s public health authority said: ‘We’ve let our guard down’.”
July 24 – Reuters (Jane Wardell): “Almost 40 countries have reported record single-day increases in coronavirus infections over the past week, around double the number that did so the previous week, …showing a pick-up in the pandemic in every region of the world. The rate of cases has been increasing not only in countries like the United States, Brazil and India, which have dominated global headlines with large outbreaks, but in Australia, Japan, Hong Kong, Bolivia, Sudan, Ethiopia, Bulgaria, Belgium, Uzbekistan and Israel, among others. Many countries, especially those where officials eased earlier social distancing lockdowns, are experiencing a second peak more than a month after recording their first.”
July 30 – Reuters (Alasdair Pal): “India… reported more than 50,000 daily coronavirus cases for the first time, driven by a surge in infections in rural areas at a time when the government is further easing curbs on movement and commerce. There were 52,123 new cases in the previous 24 hours, according to federal health data, taking the total number of infections to almost 1.6 million.”
July 29 – Reuters (Colin Packham): “Australia recorded its deadliest day of the coronavirus pandemic on Thursday with 14 deaths and more than 700 new infections mainly in Victoria state, where the government ordered all residents to wear face-coverings outside.”
Market Instability Watch:
July 26 – Wall Street Journal (Amrith Ramkumar): “Stocks, bonds and commodities are heading for their strongest simultaneous four-month rise on record, highlighting the breadth of the market recovery during the 2020 economic slowdown. Through Thursday, the S&P 500 and S&P GSCI commodities index were each up more than 25% since the end of March, while the Bloomberg Barclays U.S. Aggregate Bond Index added more than 3% in that span. If the gains hold during the final week of July, this would be the first time that the gauges all rose that much in a four-month period, according to a Dow Jones Market Data analysis going back to 1976. Investors and analysts attribute the broad rise in financial markets to faith in government and central-bank stimulus programs, hopes for vaccine development and wagers that the coronavirus crisis will spell opportunity for a number of large but nimble, well-placed companies at the expense of others whose struggles are deepening.”
July 25 – Wall Street Journal (Michael Wursthorn, Mischa Frankl-Duval and Gregory Zuckerman): “Stuck at home in lockdown, millions of Americans are trading the markets like never before. At E*Trade Financial Corp., investors opened roughly 260,500 retail accounts just in March, more than any full year on record. Newer rival Robinhood Markets… logged a record three million new accounts in the first quarter. Individual investors’ last big binge was for dot-com stocks in the late 1990s. That era saw money-losing technology companies vaulted into the stratosphere and spawned a culture of day traders who played the markets as a full-time job. It appears even bigger—and broader—this time around, amplified by digital communities on Twitter and Discord… Investors have transformed those social-media platforms into virtual trading desks, a place to swap tips, hype stocks and talk trash as they attempt to trade their way to a quick fortune.”
July 29 – Bloomberg (Sarah Ponczek and Lu Wang): “Robinhood day traders swarmed to Eastman Kodak Co. shares as the stock rallied 1,600% this week. As of 11 a.m. in New York on Wednesday, 43,000 users of the investing app had added Kodak to their accounts in some form over the past 24 hours, according to website Robintrack.net… Roughly 27,000 of the additions came over a four-hour span earlier Wednesday. The growing presence of retail investors has become a popular markets narrative this year with zero commission fees and the potential for entertainment in a world largely without sports or gambling luring a new crop of traders.”
July 29 – Bloomberg (Vivien Lou Chen): “Bond traders have been bracing for weeks for a new run at record low yields on U.S. Treasuries. Federal Reserve Chair Jerome Powell gave them what they were looking for on Wednesday. Five-year yields fell to a series of record lows during the day, before and after the Fed delivered a widely expected dovish message of support for the coronavirus-stricken U.S. economy. The rate touched as low as 0.2437%, just below the upper bound of the Fed’s target range for overnight lending. The day’s final leg down came as Powell wrapped up a press conference in which he warned of signs that increasing virus cases are weighing on growth.”
Global Bubble Watch:
July 26 – Bloomberg (Moxy Ying): “After a dreadful March quarter for Asian corporations, investors are bracing for another wave of reporting cards that will reflect the first full three-month period during the worst virus outbreak in living memory… The members on the gauge that have reported second-quarter earnings so far saw an average decline of 73% on year, according to… Bloomberg. That’s after a 64% fall in the previous three-month period, which was the worst in data going back to 2011.”
July 28 – Reuters (Laurence Frost, Tim Hepher and Jamie Freed): “Global airlines cut their coronavirus recovery forecast…, saying it would take until 2024 – a year longer than previously expected – for passenger traffic to return to pre-crisis levels… ‘The second half of this year will see a slower recovery than we’d hoped,’ IATA Chief Economist Brian Pearce said. June passenger numbers were down 86.5% year-on-year… after a 91% contraction in May.”
July 31 – Bloomberg (Jacqueline Poh): “The automotive industry has borrowed $132 billion since March as the spread of the coronavirus curbed demand for cars and closed factories. The sector is the largest user of funds put in place to ease the impact of the pandemic. The amount consists of $79 billion in new loans and $53 billion in drawdowns from existing credit lines. Facilities linked to the pandemic account for almost 80% of overall loan borrowings by the sector in the year to date.”
Trump Administration Watch:
July 29 – Associated Press (Lisa Mascaro): “President Donald Trump… dismissed Democratic demands for aid to cash-strapped cities in a new coronavirus relief package and lashed out at Republican allies as talks stalemated over assistance for millions of Americans… Republicans, beset by delays and infighting, signaled a willingness to swiftly approve a modest package to prevent a $600 weekly unemployment benefit from expiring Friday. But House Speaker Nancy Pelosi, D-Calif., roundly rejected that approach as meager, all but forcing Republicans back to the negotiating table. ‘As of now, we’re very far apart,’ said Treasury Secretary Steven Mnuchin… Stark differences remain between the $3 trillion proposal from Democrats and $1 trillion counter from Republicans putting aid for millions of communities at risk. Money for states and cites is a crucial dividing line as local governments plead for help to shore up budgets and prevent deeper municipal layoffs… Trump complained about sending ‘big bailout money’ to the nation’s cities, whose mayors he often criticizes.”
July 27 – Reuters (Susan Cornwell and David Lawder): “Senate Republicans… proposed a $1 trillion coronavirus aid package hammered out with the White House, paving the way for talks with Democrats on how to help Americans as expanded unemployment benefits for millions of workers expire this week. Senate Majority Leader Mitch McConnell called the proposal a ‘tailored and targeted’ plan focused on getting children back to school and employees back to work and protecting corporations from lawsuits, while slashing the expiring supplemental unemployment benefits of $600 a week by two-thirds. The plan sparked immediate opposition from both Democrats and Republicans. Democrats decried it as too limited compared to their $3 trillion proposal that passed the House of Representatives in May, while some Republicans called it too expensive.”
July 30 – CNBC (Jacob Pramuk): “A coronavirus relief agreement in Congress looked illusory Thursday as new economic data showed a U.S. economy buckling under the pandemic’s weight. Sen. Ron Johnson, R-Wisc., tried to unanimously pass an extension of the weekly enhanced federal unemployment insurance Thursday afternoon that would slash the benefit from $600 to $200 per week. Senate Minority Leader Chuck Schumer, D-N.Y., rejected it. Schumer then attempted to unanimously approve the $3 trillion rescue package House Democrats passed in May. That legislation also failed, leaving Congress no closer to breaking an impasse over how best to boost a health-care system and economy ravaged by the pandemic.”
July 29 – Reuters (Patricia Zengerle, Susan Cornwell and David Morgan): “U.S. congressional Republicans and Democrats, struggling to reach a deal to provide more aid to those hurt by the coronavirus pandemic, slid on Wednesday toward letting a $600-per-week unemployment benefit lapse when it expires this week. High-ranking Trump administration officials met privately with lawmakers from both parties to see if they can bridge vast differences over the enhanced unemployment benefit and a host of other issues including a moratorium on evictions that expired last Friday. Despite the day of meetings, there was little apparent progress on legislation…”
July 28 – CNBC (Jacob Pramuk): “Senate Majority Leader Mitch McConnell said… he will not pass a coronavirus relief bill in the Senate which does not include liability shields. ‘We’re not negotiating over liability protection,’ he told CNBC’s Kayla Tausche as Congress looks to craft a pandemic rescue agreement.”
July 30 – Reuters (Steve Holland): “President Donald Trump… raised the idea of delaying the Nov. 3 U.S. elections, an idea immediately rejected by both Democrats and his fellow Republicans in Congress – the sole branch of government with the authority to make such a change. Critics and even Trump’s allies dismissed the notion as unserious and simply an attempt to distract from devastating economic news.”
Federal Reserve Watch:
July 29 – Financial Times (James Politi and Colby Smith): “The Federal Reserve has warned that the fate of the world’s largest economy would ‘depend significantly on the course of the virus’ as the US central bank extended measures to deal with the risk of an international shortage of dollars. …The Federal Open Market Committee made no significant changes to monetary policy, holding interest rates close to zero and pledging to do more to support the recovery if necessary. Jay Powell… expressed fears that increases in Covid-19 infections across many US states had started to hit the economy, citing ‘non-standard, high-frequency data’ on credit card spending, employment, hotel occupancy, restaurant bookings and consumer surveys.”
July 29 – Bloomberg (Matthew Boesler and Catarina Saraiva): “The Federal Reserve left interest rates near zero and vowed to use all its tools to support the recovery from an economic downturn that Chair Jerome Powell called the most severe ‘in our lifetime.’ ‘The path forward for the economy is extraordinarily uncertain, and will depend in large part on our success in keeping the virus in check,” he told reporters… He sounded a dour tone about how long a road is ahead to get back to where the country was only months ago and noted that more fallout from the virus still lies ahead. ‘Even if the reopening goes well — and many, many people go back to work — it is still going to take a fairly long time for parts of the economy that involve lots of people getting together in close proximity’ to recover, he said. ‘Those people are going to need support.’”
July 29 – Financial Times (James Politi and Colby Smith): “The Federal Reserve took little action at its meeting this week, but sent plenty of dovish signals to investors — highlighting its worries about the impact of coronavirus on a US recovery, its hopes that Congress will renew fiscal stimulus, and its willingness to add monetary support. ‘We’ve got to hope for the best and plan for the worst,’ Jay Powell… said at his press conference…, after a two-day gathering of the Federal Open Market Committee. ‘We’re in this until we’re well through it,’ he said. ‘The picture is, you have the lockdown, then you have the reopening, but there’s probably going to be a long tail where a large number of people are going to be struggling to get back to work.’”
July 28 – Reuters (Lindsay Dunsmuir): “The U.S. Federal Reserve said… it will extend several of its lending facilities through the year-end as the central bank continues to dial back expectations on how quickly the U.S. economy will recover from the novel coronavirus pandemic. The extensions apply to those facilities that were due to expire on or around Sept. 30…”
July 27 – Wall Street Journal (Nick Timiraos): “Sen. Susan Collins (R., Maine) said… she would join Sen. Mitt Romney (R., Utah) in opposing the nomination of economist Judy Shelton to the Federal Reserve’s board of governors. President Trump formally nominated his former economic adviser to a seat on the seven-member board earlier this year, and her candidacy cleared a significant hurdle last week on a party-line vote in the Senate Banking Committee. Republicans have a 53-47 vote advantage in the Senate, meaning that Ms. Shelton can’t afford to lose more than three Republicans if all Democrats oppose her candidacy.”
U.S. Bubble Watch:
July 30 – Associated Press (Martin Crutsinger and Paul Wiseman): “The coronavirus pandemic sent the U.S. economy plunging by a record-shattering 32.9% annual rate last quarter and is still inflicting damage across the country, squeezing already struggling businesses and forcing a wave of layoffs that shows no sign of abating. The economy’s collapse in the April-June quarter, stunning in its speed and depth, came as a resurgence of the viral outbreak has pushed businesses to close for a second time in many areas. The government’s estimate of the second-quarter fall in the gross domestic product has no comparison since records began in 1947. The previous worst quarterly contraction — at 10%, less than a third of what was reported Thursday — occurred in 1958 during the Eisenhower administration.”
July 30 – CNBC (Fred Imbert): “The number of Americans who filed new claims for unemployment benefits last week totaled 1.434 million…, roughly in line with expectations, as the coronavirus pandemic continues to ravage the U.S. economy. It was the 19th straight week in which initial claims totaled at least 1 million and the second consecutive week in which initial claims rose after declining for 15 straight weeks.”
July 28 – Associated Press (Martin Crutsinger): “U.S. consumer confidence tumbled in July to a reading of 92.6 as coronavirus infections spread in many parts of the country. The Conference Board… reported Tuesday that its Consumer Confidence Index fell from a June reading of 98.3. The weakness came from a drop in the expectations index, which measures consumer views about the short-term outlook for income, business and labor market conditions.”
July 29 – Bloomberg (Maeve Sheehey): “Food insecurity for U.S. households last week reached its highest reported level since the Census Bureau started tracking the data in May… In the bureau’s weekly Household Pulse Survey, roughly 23.9 million of 249 million respondents indicated they had ‘sometimes not enough to eat’ for the week ended July 21, while about 5.42 million indicated they had ‘often not enough to eat.’”
July 30 – Wall Street Journal (Christopher Mims): “If the partisans of America’s elected leadership seem to agree on almost nothing these days, Wednesday’s Big Tech antitrust hearing was stark evidence that they do share one common target. Despite what were sometimes cantankerous and politically charged exchanges between Republican and Democratic members of the House Judiciary Committee, perhaps the most interesting line of the hearing came at the start, when Rep. David Cicilline (D., R.I.), chairman of the Antitrust Subcommittee, recounted a comment he attributed to Rep. Ken Buck (R., Colo.): ‘This is the most bipartisan effort I’ve been involved with in 5½ years in Congress.’ What followed was a bipartisan roast of the heads of Apple Inc., Amazon.com Inc., Google parent Alphabet Inc. and Facebook Inc… It was a pandemic-era spectacle of scrutiny that evoked past congressional grilling of the captains of other industries near the peaks of their powers…”
July 30 – Financial Times (Richard Henderson): “Corporate America is finding it hard to kick the share buyback habit, even after the US slipped into its worst recession in decades. Total buybacks are expected to drop this year as the downturn caused by coronavirus saps corporate profits, prompting many US blue-chips to suspend or cut back share repurchases. Yet companies in the S&P 500 that have reported second-quarter earnings so far have reduced the number of their outstanding shares by an average of 0.3% from the previous quarter… Updates showed that some of the largest US multinationals continued to buy back their own stock or even accelerated stock repurchases.”
July 29 – Wall Street Journal (Doug Cameron and Andrew Tangel): “Boeing… outlined plans to slash more production and jobs and look for other ways to conserve cash as the coronavirus pandemic deepens its toll on the global aviation industry. The U.S. plane maker lost $2.4 billion in the second quarter and said it may consolidate some jet assembly among its three main factories to save money and prepare for a multiyear slowdown in aircraft deliveries. Boeing’s plans to become smaller will leave the Chicago-based aerospace giant increasingly reliant on its defense business for cash and likely ripple through its vast supplier network, their workforces and the broader U.S. economy.”
July 29 – Reuters (Lisa Lambert and Susan Heavey): “The U.S. Treasury said… it has reached a deal with the U.S. Postal Service on the conditions of a loan of up to $10 billion that was included in recent coronavirus relief legislation. The head of the service said the borrowing would push off an ‘approaching liquidity crisis,’ but not solve its financial problems.”
Fixed Income Watch:
July 29 – Reuters (Michelle Conlin): “More than $21.5 billion in past-due rent is looming over Americans struggling to make ends meet, global advisory firm Stout, Risius and Ross estimated…, as Republicans and Democrats fight over a new COVID-19 relief package. Senate Republicans this week proposed a new plan that would not reinstate the recently-lapsed federal eviction ban, which carried a stay for rent due for one-third of renters.”
July 30 – Financial Times (John Dizard): “CMBS, or commercial mortgage-backed securities, may not be the biggest class of impenetrably written paper in the US, but, with about $550bn outstanding, they count for something. In their present 2.0 form, CMBS were designed to avoid some of the structural weaknesses from their pre-financial crisis form. In recent decades the securities helped build all those franchised restaurants, hotels and suburban offices… Since Covid-19, it has become clear that money offered by CMBS has become too expensive and its terms too hard to modify. If you borrow money from an ordinary bank for your business, you can, in theory at least, go back to the loan officer or ‘relationship manager’ you started with, and seek to restructure the loan. That’s not how CMBS works.”
July 30 – Bloomberg (Lisa Lee and Katherine Chiglinsky): “They’ve been billed as a solution to the rock-bottom interest rates weighing down the returns of America’s asset managers. Collateralized loan obligations — which package and sell leveraged loans into chunks of varying risk and return — promise safety and higher yields. And one industry more than any other has gone all in. Insurers have become the biggest U.S. investors in the market, topping banks and hedge funds to amass a third of all domestic holdings… The love affair was sudden: By the end of 2019, they owned $158 billion of CLO bonds, a 22% jump from the prior year and almost double what they had in 2016, according to Barclays Plc figures.”
July 28 – Wall Street Journal (Laura Kreutzer and Laura Cooper): “Privately held companies, particularly smaller operations, are starting to feel more pain from the coronavirus pandemic as loan default rates rise while their lenders and private-equity backers seek ways to steer them safely to the end of the year. ‘You would probably be shocked at how little restructuring activity went on in the second quarter,’ said Brian Williams, a partner at Carl Marks Advisors. ‘A lot of people were deferring payments, [and] lenders were offering forbearances.’ ‘That’s now beginning to change,’ he said. ‘The big theme now is, who is going to fund the next three to six months?’ The default rate on private debt rose to 8.1% in the second quarter, according to the Proskauer Private Credit Default Index…”
July 31 – Bloomberg (Katherine Greifeld): “At a time of mounting corporate defaults and deepening economic gloom, a new fund may be about to bring collateralized loan obligations to the masses. Janus Henderson is planning a U.S. exchange-traded fund that will seek floating-rate exposure to the highest-quality CLOs, according to a filing with the Securities and Exchange Commission this week. While many loan ETFs exist, there are currently none dedicated to CLOs.”
China Watch:
July 26 – Reuters (Martin Quin Pollard and Thomas Peter): “China took over the premises of the U.S. consulate in the southwestern city of Chengdu on Monday, after ordering the facility to be vacated in retaliation for China’s ouster last week from its consulate in Houston, Texas. The seizure capped a dramatic escalation in tensions between the world’s two biggest economies that began when employees at China’s Houston consulate were seen burning documents in a courtyard last Tuesday, hours before Beijing announced that it had been ordered to leave the facility.”
July 30 – Bloomberg: “Chinese President Xi Jinping called for a greater push on reforms to stimulate domestic demand and the economy to ride out mounting risks and challenges, saying conditions remain ‘complicated and grave.’ Speaking at a Politburo meeting on economic policy, Xi said China should speed up its ‘dual circulation’ growth model that is primarily driven by domestic demand, while drawing in foreign investment and stabilizing trade, the official Xinhua News Agency reported… Xi’s remarks come ahead of series of high-level political meetings that will chart the development path of the world’s second-largest economy.”
July 31 – Bloomberg: “President Xi Jinping is accelerating his push for a China that can stand on its own feet as mounting pressure at home and abroad exposes the vulnerability of Beijing’s economic model. In a series of remarks over the past few weeks he’s touted the so-called ‘dual circulation’ development model, in which a more self-reliant domestic economy serves as the main growth driver supplemented by certain foreign technologies and investment. Following a Politburo meeting Thursday, Xi said China should speed up this approach in the face of an economic situation that ‘remains complicated and challenging with unstable and uncertain factors.’”
July 30 – Reuters (Guy Faulconbridge and Kate Holton): “China… accused the United States of stoking a new Cold War because certain politicians were searching for a scapegoat to bolster support ahead of the U.S. presidential election in November. Asked if he saw a new Cold War, China’s ambassador to London, Liu Xiaoming, said the United States had started a trade war with China and that there would be no winner from such an approach. ‘It is not China that has become assertive. It’s the other side of the Pacific Ocean who want to start new Cold War on China, so we have to make response to that… We have no interest in any Cold War, we have no interest in any war… We have all seen what is happening in the United States, they tried to scapegoat China, they want to blame China for their problems,’ he said. ‘We all know this is an election year.’”
July 28 – Bloomberg: “China’s economic recovery lost some upward momentum in July, with the effect of stronger market sentiment damped by muted demand in the real economy. The overall indicator for the economy in July was unchanged from last month, after improving in May and June. The calculation of the indicators has been revised from this month to include metrics for car purchases, real-estate sales and the building sector.”
July 31 – Bloomberg (Rebecca Choong Wilkins and Molly Dai): “More and more Chinese firms are struggling to juggle their debt loads. That’s likely to get tougher as President Xi Jinping calls for increasingly targeted monetary policy. At least 77 companies with a total of $44.7 billion of bonds outstanding are facing pressure repaying their debt, according to Bloomberg compiled data… It’s the highest weekly number of firms since Bloomberg began collecting data in January last year, up 28% from the end of March…”
July 30 – Bloomberg: “Concern is growing about the ability of a Beijing district’s local government financing vehicle to repay its debt. The 2022 dollar bond of Beijing Haidian District State-Owned Assets Investment Group touched a record low of 75.3 cents on the dollar on Thursday after the district’s state asset supervision office urged the company to fulfill its debt repayment obligation on time.”
July 28 – Wall Street Journal (Mike Bird): “The China Banking and Insurance Regulatory Commission warned… last week that nonperforming loans, which have barely increased so far this year, are likely to climb significantly. The government demands that lenders assist riskier small firms. This large-scale forbearance to borrowers will add to the pile of nonperforming loans in the longer term. On Monday, credit ratings firm Fitch Ratings estimated that inefficient credit in the Chinese banking system as a whole ran to between 15% and 22% of gross domestic product at the end of 2019—roughly unchanged from its level at the end of 2015. That would suggest nonperforming-loan ratios are already far higher than the banks actually report.”
July 26 – Bloomberg: “Office vacancies in China’s biggest cities are at the highest in more than a decade even as the nation’s economy has largely swung back into action after the coronavirus outbreak. Vacancy rates for prime office buildings in Shanghai climbed to 20% in the second quarter and 21% in the tech hub of Shenzhen, both the highest since at least the financial crisis in 2008… Beijing’s 15.5% rate was the most since 2009… ‘Tenants have generally become more conservative and the majority are choosing to put their expansion or relocation plans on hold,’ said Michael Wu, an executive director of office services at Colliers International Group Inc. ‘We’re starting to see fierce competition on rent among landlords.’”
July 31 – CNN (James Griffiths and Sarah Faidell): “Hong Kong will postpone legislative elections due to be held in September by one year because of the coronavirus outbreak… Hong Kong’s Chief Executive Carrie Lam said the move to postpone the Legislative Council elections, slated for September 6, was the most difficult decision she had made in the last seven months. She added that she had the support of the Chinese central government in making this decision.”
July 30 – Bloomberg (Natalie Lung and Iain Marlow): “Hong Kong authorities drew new red lines on the limits of dissent in the financial center, barring a dozen activists including Joshua Wong from seeking office and arresting four others over social media posts. The back-to-back actions came within a span of about 24 hours Thursday — a sweeping gesture showing how much a national security law enacted last month had strengthened Beijing’s hand. Both the Chinese and Hong Kong governments issued statements praising the disqualification of 12 opposition candidates, showing that mere opposition to the law drafted by Beijing was enough to prevent them from taking office.”
July 29 – Reuters (Clare Jim): “Commercial lenders in Hong Kong say they are concerned about a 30% drop in building values over the past 12 months and will consider calling in or restructuring loans if values fall much further. If lenders demand repayment of loans or try to tighten terms, it could set off a wave of property sales that might depress prices even further in the Chinese-run territory… ‘The market is not going to get better in the next half to one year,’ said a real estate investor who provides financing in the city. ‘If you’re in the Hong Kong market, I’d say de-risk if you can. Get your money back.’”
Europe Watch:
July 25 – Reuters (Michael Nienaber): “A decision by European leaders to issue joint debt to finance coronavirus aid for weaker member states should remain an exemption and not serve as a blueprint for future budget challenges, Bundesbank President Jens Weidmann said… European Union leaders… clinched an historic deal on a massive stimulus plan for their coronavirus-throttled economies following a fractious summit lasting almost five days. The agreement paves the way for the European Commission… to raise up to 750 billions euros on capital markets on behalf of all 27 states, an unprecedented act of solidarity in almost seven decades of integration. ‘It’s important that the EU has proven its capability to act in the crisis,’ Weidmann told Funke media group… But Weidmann added the agreed debt mechanism should remain an exemption and that strict conditions had to be attached to the financial aid.”
July 30 – Reuters (Michelle Martin and Nick Tattersall): “The German economy contracted at its steepest rate on record in the second quarter as consumer spending, company investment and exports all collapsed during the peak of the COVID-19 pandemic, wiping out nearly 10 years of growth. …Gross domestic output in Europe’s largest economy shrank by 10.1% quarter-on-quarter from April to June after a revised 2.0% contraction in the first three months of the year. The plunge was the steepest since the office began collecting quarterly growth data in 1970 and was worse than the 9% contraction predicted…”
July 31 – Bloomberg (William Horobin): “The French economy experienced its sharpest contraction on record in the second quarter when strict coronavirus lockdowns choked off manufacturing, tourism and consumer spending across Europe. Output in the euro area’s second largest economy declined 13.8%…, with huge declines in consumer spending, trade and investment.”
July 31 – Reuters (Belen Carreno): “The coronavirus crisis has pulverised Spain’s economy, triggering its worst recession since the civil war, with collapsed tourism numbers boding ill for hopes of a swift rebound. …The economy came to a virtual halt in March and remained paralysed until the end of June. It shrank 18.5% in the second quarter, a drop so harsh it wiped out all the recovery achieved since the 2008 global financial crisis…”
July 31 – Reuters (Sergio Goncalves and Catarina Demonydit): “Portugal’s gross domestic product shrank 14.1% in the second quarter of 2020, the biggest contraction ever, as lockdowns imposed to contain the spread of the coronavirus hit key sectors of the economy.”
EM Watch:
July 30 – Reuters (Daina Beth Solomon and Drazen Jorgic): “The coronavirus crisis could set back Latin America and the Caribbean by a decade as countries endure faltering economies and rising poverty, the U.N. economic commission for the region and the World Health Organization (WHO) said… Poverty in the region is forecast to climb 7 percentage points compared with last year to engulf an additional 45 million people, according… the WHO and the Economic Commission for Latin America and the Caribbean (ECLAC).”
July 26 – Wall Street Journal (Avantika Chilkoti and Gabriele Steinhauser): “Zambia was once a model in Wall Street’s rush to issue debt for the world’s poorest nations, attracting bigger orders and lower interest rates than some more-developed countries. Less than a decade later, the Southern African nation is straining to pay back more than $11 billion in loans. The world is gearing up for a battle over developing-country debt like few it has seen before. Rich and poor countries are at loggerheads with private investors that, over the past decade, replaced governments as the biggest creditors to emerging markets. Zambia looks set to become a case study in the clash over how to ease the debt load of developing countries that were ill-prepared for the financial pain inflicted by the coronavirus pandemic.”
July 30 – Reuters (Anthony Esposito and Miguel Angel Gutierrez): “Mexico’s economy contracted by double digits in the second quarter as the coronavirus pandemic ravaged Latin America’s second-largest economy and shut factories, kept shoppers and tourists at home and upended trade… GDP fell 17.3% in the second quarter from the previous three months in seasonally adjusted terms, the sharpest drop on record…”
July 28 – Financial Times (Laura Pitel and Eva Szalay): “The Turkish lira tumbled to the lowest level against the dollar since May in the second day of frenetic trading, even as authorities spent about $2bn in an attempt to fend off the heavy selling. The currency dropped as much as 1.6% on Tuesday to 6.97 against the dollar as Turkey’s defence of the currency crumbled. The sharp decline represented a renewed pick-up in volatility after an abrupt drop late on Monday. Authorities had previously succeeded in holding the lira steady at around TL6.85 since mid-June. The tumult has defied vigorous resistance from Turkey’s state banks.”
Japan Watch:
July 28 – Reuters (Bhargav Acharya and Kaori Kaneko): “…Fitch… revised its outlook on Japan’s long-term foreign currency debt rating to negative from stable, citing the sharp coronavirus-induced domestic economic contraction. ‘The coronavirus pandemic has caused a sharp economic contraction in Japan, despite the country’s early success in containing the virus,’ Fitch said… ‘The negative outlook reflects that the higher debt ratio and downside risks to the macroeconomic outlook will nevertheless exacerbate the challenge of placing the debt ratio on a downward path over the medium term,’ Fitch said.”
Leveraged Speculation Watch:
July 30 – Bloomberg (Michael McDonald): “Seth Klarman said the Federal Reserve is treating investors like children and is helping create bizarre market conditions that are unsupported by economic data. ‘Surreal doesn’t even begin to describe this moment,’ Klarman said in a letter to investors… Investor ‘psychology is surprisingly ebullient even though business fundamentals are often dreadful,’ he added. The culprit is the Fed, Klarman said… ‘Investors are being infantilized by the relentless Federal Reserve activity,’ said Klarman, who runs hedge fund firm Baupost Group. ‘It’s as if the Fed considers them foolish children, unable to rationally set the prices of securities so it must intervene. When the market has a tantrum, the benevolent Fed has a soothing yet enabling response… As with the 30-year-olds still living in their parents’ basements, we can only wonder whether the markets will ever be expected to make it on their own.”
July 28 – Wall Street Journal (Xie Yu): “Chinese hedge-fund managers are having a banner year, outperforming rivals elsewhere. That is partly because Chinese stocks are also among the world’s best performers in 2020, as confidence grows that the country is moving past the coronavirus pandemic. A volatile year has also benefited investors who can be fast and flexible, while some portfolio managers say their grounding in China helped them quickly grasp the risks posed by Covid-19. The Eurekahedge Greater China Long Short Equities Hedge Index, which tracks 56 funds, registered an average return of 8.0% in the year to Monday.”
July 29 – Bloomberg: “China’s insatiable appetite for equities is stoking the fastest growth in years for its $385 billion hedge fund industry. New fund offerings swelled to about 1,500 in July after running at a 1,217 monthly pace in the first half, the fastest since at least 2015, according to fund tracker Shenzhen PaiPaiWang Investment & Management Co. The country’s largest quantitative hedge fund firm registered nine new products last week alone. The influx could give fresh impetus to China’s $9 trillion equity market, where a dramatic rally that had pushed indexes to five-year highs…”
Geopolitical Watch:
July 26 – CNBC (Frederick Kempe): “We’ve never been here before. The escalating confrontation between the United States and China is so perilous because the world’s two largest economies – and the two defining countries of their times – are navigating uncharted terrain. Secretary of State Mike Pompeo’s landmark speech at the Nixon library… marked the most robust call-to-action yet against the Chinese Communist Party. It came amid tit-for-tat consular shutdowns in Houston and Chengdu, and the Friday arrest by the FBI of an alleged Chinese military operative in San Francisco. It’s tempting to brand this a hotter phase of a new Cold War… However, that language understates the historic novelty of what’s unfolding and its epochal enormity.”
July 30 – Financial Times (Helen Warrell and Peggy Hollinger): “China has warned the UK not to allow ‘cold war warriors’ to ‘kidnap’ cordial relations between Beijing and Britain, firing a new salvo in the ongoing diplomatic row between the two countries. Liu Xiaoming, China’s ambassador in London, said disagreements over Beijing’s imposition of a new security law in Hong Kong, as well as the UK’s ban on using Huawei in its 5G mobile networks, had ‘seriously poisoned the atmosphere’ in Sino-British relations.”
July 28 – Reuters (David Brunnstrom and Daphne Psaledakis): “The United States and close ally Australia held high-level talks on China and agreed on the need to uphold a rules-based global order, but the Australian foreign minister stressed Canberra’s relationship with Beijing was important and it had no intention of hurting it.”
July 26 – Reuters (Andrew Osborn): “Russian President Vladimir Putin said… the Russian Navy would be armed with hypersonic nuclear strike weapons and underwater nuclear drones, which the defence ministry said were in their final phase of testing.”
Link to the article – http://creditbubblebulletin.blogspot.com/2020/08/weekly-commentary-precarious-world.html
