Utmost crazy

By Doug Noland

The Shanghai Composite surged 7.3% this week, increasing y-t-d gains to 10.9%. The CSI 300 rose 7.6%, with 2020 gains of 16.0%. China’s growth-oriented ChiNext Index’s 12.8% surge boosted year-to-date gains to 54.5%. Copper jumped 7.1% this week. Aluminum rose 4.6%, Nickel 4.0%, Zinc 8.3%, Silver 4.2%, Lead 4.2%, and Palladium 3.5%. China’s renminbi advanced 0.9% this week to a four-month high versus the less-than-king dollar.

July 9 – Bloomberg: “Like millions of amateur investors across China, Min Hang has become infatuated with the country’s surging stock market. ‘There’s no way I can lose,’ said the 36-year-old, who works at a technology startup… ‘Right now, I’m feeling invincible.’ Five years after China’s last big equity boom ended in tears, signs of euphoria among the nation’s investing masses are popping up everywhere. Turnover has soared, margin debt has risen at the fastest pace since 2015 and online trading platforms have struggled to keep up. Over the past eight days alone, Chinese stocks have added more than $1 trillion of value — far outpacing gains in every other market worldwide.”

China’s Total Aggregate Financing (TAF) expanded a much stronger-than-expected $490 billion in June, up from May’s $455 billion expansion and 30% above growth from June 2019. TAF surged a remarkable $2.976 TN during the first-half, 43% ahead of comparable 2019 (80% ahead of first-half 2018).

It’s not easy to place China’s ongoing historic Credit expansion in context. While not a perfect comparison, U.S. Total Non-Financial Debt (NFD) expanded a record $3.3 TN over the four quarters ended March 31st. In booming 2007, U.S. NFD expanded about $2.5 TN. Chinese Total Aggregate Financing has expanded almost $3.0 TN in six months.

In the face of economic contraction, TAF increased a blistering $4.39 TN, or 12.8%, over the past year. For perspective, y-o-y growth began 2020 at 10.7% – and is now expanding at the strongest pace since February 2018. Beijing is targeting TAF growth of $4.3 TN (30 TN yuan) for 2020, about 25% ahead of record 2019 growth (and up 45% from 2018 growth).

China’s New Bank Loans expanded $259 billion in June, up from May’s $212 billion and 9% ahead of June 2019. At $1.727 TN, year-to-date New Loans are running 25% ahead of comparable 2019. Consumer lending has bounced back, likely fueled by some pent-up demand for mortgage Credit. At $140 billion, Consumer Loan growth was up from May’s $101 billion and 29% above June 2019 growth. The $509 billion year-to-date expansion in Consumer Loans was 4% below comparable 2019. Yet Consumer Loans were up 14% y-o-y; 33% in two years; 59% in three; and 135% over five years.

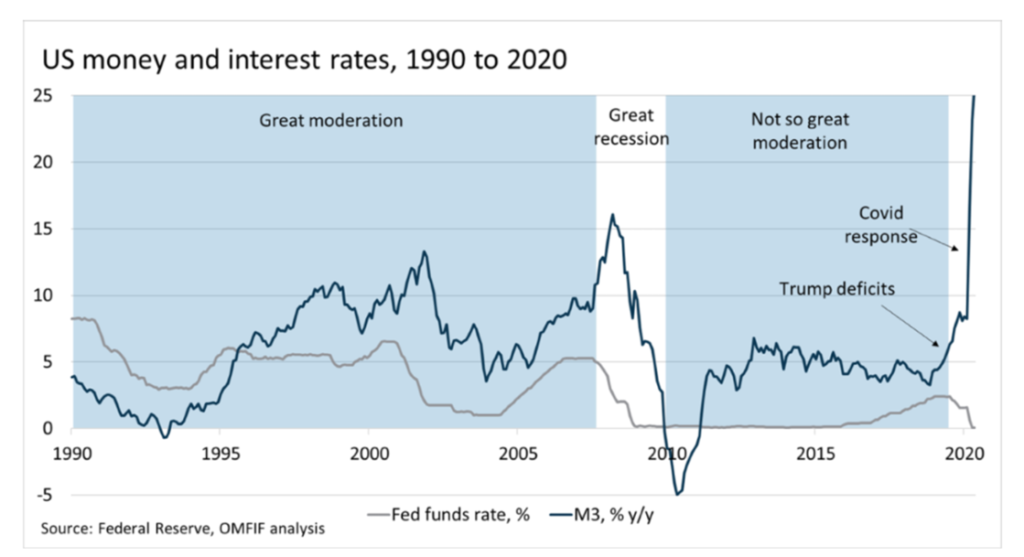
China’s M2 money supply expanded $496 billion during June to $30.5 TN, an almost 20% annualized pace. Over six months, M2 surged $2.120 TN, or 14.7% annualized. At 11.1%, year-over-year M2 growth has been running at the strongest pace since January 2017. M2 expanded 20.6% over two years; 30.9% over three; and 60.1% in five years, in one of history’s spectacular monetary expansions.

For perspective, U.S. M2 rose a record $950 billion during 2019. China’s M2 expansion more than doubled this amount in only six months. And with U.S. M2 up over $3 TN, combined Chinese and U.S. first-half “money” supply growth approached an incredible $5.2 TN.

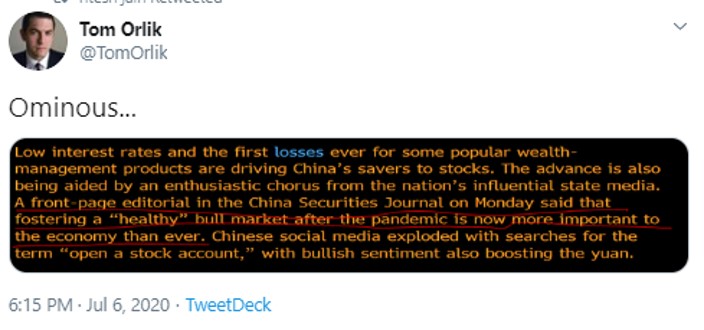
July 7 – Wall Street Journal (Jacky Wong): “Analysts fret that U.S. markets have become irrational thanks to so-called ‘Robinhood’ retail traders with plenty of time on their hands. But American markets have nothing on China. Chinese stock markets have been on a tear lately: the CSI 300 index, a gauge of the largest companies listed in Shanghai and Shenzhen, has gained 14% just in the past week… What really seems to have gotten Chinese investors excited however, is state media’s sudden switch to a bullish tone. A Monday front-page editorial in the state-owned China Securities Journal said it’s now important to foster a ‘healthy bull market’—in part because of more ‘complicated’ global trade and economic relations.”

It is a central tenet of Credit Bubble Analysis that things turn “Crazy” near the end of cycles. And with the thesis that we’re in the concluding (“Terminal”) phase of a multi-decade, super-cycle global Bubble, there’s been every reason to foresee Utmost Craziness.

In the most simplified terms, Bubbles inherently gather momentum and inflate to dangerous extremes. Mounting fragilities ensure policymakers employ the increasingly outrageous measures demanded to hold collapse at bay. Craziness is cultivated by a confluence of late-cycle intense monetary inflation (i.e. QE and speculative leverage) and deeply ingrained speculative impulses.

The bigger the Bubble, the more intense the speculative fervor; the greater the attendant government intervention; and the more convinced market participants become that officials won’t allow a bust. Throw Trillions at systems already acutely prone to Bubble excess and you’re courting disaster (that’s you, Washington and Beijing).

The global nature of Bubble Dynamics makes this period unique. And while Europe, Japan and EM are important contributors, the global Bubble is foremost underpinned by historic U.S. and Chinese monetary inflation. That these two countries are increasingly bitter rivals adds unique challenges to Bubble analysis.

The irony of it all: China’s communist party readily promoting the stock market. Do they have much choice? The Federal Reserve over three decades shifted away from the traditional model of affecting bank lending – elevating the financial markets to the primary policy stimulus mechanism. Instead of measured interest-rate reductions, on the margin, stimulating bank lending, the Fed has resorted to Trillions of securities purchases (QE) and zero rates to directly trigger market speculation and asset inflation. This model proved an absolute boon to U.S. markets, the economic expansion, the dollar and broader U.S. global influence. To compete, Beijing knew what it had to do.

The Nasdaq100 is up 23%, lagging China’s ChiNext Index’s 54% 2020 gain. These competing superpowers are increasingly in hand-to-hand combat for technological supremacy and global dominance. It is also apparent that these two economies will be “decoupling” – in an increasingly unsettled, bi-polar world. The relationship has of late commenced an ominous free-fall.

They do, however, share some commonality. The U.S. and China are both targeting securities markets to reflate their faltering Bubbles. Typically, the primary risks associated with exacerbating Bubble excess would be domestic-focused – i.e. increasingly unstable markets, economic maladjustment/fragility, and heightened social and political instability. Yet today’s backdrop adds a critical geopolitical component. Both face the momentous consequences that collapsing markets would entail for their competing global interests. Stakes are incredibly high – and policymakers respond accordingly.

Chinese equities have been booming, and sentiment has turned bullish on China’s economic recovery. I’m unimpressed. Considering the unprecedented monetary stimulus along with pent-up demand, recovery is thus far unremarkable. Especially with surging COVID cases globally, China export sector struggles will be ongoing. And I question the wisdom of further stoking China’s historic apartment Bubble. I’ll be surprised if Chinese consumers don’t remain at least somewhat cautious for months to come. But if Beijing is hellbent on spurring a recovery, I wouldn’t bet against them in the short-term.

A combined $5.0 TN of new (U.S. and Chinese) “money” supply ensures epic distortions. For one, “money” has flooded into global securities markets. This has fomented an extraordinary reversal of short positions and hedges across global risk markets – equities, corporate Credit, commodities and currencies. Financial conditions have loosened markedly, with risk markets in the throes of a historic short squeeze.

July 8 – Financial Times (Laurence Fletcher): “Lansdowne Partners’ decision this week to shut its flagship hedge fund has dealt a big blow to a key strategy — equity long/short — that is already struggling to find losers in stimulus-soaked markets. The move by the… fund… marks a major retreat by an industry pioneer. It also highlights how tough life has become in the years since the financial crisis for managers trying to pick out overpriced stocks during a seemingly unstoppable bull run. ‘It is much harder to see opportunities in the short book, either in terms of generating specific value or as a hedging offset to the long investments,’ wrote Peter Davies and Jonathon Regis, managers of the Lansdowne Developed Markets fund… Lansdowne’s problems reflect the wider challenges facing the $830bn-in-assets equity long/short hedge fund sector.”

Tesla was up another 28% this week, boosting one-month gains to 51% and its year-to-date advance to 269%. With market capitalization of $287 billion, Tesla is the poster child for stock prices divorced from underlying fundamentals. Yet this dynamic is anything but limited to big Nasdaq stocks. At this point, panic buying and short squeeze dynamics have destabilized markets – from U.S. and Chinese equities to global stocks, corporate bonds and commodities. Did Beijing this week willfully administer a deathblow to shorts in Chinese equities and the renminbi – a squeeze that quickly broadened to the industrial commodities and global equities, more generally?

It’s not unusual for short squeezes to unfold even in the face of deteriorating fundamentals. There is often a final “blow-off” fueled by a confluence of speculative excess, panicked short covering, and derivative-related trading. It’s a key facet of late-cycle Craziness.

That sick feeling in my stomach returned this week: this is out of control. COVID is out of control. Market speculation is out of control. And it’s this combination that recalls the unease I was experiencing back in February, as a speculative marketplace was content to completely disregard mounting pandemic risk.

It’s difficult to fathom the almost 400,000 new U.S. COVID infections since last Friday’s CBB. Hopes from just a few weeks ago of a return to a semblance of normalcy have been crushed. The specter of overflowing ICUs and hospital wards has returned – but instead of NYC it will unfold in cities and towns across the entire southern U.S. And it looks like a replay of PPE and COVID test shortages.

And what the future holds appears more unsettled today than even in March and April. Back then we believed there was a curve to flatten. With shared sacrifice, we’d overcome the pandemic. It was not that many weeks ago when the estimate for COVID-related deaths was revised sharply lower to 60,000. Our nation has lost 134,000.

A harsh reality has begun to set in. At this point, no one – or any model – has a clue as to how many will perish – or even the general trajectory of this pandemic. The relatively low daily death rate was early in the week still a talking point for the dismissive. The daily death count surpassed 800 by the end of the week – on the way to 1,000, 2,000 or even higher?

Will the most populated states in the country be forced to dramatically tighten restrictions? Texas, Georgia, California and others are contemplating a return to “lockdown” conditions. Does this widely dispersed outbreak portend a major nationwide spike in infections – in cities, towns and rural communities? Are we prepared? Have we procured sufficient supplies?

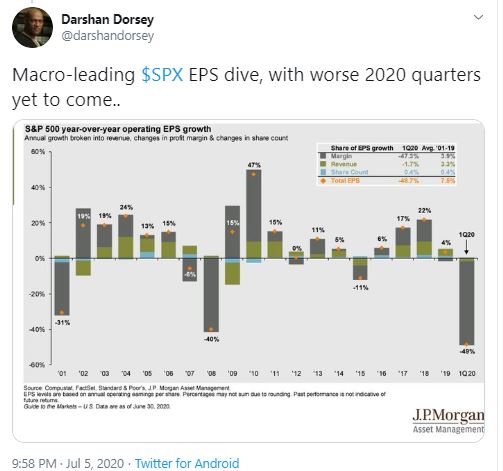
Stocks are surging, so the economic recovery must not be at risk, right? Yet it’s difficult for me to see how the economy – at home and abroad – isn’t facing serious chronic problems. We’re only weeks away from the start of a new school year – and there’s little clarity. College football games are being cancelled and the entire season is slipping away. It’s simply difficult to comprehend what a mess we’ve made of things. Outrage is justified.

In Miami, apparently only 17% of new infections are generating follow-up contact tracing. Beyond the lack of sufficient tracer personnel, many newly infected are simply refusing to cooperate with local authorities. As a nation – from top leadership to us common citizens – we’ve got to quickly get our crap together and approach this crisis with more of a wartime mindset. Surging stock prices notwithstanding, there’s more than a small probability (10%, 20% – 50%?) of a quite problematic scenario.

Meanwhile, divisions, partisan infighting and a proliferation of nonsense are inflicting irreparable damage. Zerohedge uses this photo of Putin with a mischievous grin enjoying his bucket of popcorn. I imagine Xi and Putin chatting affably on a secure line in utter amazement – giggling.

Equity and the rise of inflation- How much inflation before Repression- Russell Napier

Russell Napier wrote a piece on the above subject which I have summarized below

Q1 2009 Russell advised holding US equities till inflation reaches 4% .By 2011 , he saw problems in global banking system that would result in anemic credit growth making deflation a likely outcome. Inflation peaked below 4% in 2011 and by early 2015 US was reporting mild deflation.

The journey of inflation from 4% to 0 was not negative for the equities as a whole , it was negative only after inflation declined below 1% and corporate earnings declined.

We are currently in a deflation shock but by 2021 Inflation in developed world will be at or near 4%.

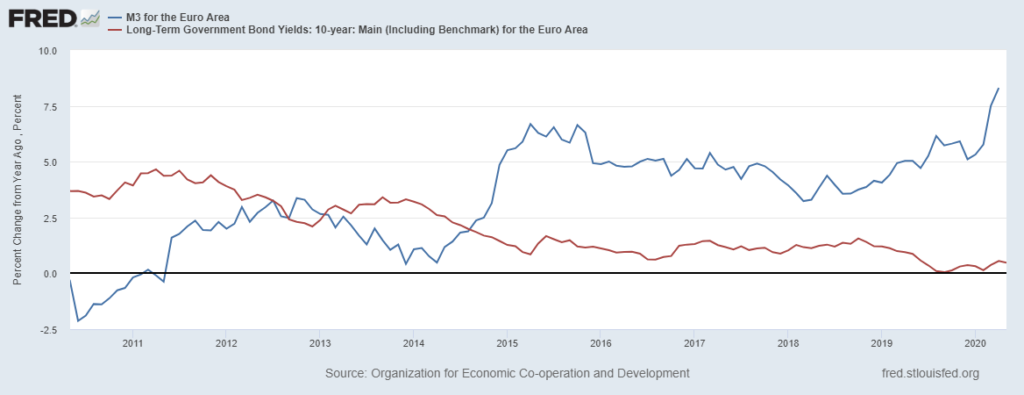
In Q4 2019, the conclusion was made that rising inflation would bode well for European equities, however a deflationary forecast was made. Since Q4 of 2019 we have had deflation shock with more to come causing equity prices and inflation linked bonds to move lower. European markets are pricing in even more low inflation but the forecast is that inflation will be near 4% in Eurozone which leads to a bullish call on European equites.

Source : Fred Data

In eurozone bank credit guarantees have not yet fully impacted broad money growth, hence eurozone broad money growth will go higher. Eurozone M3 is already growing at 8.9% YoY and will exceed 2007 peak in after a few months. The other view by analysts is that as emergency programs subside surge in broad money growth will be an aberration and not impact inflation. The forecast is however as politicians use commercial banks balance sheets to launch new initiative backed by loan guarantees, these temporary measures will likely become permanent. Cautious investors would like to confirm the permanence of such schemes however Russell suggests it is time to embrace this new reality before its permanence is confirmed.

Case in point Spanish governments credit guarantee program has extended from $100 to $150 billion already.

The silent revolution as termed by Russell is the permanent shift of power of money creation from central bankers to democratically elected politicians. The incentive structures and mandates of politicians aligns with control of money supply through commercial bank balance sheet control. This means higher long-term interest rates even though near-term outlook is deflation.

The silent revolution will be priced in by the markets much before inflation actually shows its whites.

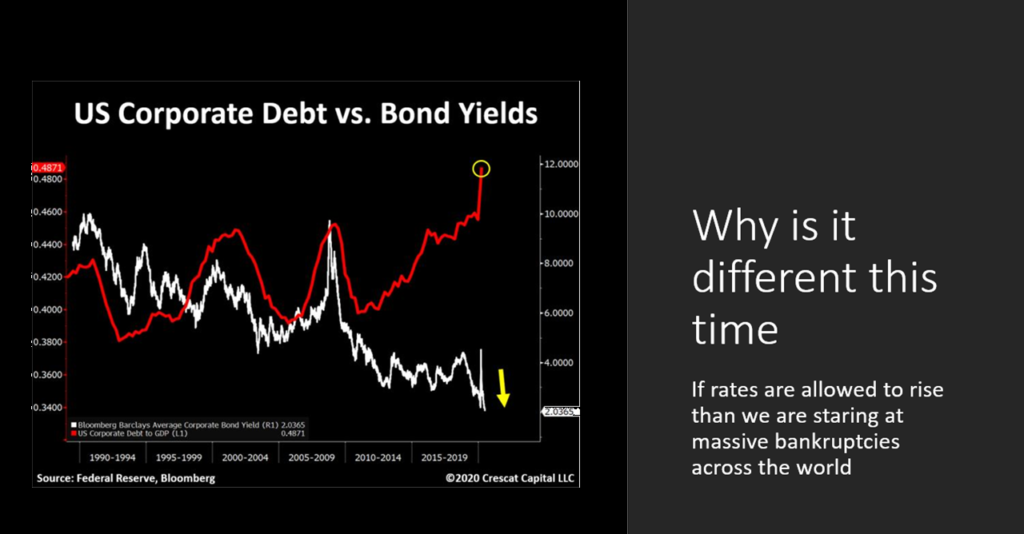
So current course action is to hold equities as market discounts the silent revolution with a lag. The equites may not rise all the way till inflation reaches 4%. It is highly unlikely governments would accept the accompanying long term interest rates corresponding to 4% inflation. As total debt to gdp ratios in both government and private sectors is at highs even before covid 19. These high debt levels can crush the reflation trade if interest costs rises dramatically, hence yield curve cap will be implemented

At levels of annual inflation above 6% , velocity of money could go out of control and with it ability for inflation to be tamed. Russell assumes governments may not want inflation to spiral above 6% , thereby the long term interest rates could be allowed to rise till 3%. The success of a repression is based on gap between inflation and interest rates. He suggests that even if inflation is allowed to rise as high as 6%, expect aggressive moves to tame it even as long term interest rates reach levels of 2 to 3 %. Allowing interest rates to higher levels too slow a deleveraging or a need of inflation that is too destabilizing.  

In a world of rising inflation expectations central bankers will not be able to control long term interest rates. A cap on interest rates would be implemented by forcing savings institutions to buy government debt at targeted yields. Many believe that the combination of capped yields and rising inflation will be positive for equity prices , that will depend on what the saving institutions will have to liquidate to make way for the government debt , which is most likely to be equities. As yields get capped for decades the liquidation can be very prolonged.

Conclusion being that Equities will benefit on road to inflation. Move to cap rates between 2 to 3% can come before inflation reaches 4%. yield curve cap will be implemented by forced purchases of bonds by savings institutions which will have to sell equities to create space for bonds. In nutshell enjoy this equity ride till inflation touched 4%.

The Four Quadrant Framework

Louis Gave of GAVEKAL is also a great macro thinker and he just changed his view.

He believes that we are “accelerating into inflation” and hence the portfolio allocation should reflect the new reality.

He also believes that we are moving from ” Disinflationary boom” quadrant to “Inflationary boom? quadrant and the portfolio should be shifted accordingly.

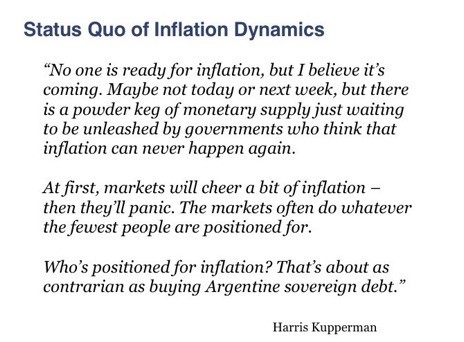
Harris Kupperman also wrote about emerging Inflation Dynamics on his blog.

My views

I belive the market is underestimating the impact of coordinating fiscal and monetary policy and is not appreciating the impact this can have on real economy and prices.

An Interesting Summer Awaits US all

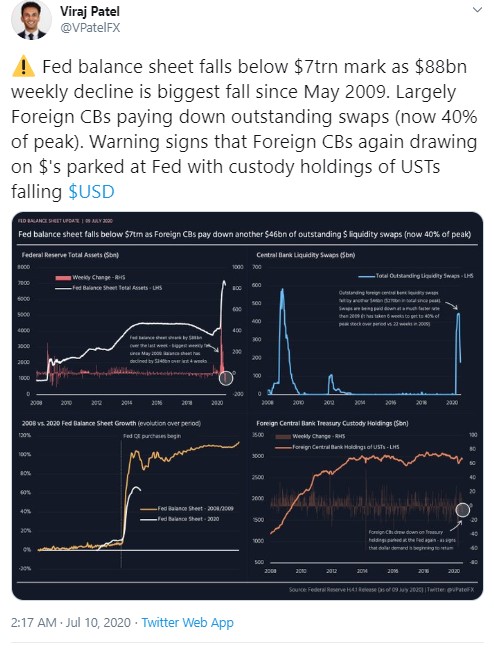
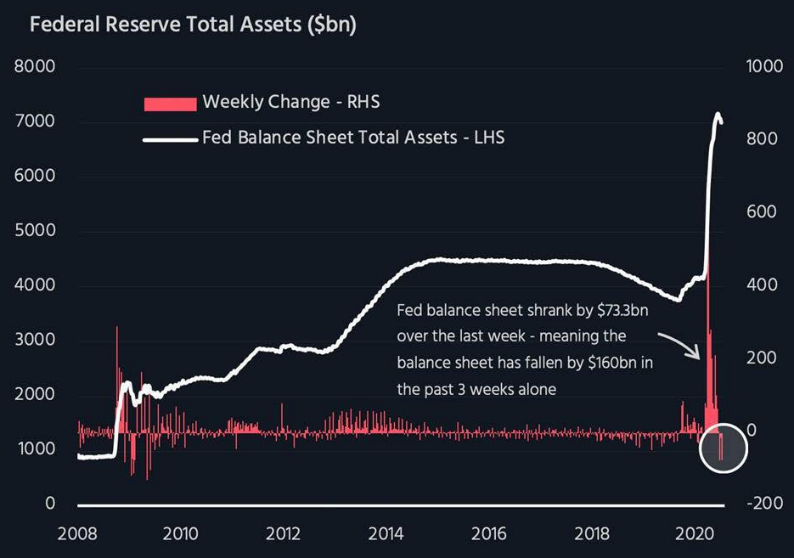
Since March of this Year the Federal Reserves balance sheet expanded from $4 trillion to $7.168 Trillion as the coronavirus spread played out.

Source : https://twitter.com/VPatelFX/status/1278808097679642627

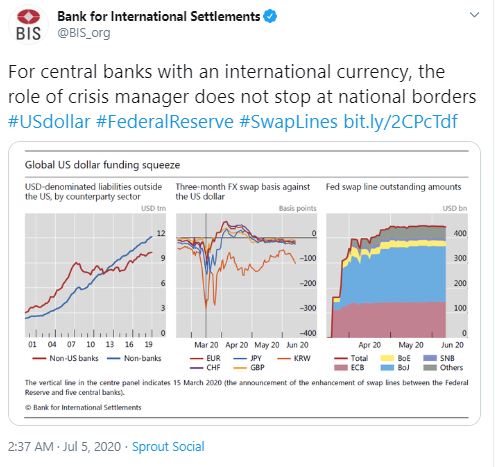
But as of 2nd July 2020, the federal reserves balance sheet shrunk by $160 billion, which has been on account of Foreign Banks paying back the Swap Lines drawn in March.

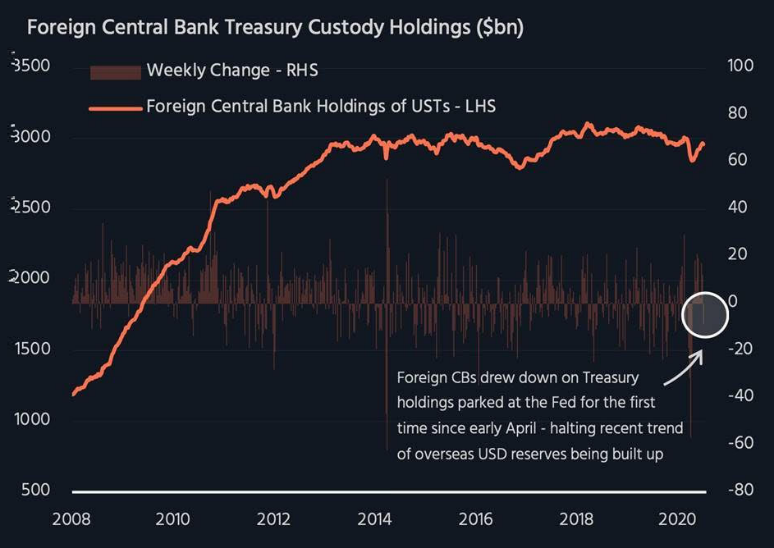
Source: https://twitter.com/VPatelFX/status/1278808097679642627

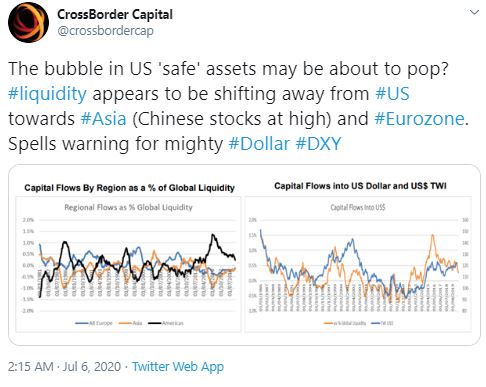
Foreign Central banks have again started selling treasury holdings which is concerning as this reverses the overseas buildup of reserves.

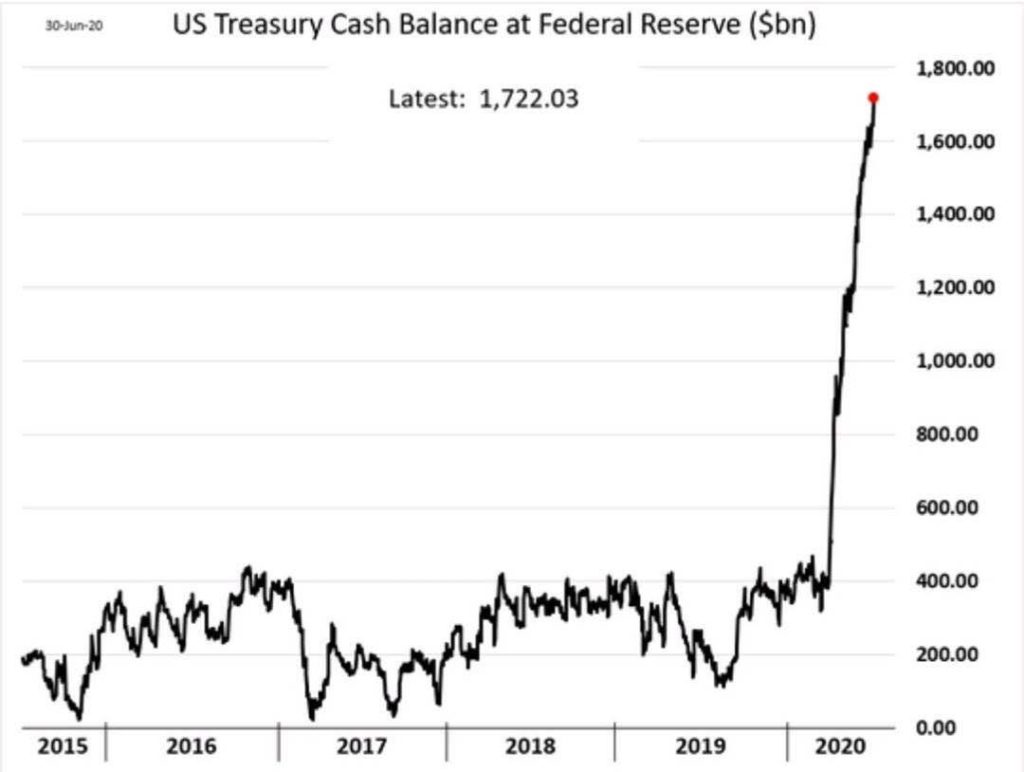
Meanwhile the US Treasury has increased cash balance at federal reserve to $ 1.72 Trillion which is extremely aberrant behavior. This can bode positive for the markets in the run up to the election. But in the interim till the money remains unspent and liquidity tightens in the banking system it can affect markets.

This is all indicative of the US Treasury preparing for a liquidity splurge in the run up to the lection to support asset prices leading into the presidential election. For the treasury to achieve this objective it would have to start spending money in August which would lead to a new high in the market just before the elections.

The course of action would be to be cautious at these levels and wait for either price or time correction expected in the month of July to reduce cash levels and add risk to play for a massive rise in liquidity towards US election.

The age of Inflation- Why I changed my view after 25 years- Russell Napier

Russell Napier had a concall today in which he outlined his views. He is the best known DEFLATIONIST in the world along with Albert Edwards . I have been following his work for almost a decade and when he wrote an article few days back that developed world inflation could touch 4% by 2021 I was intrigued.

Summary of his views below

  • Credit Guarantees offered by government over bank lending revolutionary because broad money growth will exceed 10% for foreseeable future.
  • Money created by Govts vs by Banks is the difference this time.
  • Developed world Inflation to exceed 4% by Next Year as velocity normalises to pre GFC level.
  •  QE did not lead to growth in GDP but only DEBT to GDP increased.
  • Central Bankers Don’t have control of money supply.
  • Government is now taking Contingent Liability and offering to bail out any default on principal thereby banks are now creating money.
  • Senior Bankers have told FT that these forced lending loans will result 50 % of them will likely go bad, also the average tenor of these loans are around 6 years.
  • Bank Credit guarantee solves problems of QE which did not lead in increase in lending to real sector.
  • The green loans and reconstruction loans are the real money magic tree and politicians will not relinquish this power, most severe in Europe as 19 countries printing money without any coordination.
  • Euro will thus cease to exist due to excess printing and capital controls.
  • US will be last holdout due to property rights, dollar will strengthen vs Euro
  • EM ‘s getting through this especially countries without foreign denominated currency loans, financial restrictions and debt to gdp does not go above 200% will attract capital.
  • US M2, China M2 and Eurozone M3 to go even higher backed by Credit guarantee schemes and can continue for some time.
  • China has limits to what it can do and will thereby have a flexible exchange rate.
  • Japanese equities can be a winner due to inflation emerging.
  • Non-Bank Credit will get capped by forcing institutions to buy more government bonds and ratchet up transaction tax etc and will thus have to sell their current holdings which can bode consequences for equity prices both ways.
  • Velocity was down due to QE, because if you exchange new money for an asset there is a high chance the next transaction will also be used to buy an asset rather than goods or services .
  • US broad money grows by above 10% and thereby velocity will go up.
  • All these events are bad for bonds although in near term they can sustain value as regime changes
  • Yield curve control because of higher inflation is like throwing fuel on fire, worked previously because early yield curve events were when there was deflation.
  • Federal Reserve will force savings institutions to buy bonds and use them for yield control and these institutions may thus have to sell equities.
  • US residential real estate is reasonably valued with respect to wages and thereby can gain.
  • Major Reallocation of wealth from lenders to borrowers will happen and will be enforced by financial repression.
  • Equities that were pilloried before will be good to buy for example Japan , because of higher real returns.
  • From a 10-year perspective prefer first Japanese equity ( high gearing with higher sales growth) and then EM equities. Very bullish on India
  • Prefer GOLD to GOLD miners
  • There were two forces of deflation 1. China and 2. Technology. In the new cold war china is now taken out of equation
  • Will not invest in Russia or china because you might be thinking of return on capital but my worry is return of capital
  • India is the biggest beneficiary of new cold war between US and china
  • Prefer mortgages to commercial real estate or private equity because govt guaranteed credit will favor voters to keep “American dream going”
  • Prefer chemical/petrochemical/cement/steel/supermarkets
  • Prefer banks in short term but in long term govt “running banks is not good”

We cannot operate economic policy if we do not have a strategic and medium-term framework: Rathin Roy

Says decision needs to be taken on funding mechanism of public institutions such as NIPFP

“We need to design and think through the future in a strategic and medium-term framework. We need to work better with the data we have and, most importantly, we need to have wider public participation on the kind of economic policy we need. We need to, therefore, move from an administrative approach to an executive approach,” says Rathin Roy, Director, National Institute of Public Finance and Policy (NIPFP).

Roy, who has now put in his papers, has always been vocal about his views on ways to recover from economic shocks. Chatting with BusinessLine, as he prepares for his next move (which he didn’t disclose) come September, he said: “I have been, for years, advocating that we modernise our public systems; while I have been listened to with great courtesy, this has not happened. I believe this is very important for India.”

His experience as part of the Prime Minister’s Economic Advisory Council is that the political class is more receptive to suggestions than the bureaucracy, he said. Excerpts:

What triggered this decision to move out of NIPFP?

Well, my decision to move out was taken last year. I had been contemplating it for some time. It had nothing to do with Urjit Patel joining NIPFP (the former RBI Governor has been appointed NIPFP Chairman). I would have loved to work with him.

I felt I needed to work and talk about the situation the world and India find themselves in today without being constrained. I have felt for some time that the problem we face with the economic crisis and the Covid-19 crisis is just not to do with the government, but to do with society at large.

A low fraternity society results in deficiencies in outcomes. A divided society begets a polarising polity. These severely detract from the effectiveness of economic policy and the functioning of rules and institutions.

What do you think is the biggest long-term challenge?

I have been, for years, advocating modernising our system. While I have been listened to with great courtesy, I believe this is very important for India. I believe we cannot operate an economic policy if we do not have a strategic and medium-term framework.

We need to work better with the data we have, and most importantly, we need to have wider public participation on the kind of policy we need. We need to, therefore, move from an administrative approach to an executive approach — I have spoken about this but have failed to get traction.

I think it is about time that some leader sees this as a very important constraint on the effectiveness of economic policies in India, and attention is paid to developing a medium-term and strategic policy approach.

What were the challenges at NIPFP?

A decision needs to be taken on whether public institutions like NIPFP should continue to receive public funds to undertake policy-relevant research, or purely exist as service providers and training centres. Both cannot be simultaneously achieved, and many public institutions in India have diminished because of the inability to see this contradiction.

Since the private sector is not going to fund research on public finance, it becomes an existential question for NIPFP — whether it can continue in the same way. We need to see how the funding base can be broadened, consistent with our public interest mandate.

How do you see Aatmanirbhar Bharat package? Is it a stimulus?

First and foremost, I have never advocated any government providing a stimulus. What the government can do is be supportive of economic activity — support where it is needed. What the government has done, I think, is to provide some income support to vulnerable groups, which is a good thing.

But the bulk of the response has been to facilitate monetary and credit support, This implies, essentially, asking the private sector to take the initiative and, in turn, incentivise them with more reforms. Whether it will work or not, we will have to see.

The private sector will have to play a vital role in restoring the economy. What we are lacking is a three-four-year roadmap that tells us the things we will do to recover from the shock and how it will align with the process of recovery after Covid. In a medium-term fiscal framework nested in such a roadmap, the issue of financing is very tractable.

What we are missing today are two things on the fiscal side — a medium-term fiscal policy and a medium-term economic strategy. In the absence of these, we are just looking at how to survive for the next three-four months because we don’t have the executive machinery to talk about debt and deficit in the medium term. To talk about these in the short term doesn’t help.

Data for economic projections remain a challenge. Do you agree?

I think we have to understand that good data put into public domain, accompanied by good analysis, is an essential input into effective policy making. If the immediate administrative imperatives of government, or the preferences of a powerful individual, drive policy actions, then the results are bound to be sub-optimal.

Thus, for example, if the data show that tax collections are falling, and analysis shows this is a structural trend, I think it is inappropriately defensive to carry on as if this were a temporary phenomenon.

The question which you have to ask is: why is it low; but that would require examination of data which is not in the public domain. That would also require a culture of prompt and consistent sharing of data, which is not the case at this time.

https://www.thehindubusinessline.com/economy/we-cannot-operate-economic-policy-if-we-do-not-have-a-strategic-and-medium-term-framework-rathin-roy/article31916170.ece

Owning Gold is as Much about Diversification as it is about Capital Appreciation

June 24, 2020 By Bryce Coward

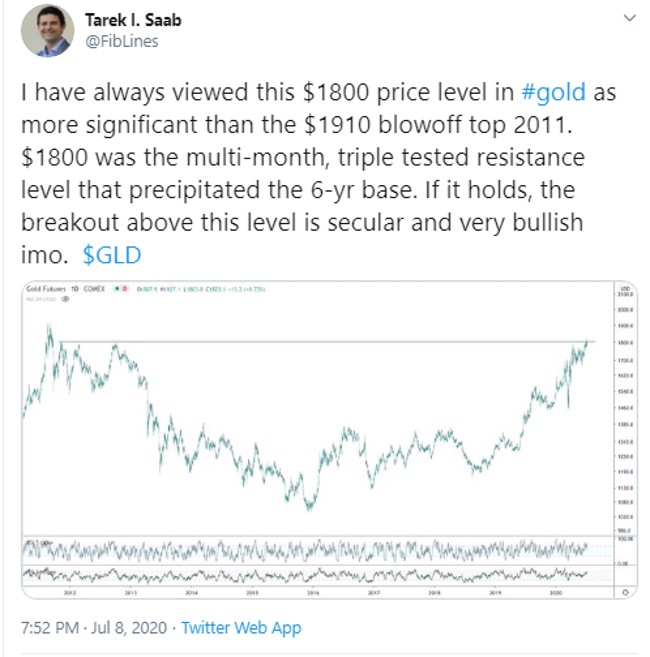
Regular readers of our content know that we have been building the case for several years now on why gold deserves a place in diversified portfolios. Sure, we see significant upside in gold (unlimited upside, in fact), aided as I will show by the unprecedented rise in US dollar money supply in response to the COVID crisis. But the case for gold is much deeper than simply a story of potential capital appreciation.

These days, gold as an asset class is in an entirely unique position to not only provide upside potential, but also provide a layer of diversification within a portfolio that neither stocks nor risk-free nominal bonds can achieve on their own or even together. Much of this has to do with the rather disadvantageous position of risk-free bonds at the moment that have brought us to the death throes of the 60:40 portfolio. Indeed, with risk-free rates so close to zero (even on the long end), bonds simply don’t have enough convexity (aka capital appreciation potential) left in the tank to act as a sufficient diversifier of equity risk. After all, if the 10-year bond yield drops to 0.00% from the current 0.68%, that would provide owners of that bond with a whopping 6% capital appreciation, which is not nearly enough to cushion a 20% or 30% equity selloff.

Now, things may be different if the Federal Reserve was open to the idea of setting the Fed Funds rate at -3% or -4%, but that idea has been sufficiently brushed into the dusk bin. Instead, the Fed appears more likely to add some form of yield curve control to its policy toolbox. This will relegate risk-free bonds to a purgatory of sorts in which they can provide neither income nor capital appreciation potential of any magnitude.

Conversely, gold provides both capital appreciation potential as well as diversification to equity risk. Said in modern portfolio theory parlance, gold has the potential to bring one’s portfolio closer to the efficient frontier. That can no longer be said of nominal risk-free bonds.

Now, let’s get to some charts to illustrate these points.

The fundamental case for higher gold prices is really quite simple. While many view gold as an asset class that rises when inflation expectations or actual inflation rises, it’s even simpler than that. The quantity of gold is relatively fixed. The quantity of money is not. Therefore, when the quantity of money rises, the price of gold as priced in terms of that form of money must also rise. Sure, inflation may be a consequence of a rising money stock (Milton Friedman’s “inflation is always and everywhere a monetary phenomenon”), but it also may not be (see 2009-2019).

So from an empirical perspective, we observe that gold has a closer relationship with the quantity of money in the economy than it does actual inflation. The first chart below shows the US dollar price of gold compared to United States M2 money supply. The price of gold tracks the quantity of money quite well, with some deviations from trend that have always corrected over a fairly short period of time (see the late 1970s-1980s, early 2000s, 2010-2011).

Another way to show this idea is to plot the price of gold relative to the money supply. What we observe is a flat overall trend with the bulk of the distribution concentrated around a rather narrow central tendency (blue bars on the right of the chart show the distribution of observations). Sure, the price of gold is not entirely a function of the quantity of money, otherwise the line would be flat as a pancake, but it’s close enough for government work.

Now, when we do the same exercise again and plot the price gold relative to consumer prices, we see something entirely different. First, the trend is not flat, but has a positive slope. Second, the distribution of the series is not concentrated around a narrow central tendency, but instead the distribution itself (blue bars on the right) is kind of flat. Basically, this chart shows that gold really is a rather imperfect inflation hedge. The other explanation is that our measurement of consumer prices is imperfect, but that is a topic for another day.

Since the price of gold generally rises with the with the quantity of money, it makes perfect sense that gold would perform well with the M2 money supply growing at 23% YoY, as it is currently. Further, it doesn’t take much extrapolation or imagination to see the path toward continued fast money growth. After all, with policy rates at 0.00%, the remaining tools of fiscal spending that is funded by an ever-growing Fed balance sheet (i.e. money growth) makes logical sense at this juncture.

With the fundamental case for higher gold prices out of the way, let’s move onto gold’s application as a portfolio diversifier. The reason it makes sense to form multi-asset portfolios vs all-equity portfolios is that equity risk hard to diversify away with a portfolio of…equities. Indeed, even as there exists idiosyncratic risk exposures of individual stocks, there are market forces of demographics, interest rates, productivity levels, economic growth rates, etc. that affect both public and non-public equities. One way to show this concept is simply to plot the average correlation between stocks in the S&P 500. The average correlation between the S&P 500 constituents ranges from 40-60% in normal times and then rises towards 100% in selloffs (see early 2018, late 2018, early 2020). In other words, all that idiosyncratic risk exposure of equities as an asset class (both public and private as we recently learned) gets tossed out the window in a selloff and one’s “diversified” equity portfolio morphs into market risk only, or beta.

It used to be that long-term Treasury bonds could be used as a diversification tool to cushion the blow of equity selloffs because they typically appreciated a lot during market drawdowns. We can show this by plotting the correlation between US stocks and long-term bonds in the bottom panel in the next chart. Since 2014, long bonds were nearly always negatively correlated with stocks and had a central tendency of -10% correlation to -40% correlation. That negative correlation is what you want from a hedge, or diversifier. But, you also need capital appreciation potential from that hedge. Bonds don’t have that anymore, as I previously showed.

What about inflation protected bonds? TIPS don’t have an interest rate floor the same way nominal bonds do. Theoretically, TIPS yields could trade severely negative if the Fed caps 10-year nominal bond yields at say, 0.50%, while actual inflation runs at 3% or 4%. TIPS also have a negative correlation with stocks just like nominal bonds as we see in the next chart. So, it appears, that TIPS may still have a place in a diversified portfolio as a hedge.

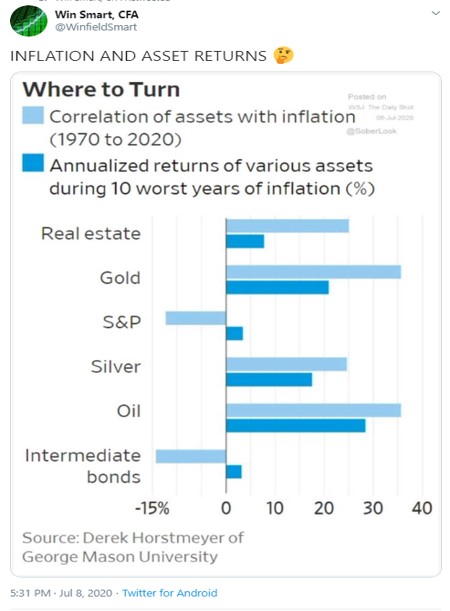
Now, let’s turn to gold. Gold exhibits the same negative correlation with stocks that both the nominal bonds and TIPS do. However, unlike nominal bonds it has no theoretical upside. And unlike TIPS, gold may appreciate in price independent of actual or expected inflation trends.

That is not to say, however, that gold and TIPS aren’t related. Indeed, gold and TIPS sport an average correlation between +40% to +60% (first chart below). This compares to a negative correlation between nominal long-term bonds and gold (second chart below). But the drivers in their price are different enough to justify places for both asset classes in a diversified portfolio. Indeed, gold has outperformed TIPS by 20% over the last 12 months and is undergoing what a technician might call a base breakout vs TIPS (third chart below). This action undoubtedly is a result of that growing supply of money to offset what is admittedly a hugely deflationary economic backdrop currently.

Sign up for reports from Knowledge Leaders Capital.