Crude oil falls ….. one more pillar of reflation trade comes under pressure

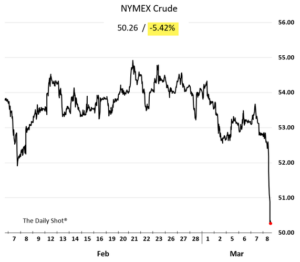
One market jolted out of complacency yesterday was crude oil where the price broke out of a range and fell 5%

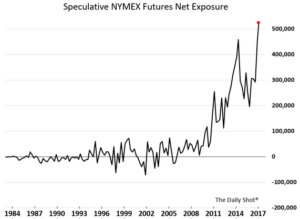
But the speculators are running all time high long positions. Every trader believes that OPEC cuts are for real and Saudi Arabia will not allow oil prices to fall before Saudi Aramco listing  http://www.reuters.com/article/us-saudi-aramco-ipo-value-idUSKBN16D14Y after all ,if Saudi Aramco is valued at closer to USD 1.5 trillion then it is in the interest of Saudi Arabia to keep oil prices high till Aramco IPO …….. Hmm sounds logical

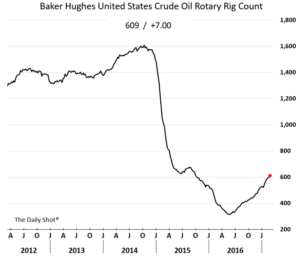
it seems Americans are not cooperating as US rig count and crude oil output continue to recover

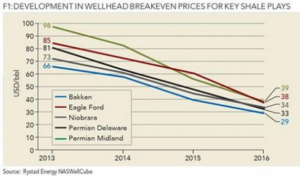
and at the same time, US shale production is becoming more efficient with breakeven firmly below 40

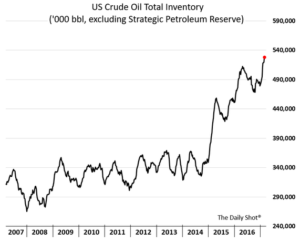
oh yes  US crude oil stockpiles … hitting another post-WW-II record

Crude is knows as king of commodities because of its size and importance in global economy.The break down in price is a sign that REFLATION trade might be at the risk of reversal.


Coho Capital Partners newsletter

Over the last five years, Coho Capital has increased at 20.2% per year compared to 14.7% for the S&P 500. They utilize the S&P 500 Index as a comparison because it is the most difficult index to beat over time.Given their global mandate to seek value, they utilize the MSCI ACWI Index as another way to assess performance. Relative to the MSCI, Coho Capital has returned an extra 10.6% per year, resulting in aggregate outperformance of 92.5% over the past five years.

This newsletter is on Why they own Alibaba, Facebook , Google ( Alphabet), visa and S&P Global (rating business).

There is a treasure of information on these companies in this newsletter  CohoCapital2016AnnualLetter

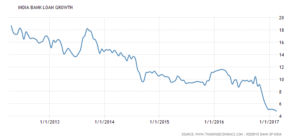
Bank credit growth collapses

The Bank credit increased 4.8 percent year-on-year in the two weeks to February 17th 2017. Loan Growth in India averaged 12.48 percent from 2012 until 2017, reaching an all time high of 18.70 percent in April of 2012 and a record low of 4.80 percent in February of 2017.


It is possible some of bank credit growth for higher rated corporates got substituted via commercial papers, subscribed by mutual funds hence not a part of bank credit growth rate.Still, it is not a sign of healthy economy and certainly not of an economy which is gowing at 7% . Rbi might have shifted its monetary stance to neutral but weak credit growth means bond yield might remain at current levels for some more time.

Equity is the last man standing?

Lets start with Art

Art Market Bubble Bursting – Gauguin Priced At $85 Million Collapses 74%. Russian billionaire Dmitry Rybolovlev paid €54 million or $85 million for a landscape by Paul Gauguin (featured below) in a private transaction in June 2008. Yesterday, he incurred a whopping 74% loss on his store of value “investment” as reported by Bloomberg.

This painting was worth $85 million in 2008.

Bond Curve Flattening

Curve Watchers Anonymous is taking a hard look at the yield curve in light of the now odds-on market view of a March rate hike.

Before looking at the data below, where do you think rates are relative to January 2014? Up, down, or sideways?

Duration         1-Jan-14              1-Mar-17                  Direction
30 Year            3.96                     3.06                          -0.90
10 Year             3.04                    2.46                           -0.58
5 Year               1.75                     1.99                             0.24
2 Year               0.38                    1.29                             0.91
1 Year                0.13                    0.92                            0.79
30 Days            0.07                    0.63                            0.56

The 2-30 spread flattened by a whopping 181 basis points in just over two years.

The 2-10 spread flattened by 149 basis points.

Not to worry, despite poor economic reports, Fed governors have stated: “This is a surprisingly strong economy.”

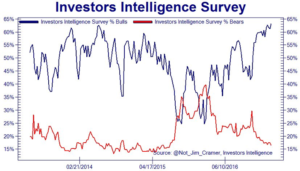
And this is from CNBC “Wednesday’s strong showing for the stock market came as the Investors Intelligence survey of newsletter writers showed extreme bullishness again. The percentage of equity bulls came in at 63.1%, up from 61.2% in the prior week and the highest level since 1987. The survey is used as a contrarian indicator because excessive bullishness has been seen at or near market tops in the past”.

As Martin Armstrong writes, it is all about capital flow
“This European crisis is pushing up the Dow and capital flows from smart money is starting to vacate Europe headed into the Dow for that is where “big money” always hides. Of course, domestically, they are attributing this as always to just local issues now praising Trump’s speech as optimistic”

So Art bubble deflating, yield curve flattening, Equity investors overtly bullish and big capital hiding in dow.

Equity is the last man standing ….. lets see how long it lasts


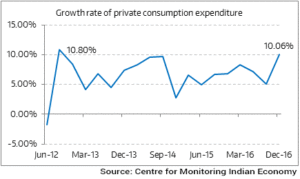
Private consumption expenditure behind stellar GDP numbers?

The Central Statistical Office surprised the nation on Tuesday evening when it released advanced estimates of Gross Domestic Product growth for the October-December quarter. Despite widespread economic disruption caused by the Union government’s demonetisation move on November 8, the GDP figures have registered a robust growth of 7% in the third quarter. This defies predictions by most economists that weak consumption would drag the rate down well below that figure.

GDP when measured by expenditure method is obtained by adding private consumption expenditure, government consumption expenditure, investments and net exports (imports minus exports). The private consumption expenditure forms a bulk of the GDP measured through this method and this is what has grown by 10% in Oct dec period .

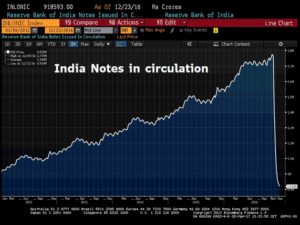
This when 86% of all valid currency notes were demonetised on November 8 and Indians were under tremendous pressure from arbitrary limits on bank and ATM withdrawals. How did people consume so much when there was an acute scarcity of cash?

I forgot they went on this spending binge by taking loans ,after all it is not necessary that people spend their hard earned money on consumption they can also take loans…… right?

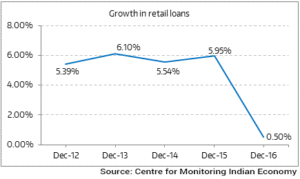
Oops even growth in retail loans collapsed during oct-dec perios

So my guess is there is preponement of future purchases out of cash remaining with household. if it is true then it is clearly a case of upfronting the GDP

Indian Sales Fall as Demonetisation Effects Hit Small and Medium Size Businesses

The Sales Managers Index provide the earliest monthly data on the speed and direction of Indian economic activity.

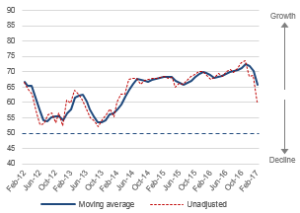
The Indian Sales Managers Index (SMI) http://worldeconomics.com/SMI/India-SalesManagersIndex.efp for February, shows the after effects of the December demonetisation policy which was intended to crack down on corruption and “black money”. The February Headline SMI has fallen to an index level of 60.2 in unadjusted terms, the lowest level in over 3 years

Headline sales manager Index

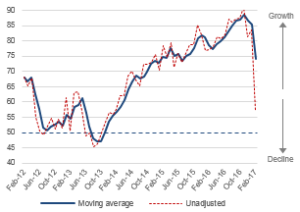
Managers are reporting a big drop in monthly sales for both the consumer and industrial sectors, with small to medium size businesses that predominantly deal with cash transactions, being hardest hit.

Sales growth Index

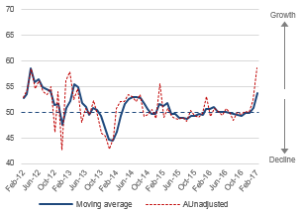
Prices are rising for both services and manufacturing sector

Price charged Index

February SMI data suggests an erratic situation for Indian businesses as they meet market challenges with considerably lower levels of confidence, slower monthly sales and higher prices caused by the currency situation.

Will India be left behind in new Industrial revolution?

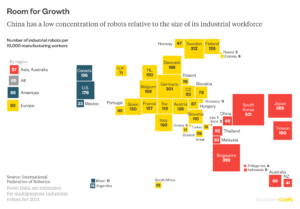
Robot Invasion Map

This map-like infographic from Bloomberg shows the ratio of industrial robots to human workers by country and region.

Larger boxes mean more robots per human factory worker. By this measure, four Asian countries stand out for their highly automated industries: Singapore, South Korea, Japan, and Taiwan. Within Europe, Germany leads. The US has proportionally more robots than Canada, and the machines barely have a toehold in South America. The main point here is who’s missing: China has barely begun to automate. This can’t persist if Beijing wants to retain its export volumes. Chinese companies are now in a headlong rush to install industrial automation technologies, and the trend will likely accelerate .

what about India?


Risk on Risk off ?……..I think risk off

It’s an unusual backdrop where “Risk On” powers equities markets melt-up, while safe haven assets trade as if “Risk Off” is lurking right around the corner. Ten-year Treasury yields declined 10 bps this week (to 2.31%) to the lowest level since November 29th. UK yields sank 14 bps (to 1.08%) to lows since October. Gold added $22 this week to $1,257, trading to the high since the US election. German bund yields declined a notable 12 bps this week to 0.18%, the low since December 29th. Even more intriguing, German two-year sovereign yields sank 14 bps this week to a record low negative 0.96%.

Consider this

1.Last week US treasury secretary pushed the deadline for tax reforms to august and there is no sight of promised infrastructure spending .Equity markets had build hopes around it

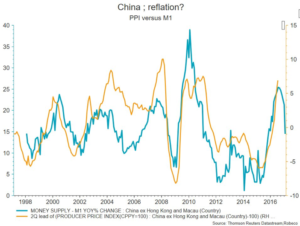
2. Trump reflation was further fuelled by massive credit expansion till january by china which lead to huge rally in commodities. chart below shows that chinese M1 is collapsing which is warning signal for commodities
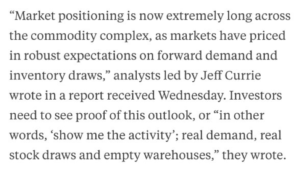
on top of that Jeff currie wrote this to his clients
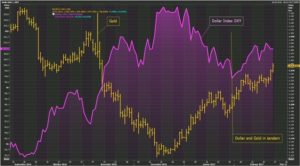
Below chart is dollar and gold. normally dollar and gold have inverse relationship and are considered as risk off trade. When you look at the chart below both dollar and gold are rallying simultaneously…. double risk off???
and this was as per marketwatch on 24th feb

“Treasury yields touched their lowest levels in more than five weeks on Friday, cementing their largest weekly decline since December, as President Donald Trump offered no new details about his plans for implementing his sweeping economic policy promises.The yield on the 10-year Treasury note TMUBMUSD10Y, +0.73% dropped 7.1 basis points on Friday, and 10.8 basis points this week, to finish at 2.317%, its lowest day-end level since Nov. 29. The yield on the 30-year bond TMUBMUSD30Y, +0.35% shed seven basis points on Friday, and 7.7 basis points this week, to end at 2.953%, its lowest day-end level since Jan. 17”

So Trump has not offered new spending plans which led to scramble in equities, chinese M1 is collapsing which is a warning to commodities rally , treasury yields are falling and the curve is flattening inspite of record short positions, both gold and Dollar rallying at same point of time, very rare…..Hmmm somewhere smart guys are bailing out of this reflation trade.

So what looks good if this reflation trade is close to unwinding?

LONG DATED US TREASURIES
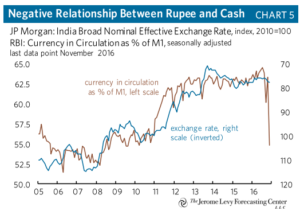
Negative Relationship between Rupee and Cash

Higher currency in circulation in last few years has led to higher demand pull inflation. High inflation if not tackled by high interest rates leads to erosion in value of currency.In the accompanying chart you can see there is a direct correlation beetween currency in circulation as % of M1 and nominal exchange rates. Since currency in circulation has never come down before nov 8 ( demonetisation), Rupee has continued to depreciate against dollar.

The correlation is so tight that by looking at the chart you can infer that even if half of currency deposited with banking system post demonetisation does not come back into circulation than Rupee nominal exchange rate will appreciate rather than perpetual depreciation that we are so used to.On the other hand if bigger portion of the money deposited with banking system post demonetisation is withdrawn it could possibly lead  to higher inflation and in turn depreciating rupee.

RBI changed its stance on monetary policy to neutral from accomodative against market expectation. Are they anticipating that most of this money will leak out of banking system?

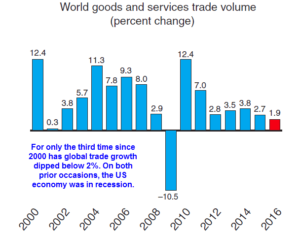
Global Trade disaster in charts

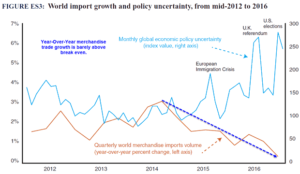
Only the third time since 2000 has global trade growth dipped below 2%. On both prior occasions, the US economy was in recession.

There is a correlation between policy uncertainty and trade growth. Higher the policy uncertainty lower is the Trade growth. Guess what, 2017 started with highest ever policy uncertainty.

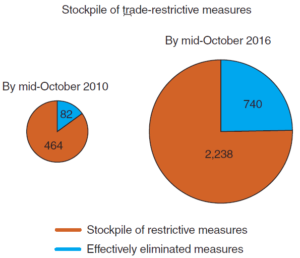
In 2010 there were 464 trade-restrictive measures on deck.
In 2016 there were 2238 trade trade-restrictive measures on deck.

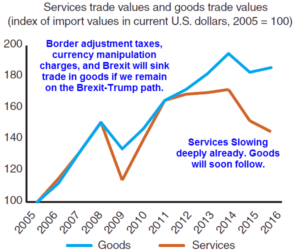
World trade was already slowing before Trump became president http://documents.worldbank.org/curated/en/228941487594148537/pdf/112930-REVISED-PUBLIC.pdf. The new wave of policy uncertainty and trade protectionism does not bode well for Global trade.