The Six Bear Market indicators as per WSJ are
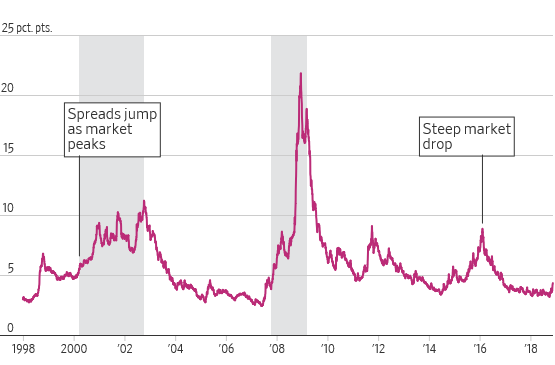
1.High-Yield Bond Spreads
A steady trend higher in high-yield bond spreads accompanied the last two stock market peaks. It signalled that investors were getting wary about riskier companies’ ability to pay back debts.Credit markets are more reliable indicator of rising recession risk
ICE BofAML US High Yield Master II Option-Adjusted Spread

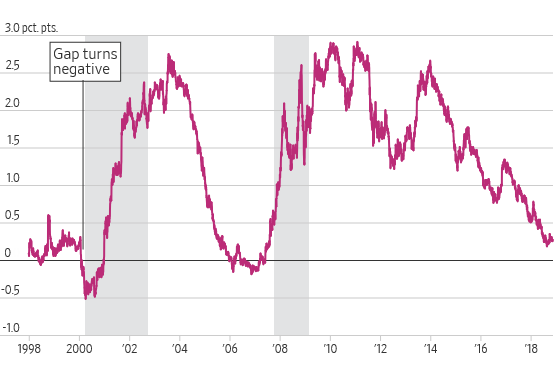
2.Yield Curve Steepness
Inversions often precede recessions and bear markets for stocks. This measure did not invert until after the 1987 bear market, but did precede the bears of 1980, 2000 and 2007. Investors are staunchly divided over whether an inverted yield curve on U.S. Treasurys can still signal a bear market, or whether rates have been distorted by years of unorthodox global monetary policy that keep yields on long-term debt low.
Gap between 10-year and 2-year Treasury yields

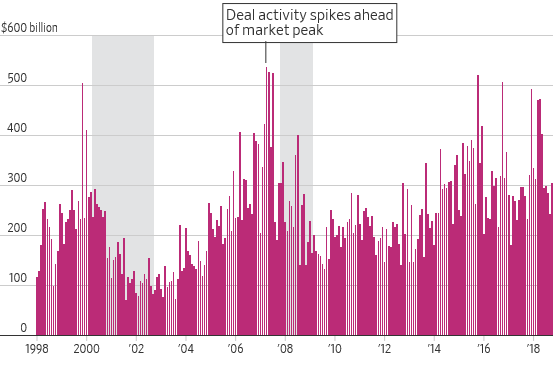
3.M&A Deal Activity and Buybacks…… I consider this to be most important indicator because it not only reduces the availability of good stocks in market but also artificially increases the accounting profit of the companies
A big pickup in deal activity has historically come toward the end of bull markets. A jump in mergers can signal that sentiment has turned excessively optimistic—or that companies see it as the only way to grow as the economy decelerates. Mergers and acquisitions spiked in 2000 and 2007 shortly ahead of the stock market peaks in a sign of excessive risk-taking. More recent peaks have been false alarms, though a spike at the end of 2015 was followed by a stock market correction that fell short of a bear market.

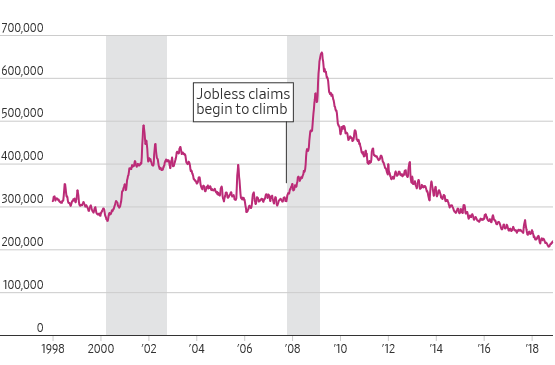
4.Weekly Jobless Claims
When unemployment rises, consumers spend less money, which crimps what companies take in. Analysts suggest looking for a consistent rise in jobless claims after a steady period. If this happens at the same time as weakness in the monthly U.S. jobs report, it is an ominous sign for the economy.

5.Investor Sentiment
Look for extreme highs and lows of investor bullishness, says Charles Rotblut at the AAII. When investors get too optimistic, they tend to run down their savings and overspend. There’s typically less cushion to protect the market, allowing selloffs to gain momentum. This measure worked very well just before the dot-com bubble burst, and spiked just before selloffs in 2011 and 2018.

6.What the Market Thinks
A relatively new measure, this chart spiked during the financial crisis and rose sharply during other recent episodes of market stress, including the 2016 China growth scare that sent markets tumbling.
