The risk-free rate is very low. As the joke goes, the risk-free return has turned into return-free risk.
How Global Markets have moved in 2021?
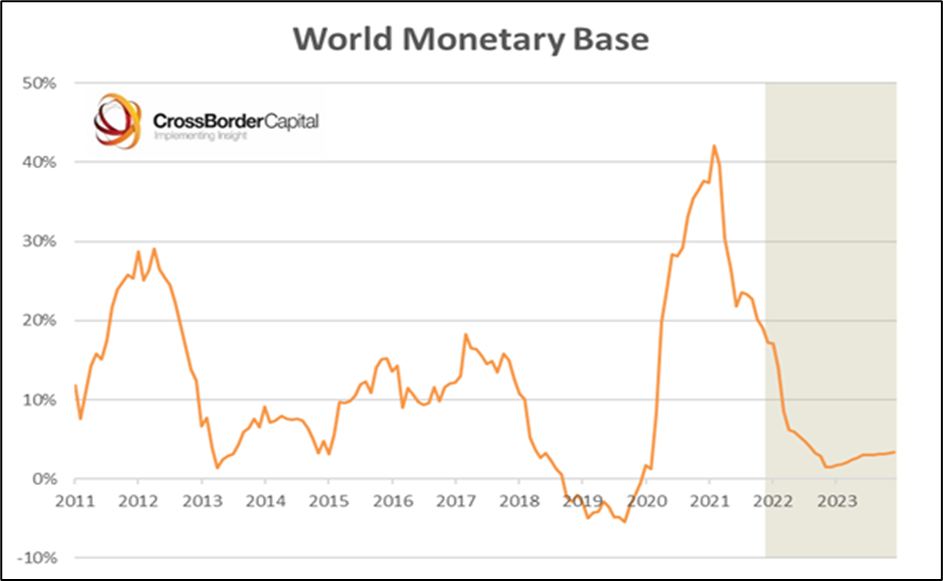
Total assets of the five major central banks (Fed, ECB, BoJ, PBoC and BoE) rose from at an average annualized rate of 32% for each of past two years.
US M2 money supply has increased at an annualized rate of 20.2%, for nearly two successive years, and now stands at over 90% of GDP, having started the millennium at 44.4% of GDP.
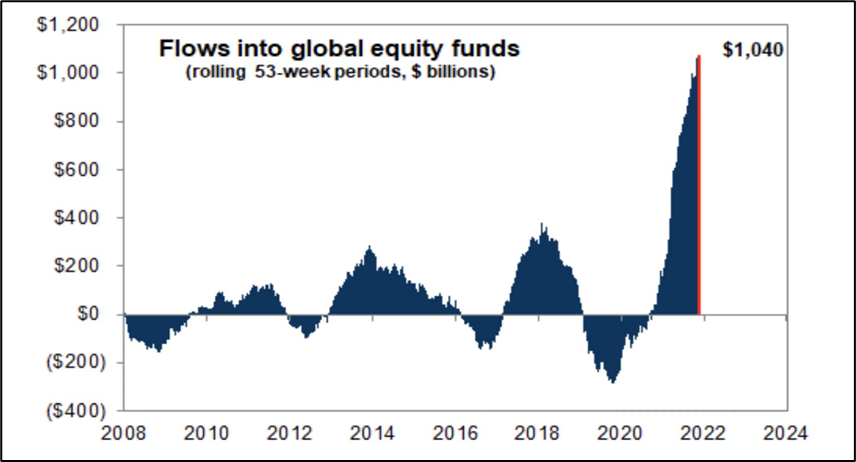
Resultant effect of excess liquidity – Global inflows into equities have surpassed $1tn in the past year, exceeding the combined total from the past 19 years – Goldman
US takes the cake in Equities
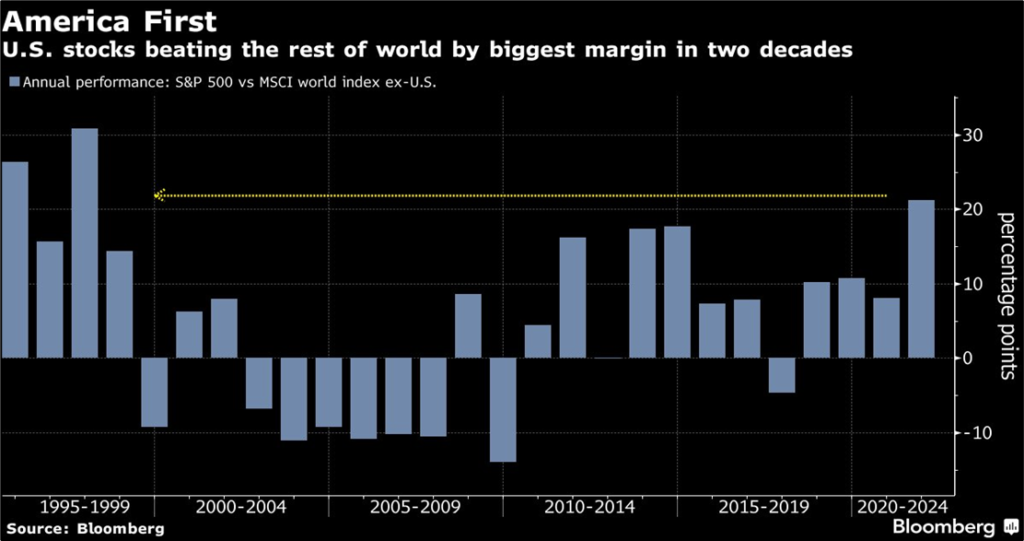
U.S. was the winner amongst major nations attracting maximum investor inflows; clearly driven by massive liquidity infusion and recycling of flows to equities in a negative real rate environment.
US stocks are beating rest of world by most in 2 decades. The S&P 500 has surged 25% YTD compared with 3% gain from the MSCI All-Country World ex-US Index.
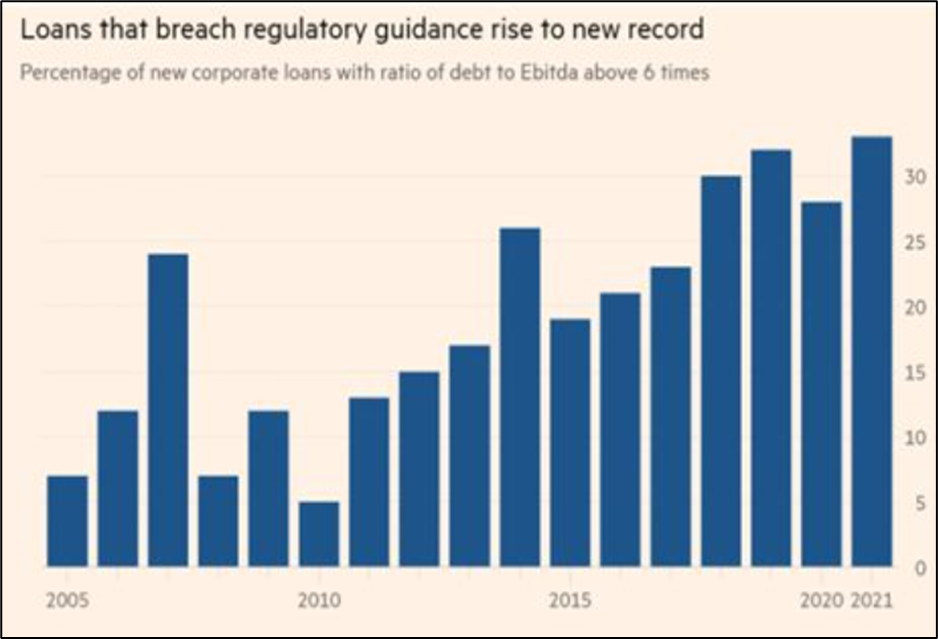
Capital misallocation at its highest level
Excess liquidity is keeping the zombie companies alive
There is a twist in the tale
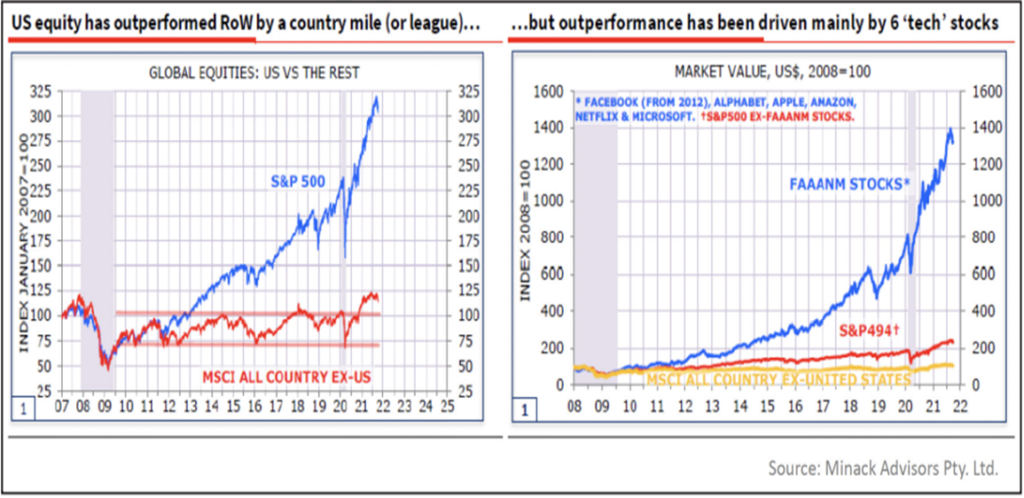
The U.S. equity market has outperformed the rest of the world dramatically, since the last peak of 2008 on an index basis. It has gone from 100 to over 300. Whereas the world index just went from 100 to about 115.
Here comes the differentiator – FAAANM (Facebook, Alphabet, Apple, Amazon, Netflix and Microsoft) stocks from early 2008 onwards have gone up 14-fold; whereas, the other 494 S&P 500 stocks went up from 100 to 215. World markets haven’t seen anything like it and not even Japan was as excessive.
Money (excess liquidity) moved into US tech rather than US Government bonds
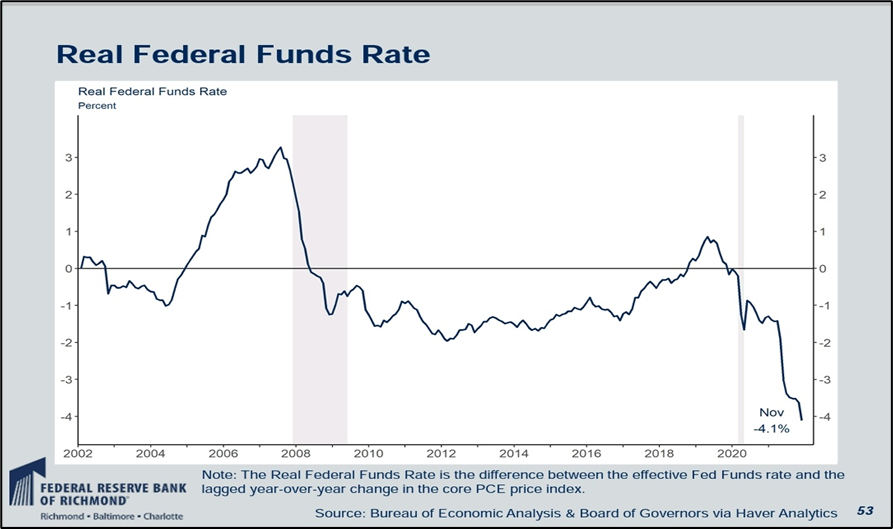
What happened to SPX back in 2018 when real fed funds went positive? After peaking in Oct’2018, markets corrected ~17% till Dec’2018 in response to rising real interest rate.
……but with a pinch of salt
Historically, U.S. Treasuries (USTs) have been the go-to asset of foreigners to hedge global portfolios in/for turbulent times. In March 2020, this was violated and since then foreigners continued to sell USTs. Infact since 3Q14, foreign/international investors have stopped buying sufficient USTs, buying only ~$900 billion of $11 trillion in UST issuance in that time.
So, what changed the world to move away from ‘risk free asset’ (or call it return free risk)
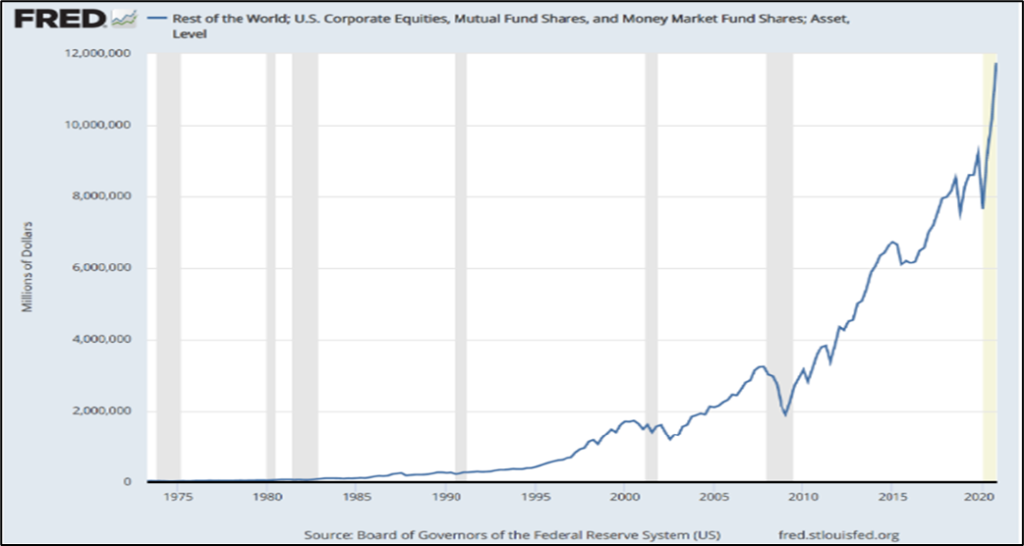
Global Central bankers (to manage reserves) have been turning to new (riskier) investments to compensate for collapse in bond yields. Historically, foreigners bought USTs to sterilize USD outflows & maintain currency stability; but in recent years (specifically post 2020 UST illiquidity crisis), they’ve started switching to U.S equities to sterilize USD outflows.
Making it an extremely volatile and negative yield for Bond holders
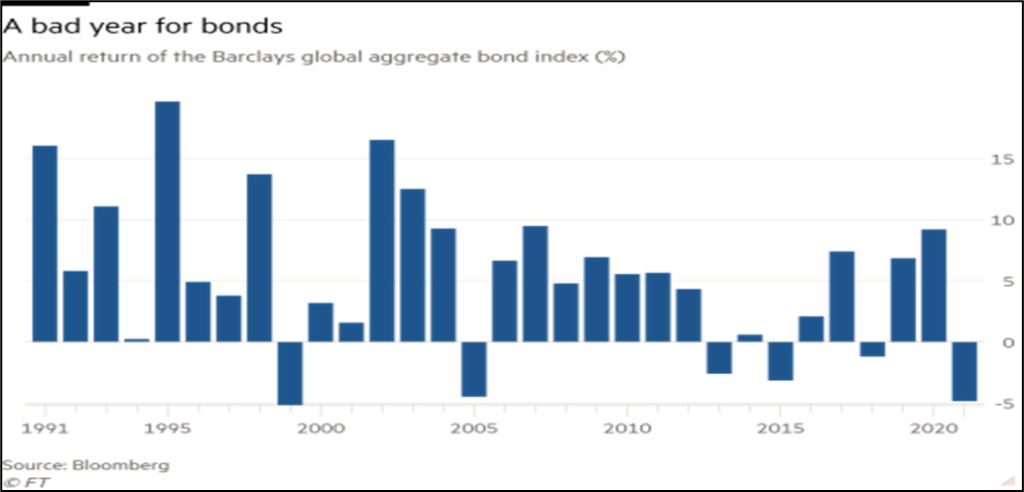
Barclays global aggregate bond index: -4.8%. Treasury investors are losing more money than they have in four decades since 1980s, once inflation is taken into account.
Except China – China takes the cake in Bonds
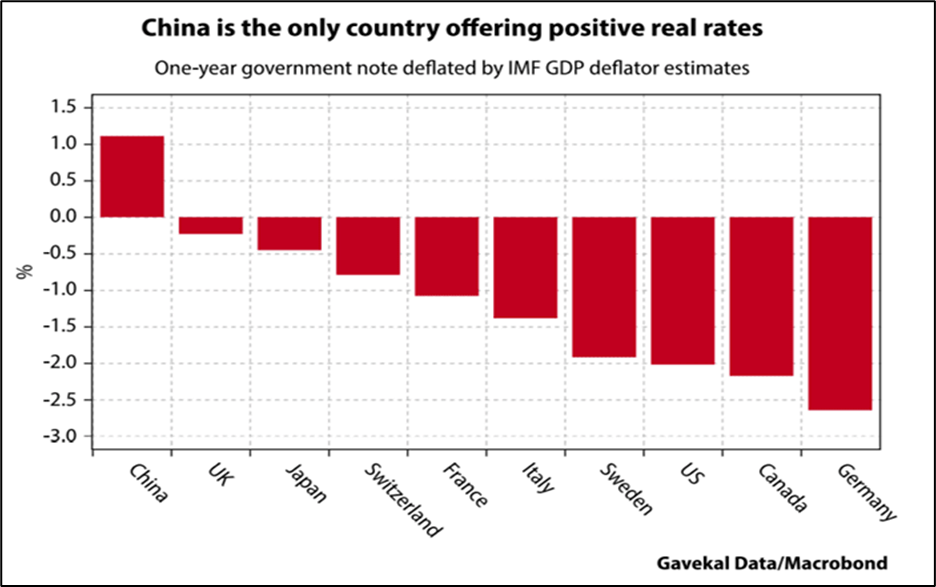
China is the only major country with positive real interest rate attracting savers since past 2 years. But this is turning to be a nightmare for borrowers/corporates/developers with interest outgo more than the inflation in a looming Debt scenario, leading to defaults. ‘Positive Real rates leads to defaults.’
Is this leading China into easing policy rates?
Still wondering ‘Why’ were markets so strong this year?
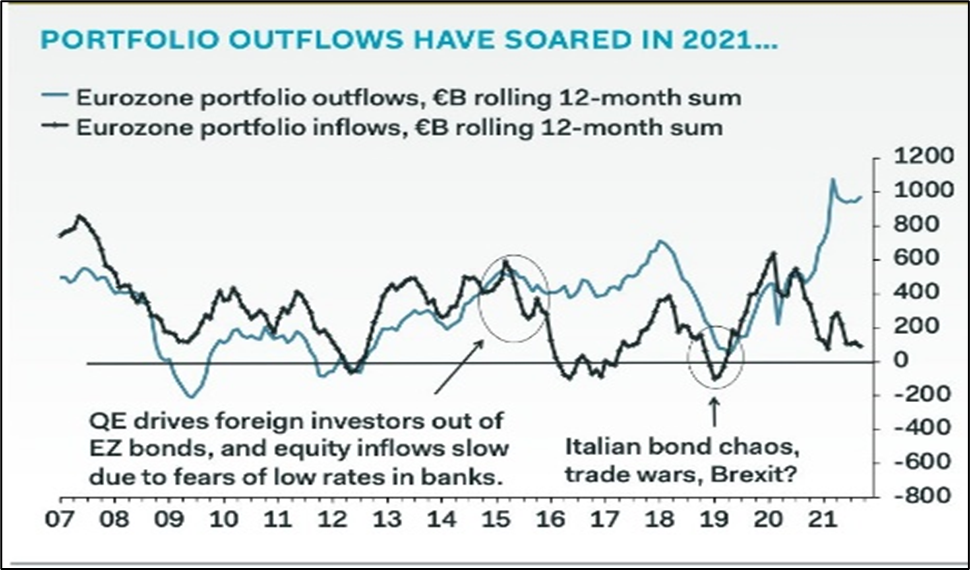
Europeans have recycled almost half trillion in US stocks
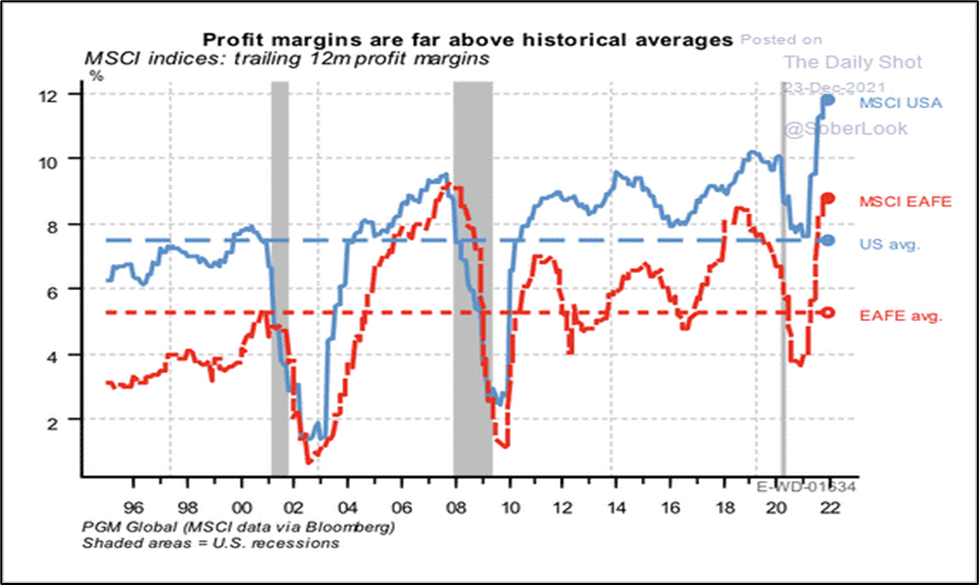
What will normalize these fiery markets?
Strong markets have been supported by higher margins. As liquidity tightens and low-cost inventories runoff, we should see margins normalize.
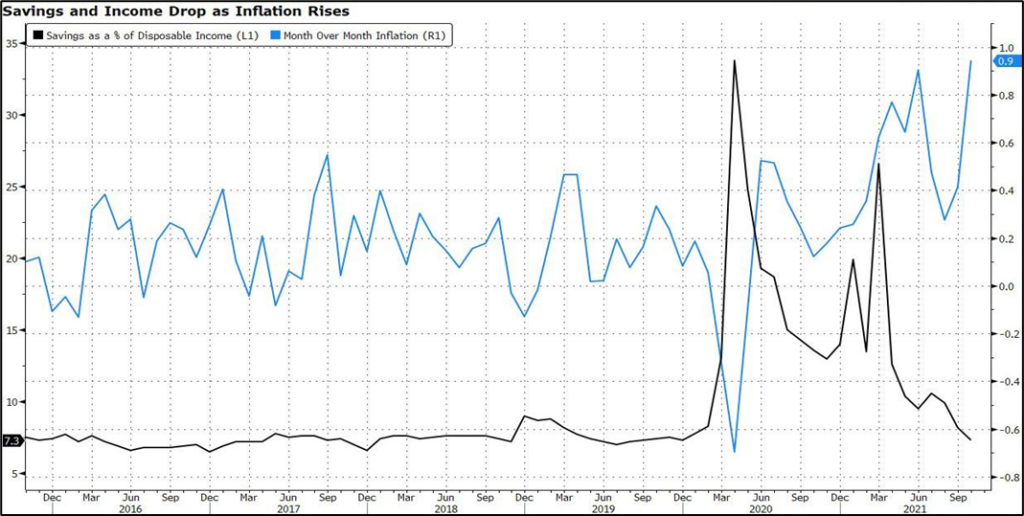
‘INFLATION’
US saving rate is now at pre pandemic levels of 6%. Rising supply side driven inflation coupled with drop in cash reserves has vast implications for the working class and could dampen consumer spending, a large share of economic activity/GDP.
Good Inflation = Demand driven; Bad inflation = Supply driven
Higher inflation is a politically unacceptable scenario, pushing central bankers to expediate the pace of rate hike.
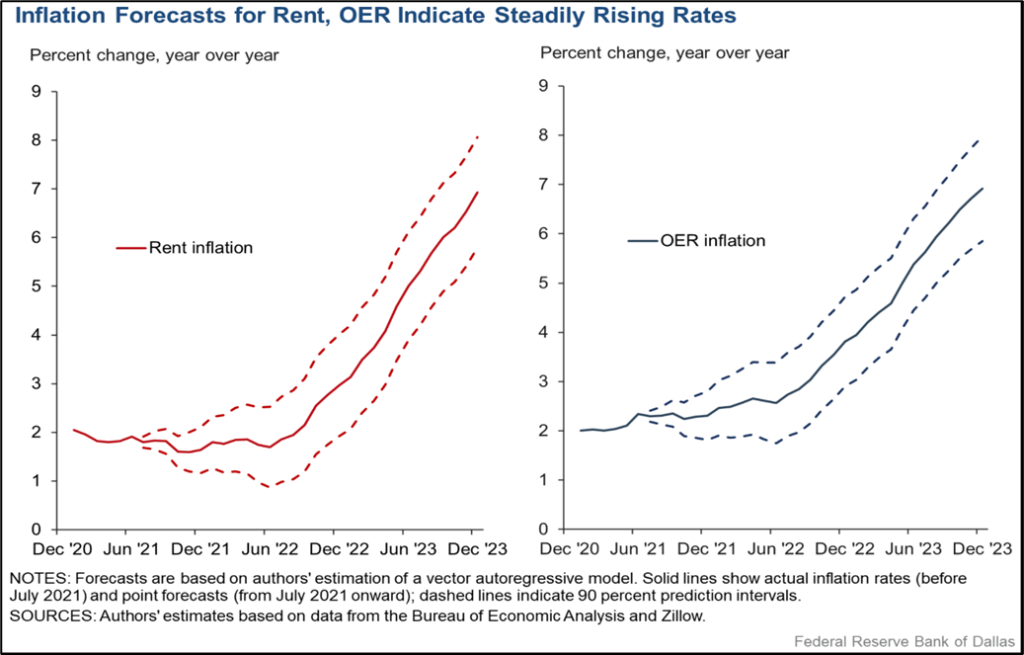
Inflation is moving from financial assets to real economy
Headline inflation might soften next year but Core inflation will keep rising. This is important as core inflation is considered a prime indicator of underlying long-term inflation and impacts rising prices on consumer income & investments. Dallas FED just predicted 7% Rent inflation by 2023. Rents are 40% of US CPI index.
Ultimately, it’s all about ‘Liquidity’ flows
Only thing that will vary amongst nations is the quality of liquidity added to the system.
China easing at a time when world markets are tightening will add “responsible” liquidity and US will withdraw liquidity given inflation fears. This tale of reversing tables will drive volatility across asset classes in the quarters ahead.
What if Liquidity turn into Headwind from Tailwind
Liquidity projections of Central banks warn of a Sharp slowdown in 2022 led by tapering and eventually translating into rate hikes.
Leading to liquidity situation dramatically different from that seen in 2021
US treasury spend $1.5 T in 2021 by drawing down on cash balances. In 2022, they will rebuild their balances to $500 B. That means they are going to soak out of the system about $400 billion.
A renewed dose of QE or a ‘Powell Put’ seems the inevitable remedy for the next stock market sell-off. In short, future growth of global liquidity has seemingly become institutionalized by these debt burdens.
Divergence amongst Central Bankers on Monetary policy way ahead
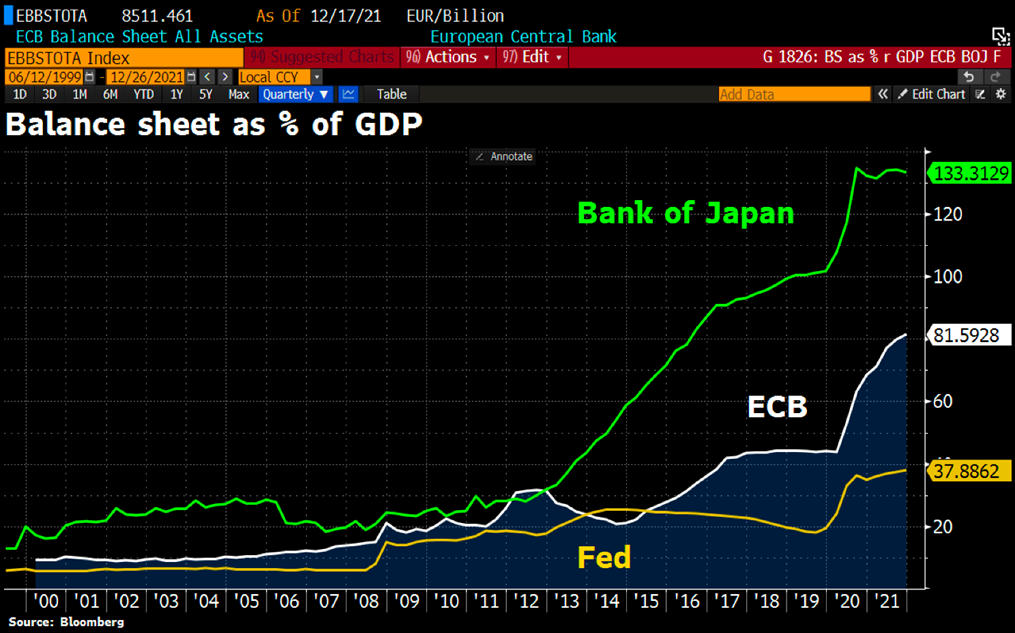
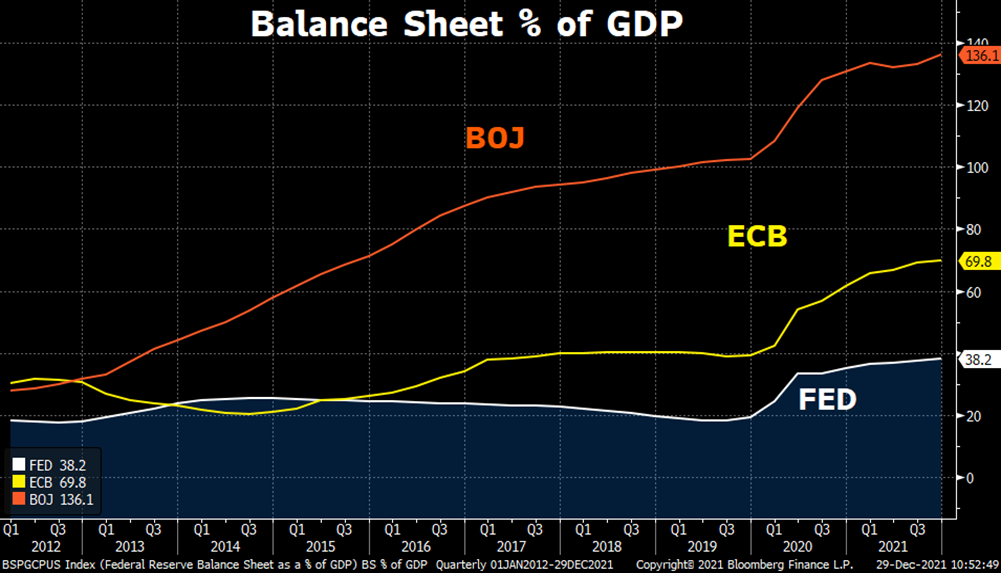
Significant differences between the US and Eurozone, could open up major policy divergence between Fed and ECB policy over the coming years, with the fed funds rate rising; while, the ECB is not expected to raise interest rates and continue liquidity easing. Interestingly Japan has been growing at the pace of economic output since Sep 2020.
BOJ and Fed have started to flatten out. ECB will start flattening by second half of 2022.
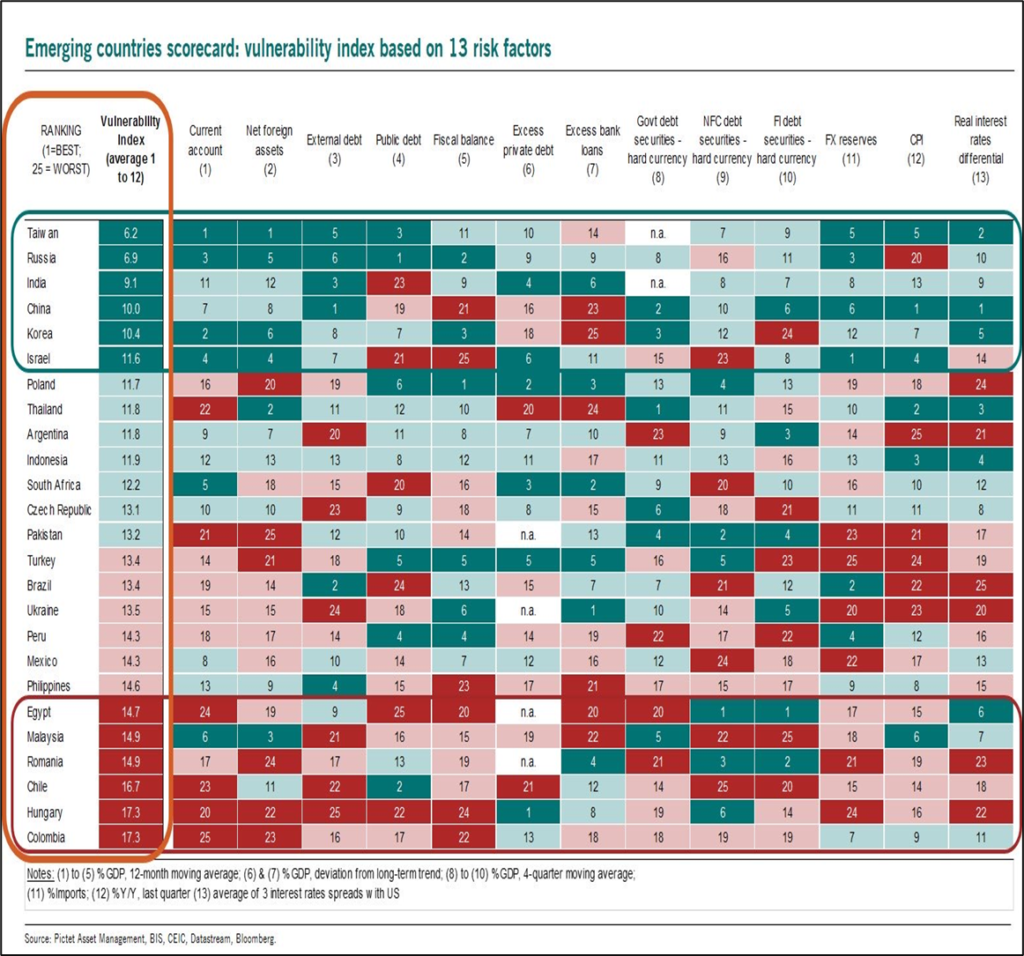
Emerging Markets’ vulnerability to Fed tightening
Markets globally get affected when the interest rates are hiked in the US. Amongst all major Emerging markets, India seems to be fairly insulated on the basis of vulnerability index.
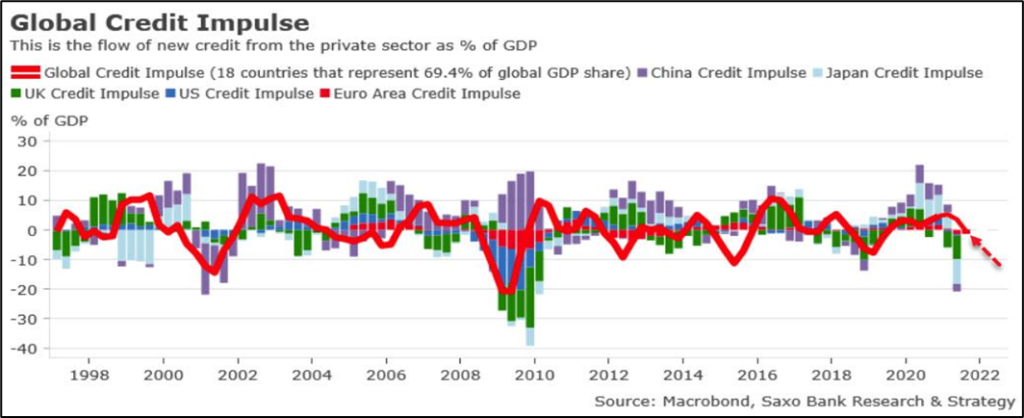
In an era where most economics are tracking a negative Credit impulse
The global credit impulse is now in contraction territory, running at minus 1.3 % of global growth (Saxo bank). When the credit impulse is negative, expect that growth will cool down significantly in the next six to nine months afterwards. Will we see turnaround in credit cycle for countries like China, Japan etc.?
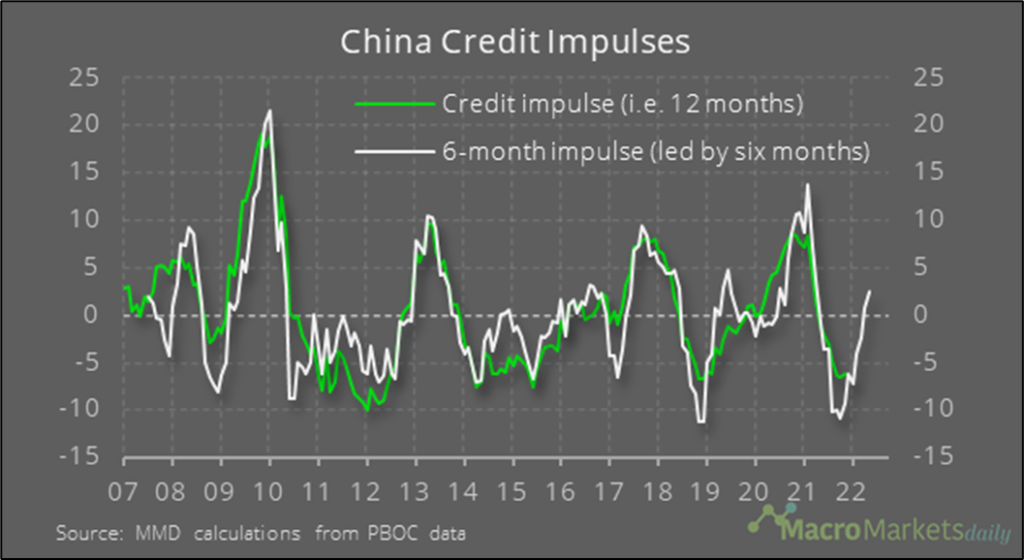
China is slowly showing ray of hope: Positive expected Credit impulse + Monetary easing = ‘Growth’?
Bloomberg’s China Credit Impulse finally ticked higher this November. PBOC has started easing monetary policy and pledged healthy credit growth rates; which is expected to reflect on Global GDP. There is a strong correlation between credit impulse and investment growth, the rise in credit impulse may help push the growth of real investment in the near future.
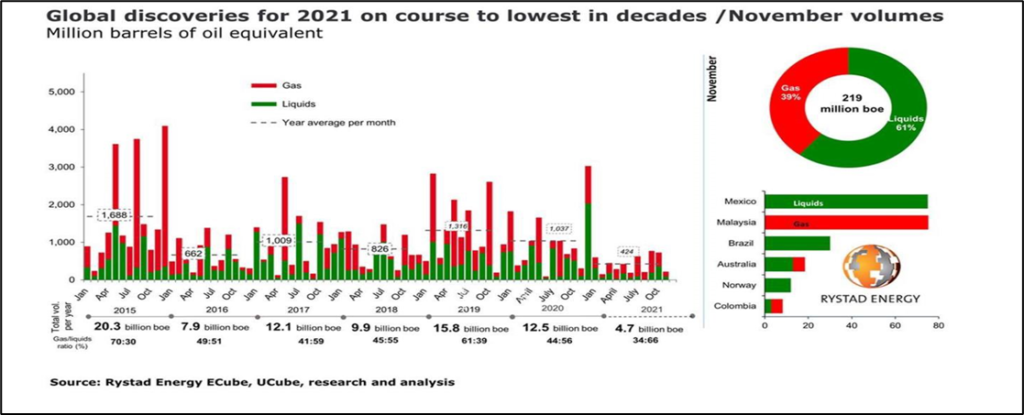
With rising Oil prices acting as a major headwind to global growth
2021 sees oil and gas discoveries sink to lowest level in 75 years. Supply constraints will lead to higher energy prices. Saudi Arabia said global oil production could drop 30% by the end of the decade due to falling investment in Fossil fuels. The resultant could be an ‘Energy crisis.’
What could lead Oil to $200 by 2024? The rise will not be demand driven but due to supply side/productivity issues. We have had a 12-year bear market in commodities, and therefore we have had a tremendous underinvestment, leading to structural shortage in supply.
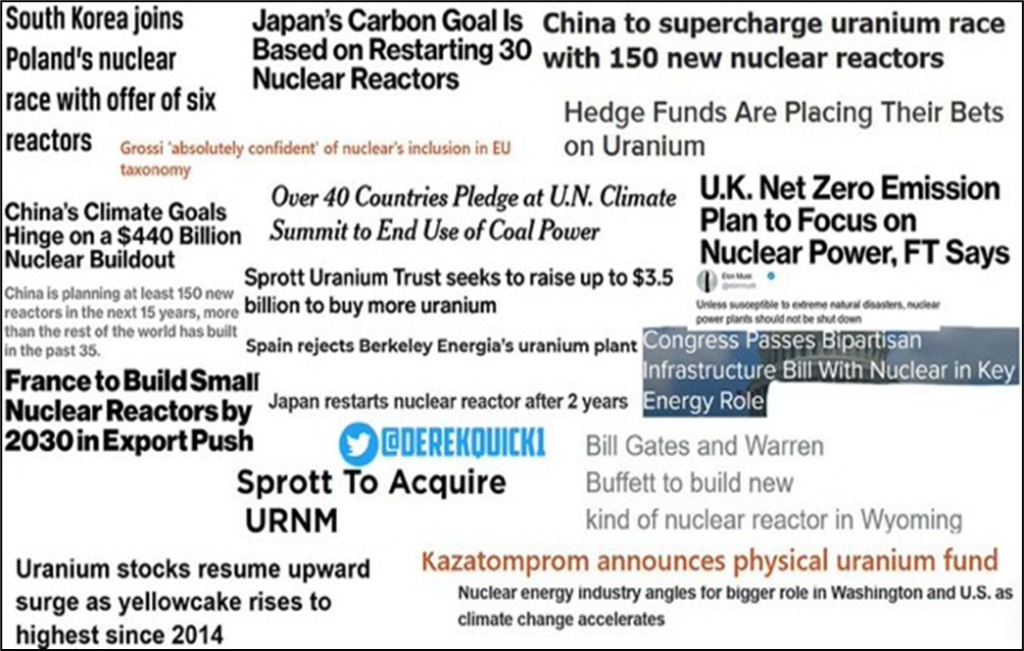
And continued Shift of focus to Clean & Green Energy as an Investable Asset
Europe will most likely be adding nuclear energy in its Taxonomy
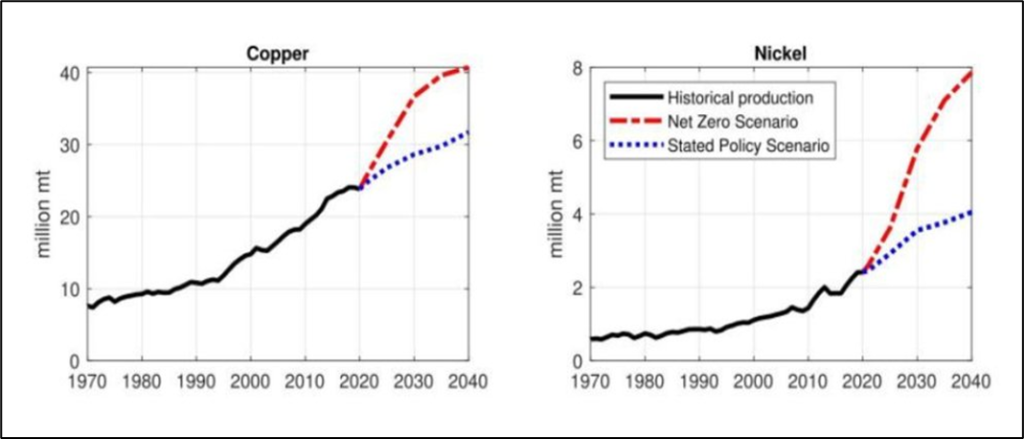
Providing impetus to demand prospects for Copper & Nickel under Net Zero Emissions scenario
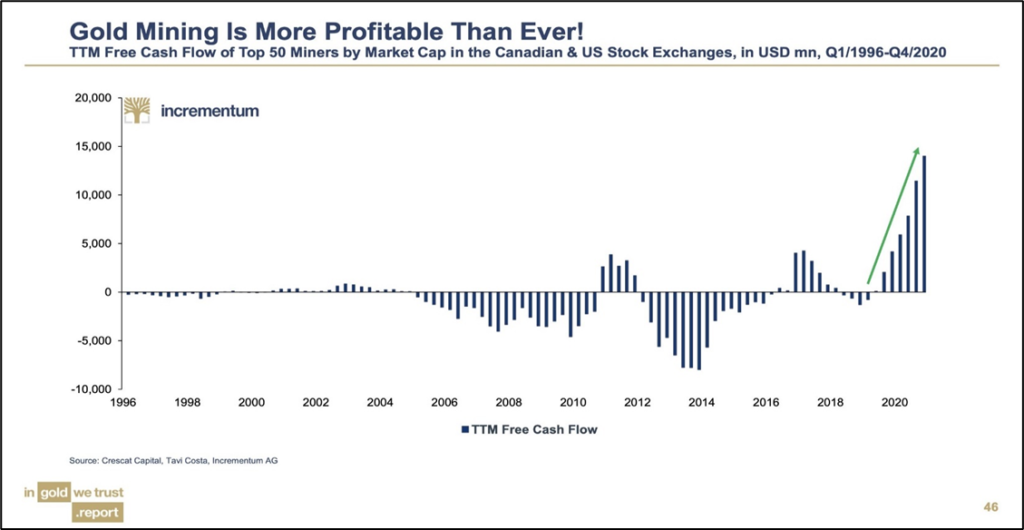
In a separate world, Gold continues to shine…atleast in cash flow terms
Gold miners are producing higher free cash flows than ever. Will be lead to increased buybacks or dividend prospects?
Global Markets Outlook
Inflation has emerged as the key risk for the global economy. Inflation, it said, has clearly been more persistent and more broad-based than what the Fed and most market participants, had anticipated it to be. This has led to increasing market expectations that monetary policy globally is set to become tighter.
Global liquidity situation will be interesting to watch as central bankers tighten in response to inflation fears and China goes for ‘responsible Easing’ liquidity scenario.
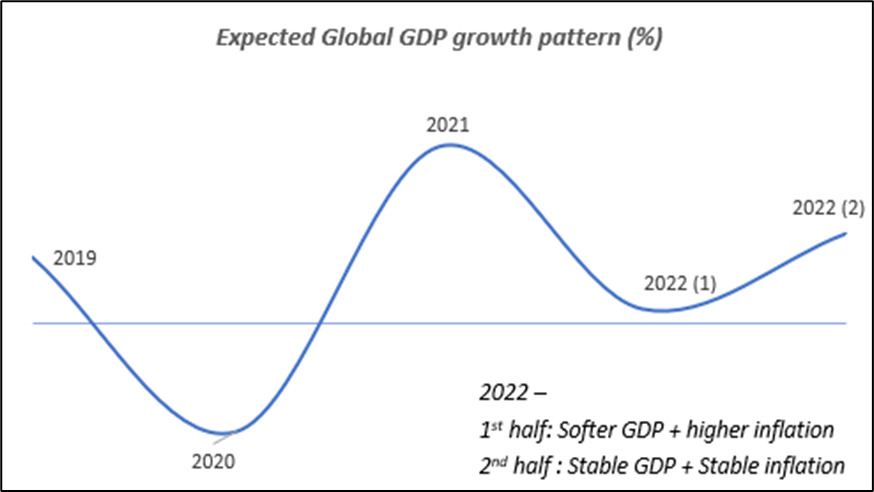
Volatile H1 2022 with chances of drawdown exceeding 10% as Central Bankers try tightening the Liquidity. 1st half of 2022 may witness low growth in global GDP with recovery being witnessed in the 2nd half given strong baseline effects.
High growth stocks to underperform in a US rate hiking cycle with inflation scares leading to investors rotate away from high-multiple tech stocks and into sectors that hold up better in a rising rate environment. Those include financials, energy and consumer goods, as well as industrials and real estate.
Corporate bond spreads and Emerging bonds will start underperforming US bonds due to Fed Tapering.
As base line inflation effects fades in 2022 and GDP growth flatlines, one might see Fed tempering its Hawkishness in response to low growth.
“Monthly inflows through the systematic investment plan (SIP) route reached a new high in November to over Rs 11,000 crore as retail investors continued to put their money in mutual funds (MFs) through this. The record monthly inflows came despite a volatile equity market during the month with the number of outstanding SIPs now at 4.8 crore, also an all-time peak.” Economic Times
Jack Schwager’s trader-interview book The New Market Wizards,includes an interview with Stanley Druckenmiller. Druckenmiller in my view is a smart investor and is not shy to talk about his trades.
One idea in particular caught my attention. Druckenmiller tells Schwager that: “I never had more conviction about any trade than I did about the long side of the Deutsche mark when the Berlin Wall came down. One of the reasons I was so bullish on the Deutsche mark was a radical currency theory proposed by George Soros in his book, The Alchemy of Finance. His theory was that if a huge deficit were accompanied by an expansionary fiscal policy and tight monetary policy, the country’s currency would actually rise. The dollar provided a perfect test case in the 1981-84 period. At the time, the general consensus was that the dollar would decline because of the huge budget deficit. However, because money was attracted into the country by a tight monetary policy, the dollar actually went sharply higher. When the Berlin Wall came down, it was one of those situations that I could see as clear as day. West Germany was about to run up a huge budget deficit to finance the rebuilding of East Germany. At the same time, the Bundesbank was not going to tolerate any inflation. I went headlong into the Deutsche mark. It turned out to be a terrific trade.“
Today United states is almost in a similar situation. Covid 19 and a new cold war with China has presented an opportunity to the US to Build Back better and Fed policy has been generally been supportive of the US fiscal policy although they had started tapering their QE in Nov 2021.
as Michael Lebowitz writes
“Over the last few months, the Federal Reserve has taken on a more hawkish tone. Economic activity is more robust in the U.S. than in most of the world, and its inflation rate is higher. The justification for halting QE and raising rates is palpable. The currency markets are signaling through a stronger dollar, the Fed will remove emergency accommodations quicker than most other nations.
As a result, the U.S. dollar index has appreciated 7.7% this year to date. The list below shows how much selected currencies depreciated against the dollar over the same period.
As the dollar appreciates, foreign borrowers of U.S. dollars need more U.S. dollars to pay the loan’s interest and the principal. When borrowers raise the dollars required to meet their obligations, they cause further dollar appreciation. At times, especially during a crisis, when many borrowers are forced to take such actions, a global run on the dollar occurs and pushes the dollar significantly higher, worsening problems for dollar borrowers.“
Federal Reserve today increased its hawkishness further and has indicated tightening the liquidity and will stop doing QE altogether by early 2022. Whereas its European, Japanese and Indian counterparts will still continue to expand their Balance sheets, while the US fiscal deficit is set to surge further following a new Build Back better bill.
Conclusion
This creates a lethal cocktail of rising US deficit which needs to be funded by Bond market without any helping hand from Federal reserve. This as Druckenmiller suggested above ,should be further supportive of US dollar. Emerging markets would need to sacrifice their future growth due to this change in Fed policy and raise rates more than required/ tighten domestic liquidity or face higher currency and interest rates volatility.
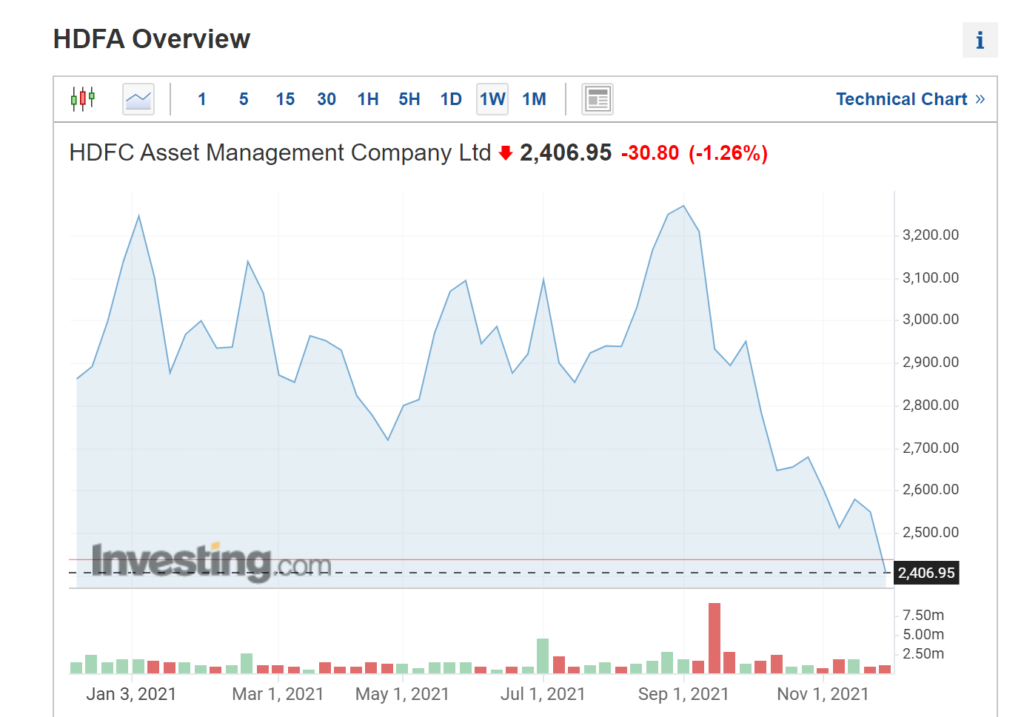
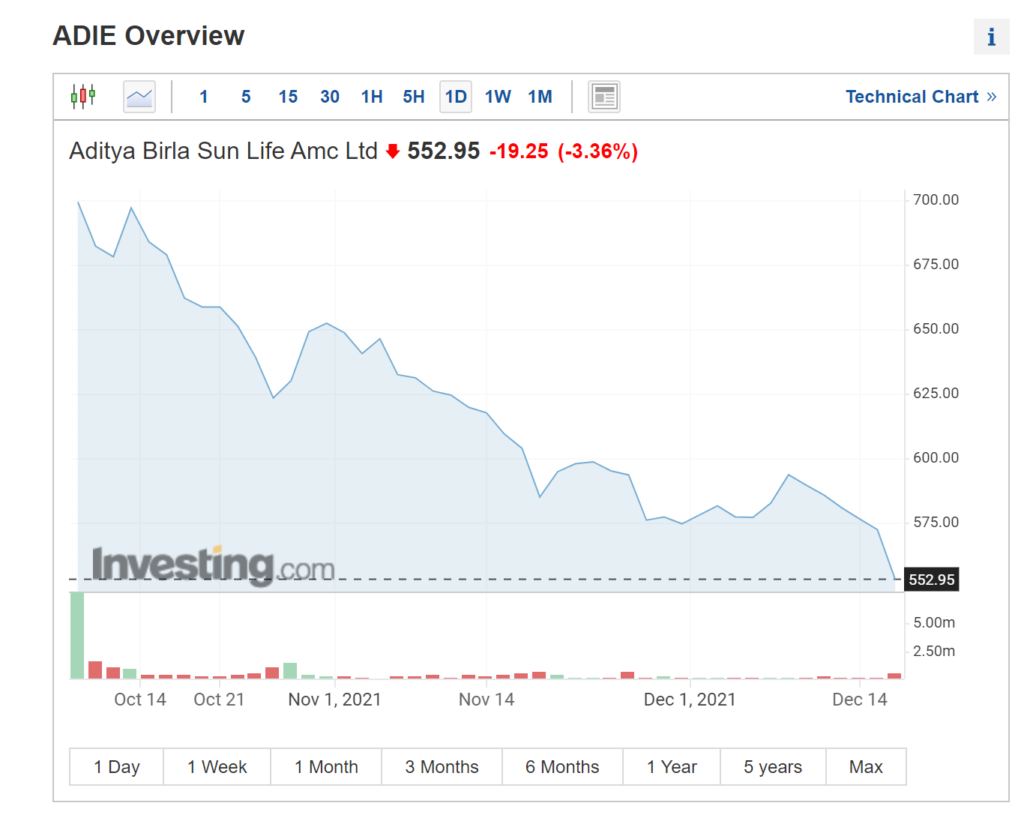
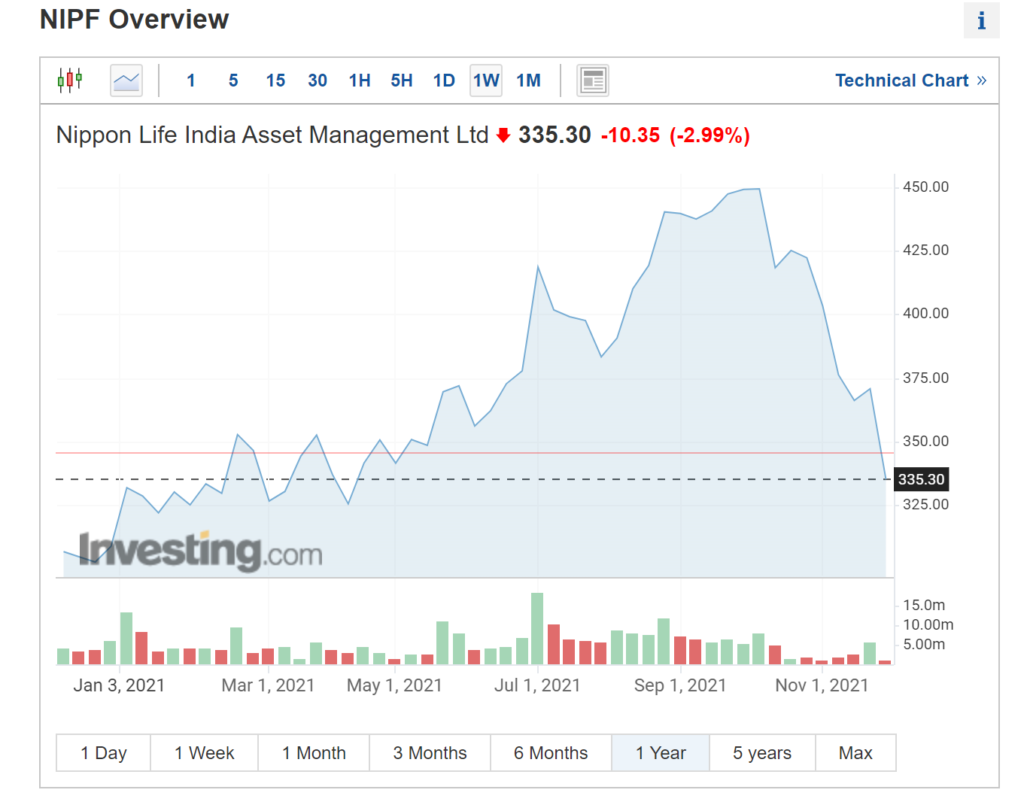
Let me explain why Indian markets continue to be on a tear
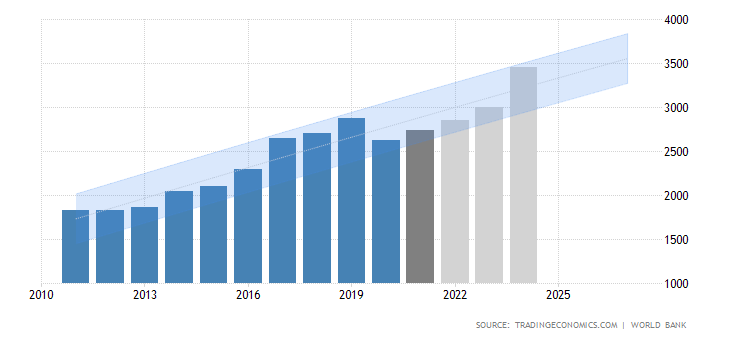
India’s GDP (trend growth) has bounced back in 2021 after covid bump of 2020. This economy will fully recover by 2023.
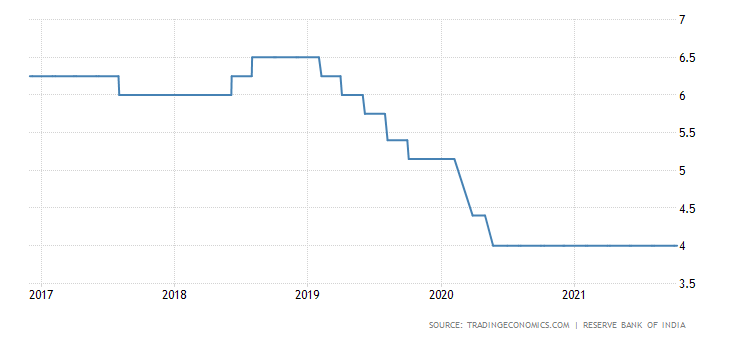
But look at the RBI repo rate. RBI cut repo rate by 100 bp last year and has not started reversing any of the emergency rate cuts.
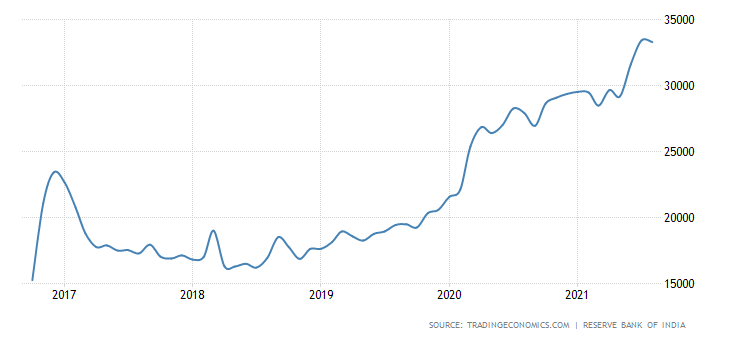
Also look at the RBI balance sheet. RBI not only cut the rates but increased its B/S by 75% in last 12-18 months. This is RBI effectively funding govt deficit and keeping an artificial lid on interest rates which govt should pay on its borrowing. This is effectively increasing the liquidity in the banking system without any addition to the productivity of the Indian economy.
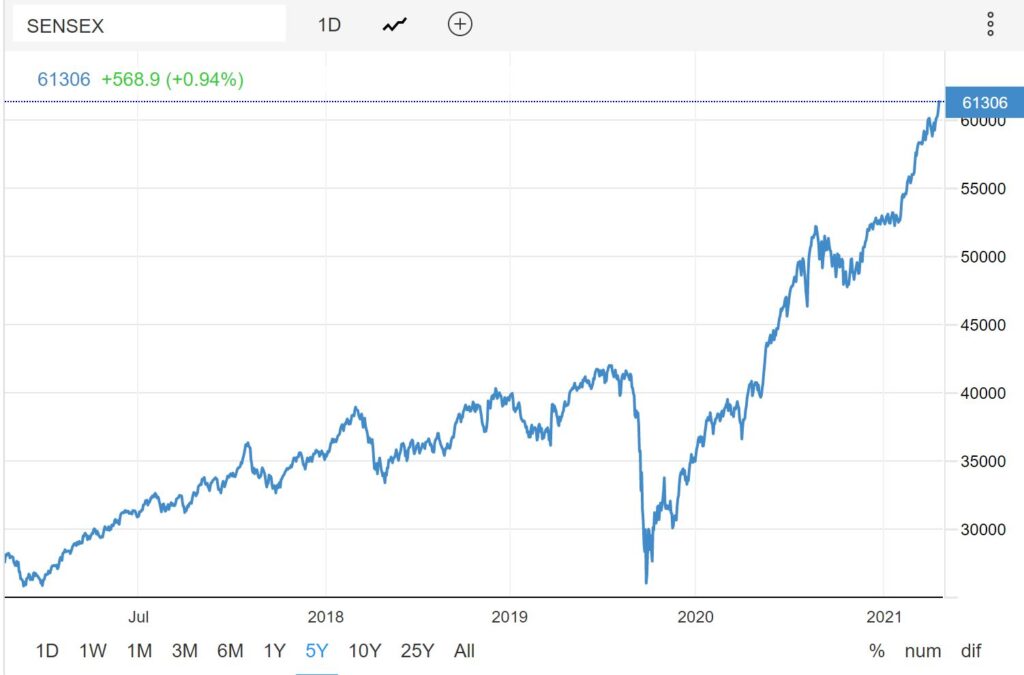
This ( excess liquidity) money can either go for business activity or it can go to where it can find instant gratification i.e Stock markets. No surprise that this money went into equity markets. Foreign inflows were also positive during this time and more so after china crackdown on its tech sector. Some of this foreign money left china and came to India.
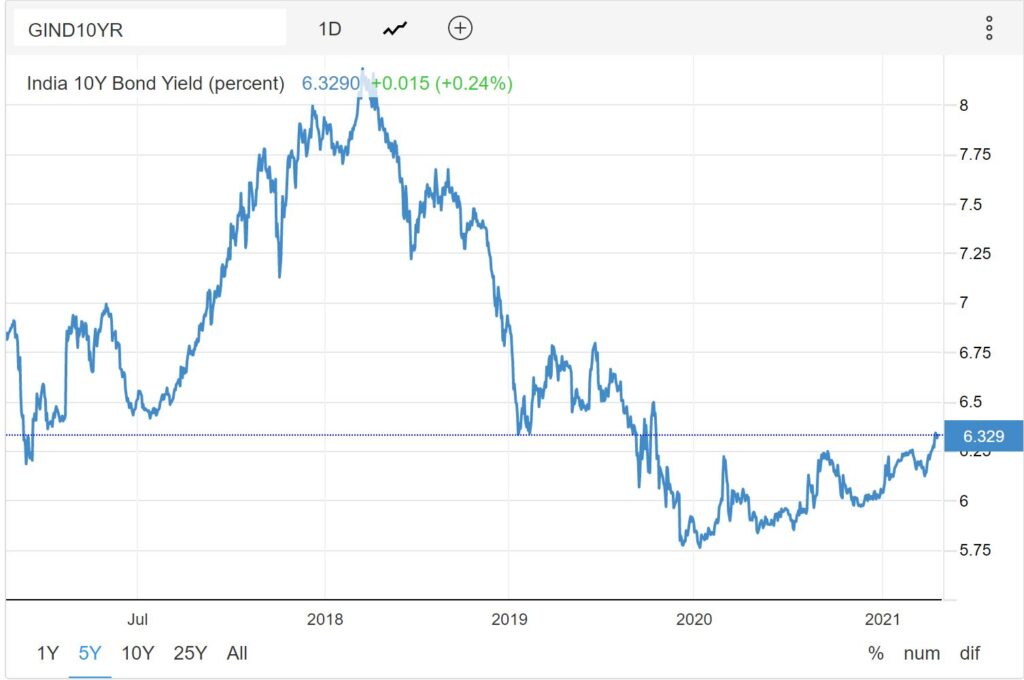
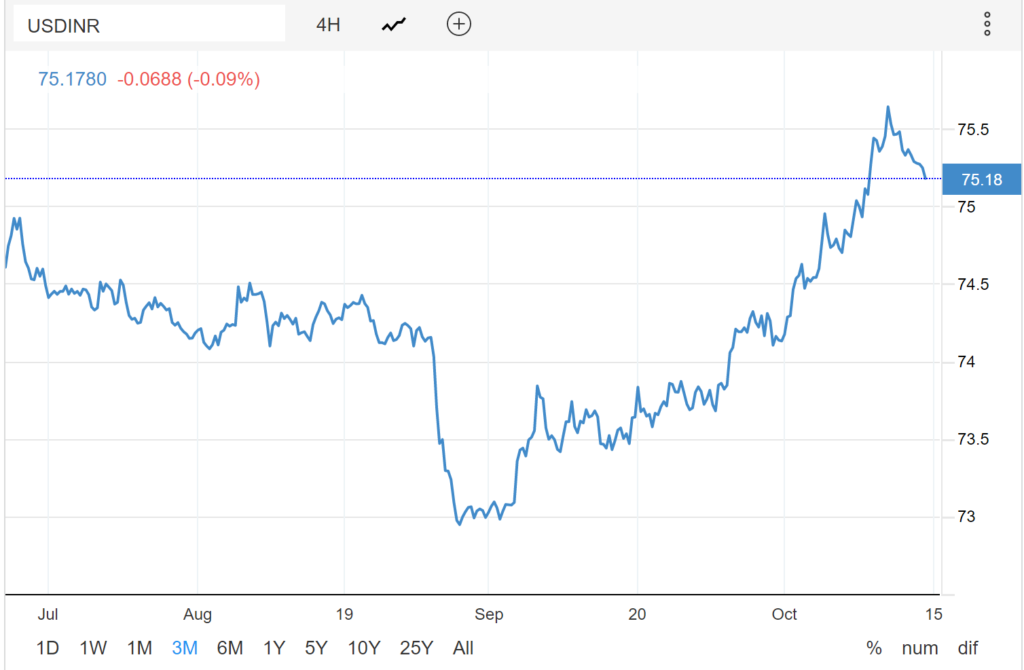
but bond market ( which is the first one to revolt against excessive money printing) is already saying enough is enough and threatening to raise the interest rates for you, me and govt. Indian 10 year bond yield touched 1 year high this week.
Indian currency INR is also now getting annoyed at this excess liquidity in the system lately. The chart below is only of last 3 months.
Conclusion
Indian Central Bank was instrumental in creating this liquidity which as I mentioned above did not go in creating jobs or increasing productivity. It went into the asset markets which is threatening to get out of control if RBI does not immediately increase the cost of money.
As chuck prince once said “As long as the music is playing, you’ve got to get up and dance.”…I would only suggest that dance near the door.
2.The Bloomberg Commodity Spot Index, a basket of 23 energy, metals and agricultural raw materials contracts, jumped to an all-time high on Monday, surpassing its 2008 and 2011 peaks set during the commodity super-cycle (Bloomberg)
3.Everybody’s going to be disciplined, regardless whether it’s $75 Brent, $80 Brent, or $100 Brent,” Sheffield said. “All the shareholders that I’ve talked to said that if anybody goes back to growth, they will punish those companies.”
“I don’t think the world can rely much on US shale,” he said. “It’s really under Opec control.”( pioneer CEO US shale patch biggest operator)
4.There are two things that always happen at or prior to the start of a boom-to-bust transition for the US economy. One is a clear-cut widening of credit spreads and the other is pronounced weakness in the Industrial Metals Index (GYX) relative to the gold price. These indicators have sometimes warned incorrectly that a bust was about to begin, but they have never failed to signal an actual boom-to-bust transition in a timely manner. Clearly, neither of the indicators that in the past have always warned prior to the start of a boom-to-bust transition for the US economy is close to triggering. This means that the economic boom* that began during the second quarter of 2020 remains in full swing.
5.The economic results of this new focus will be: ever-bigger government, more intrusive regulations, supply chain disruptions, inflation, no price discovery, a general hard swing to the left in the western world and―not least―the increased “channelling of capital” into small pockets of investable resources and assets. This could be the 1970s all over again, except this time it’s all about the political imperative of the decarbonisation of the economy, whatever that means for real growth.
I recently had a chance to connect with Neppolian of Jade finance and below is the summary of main points
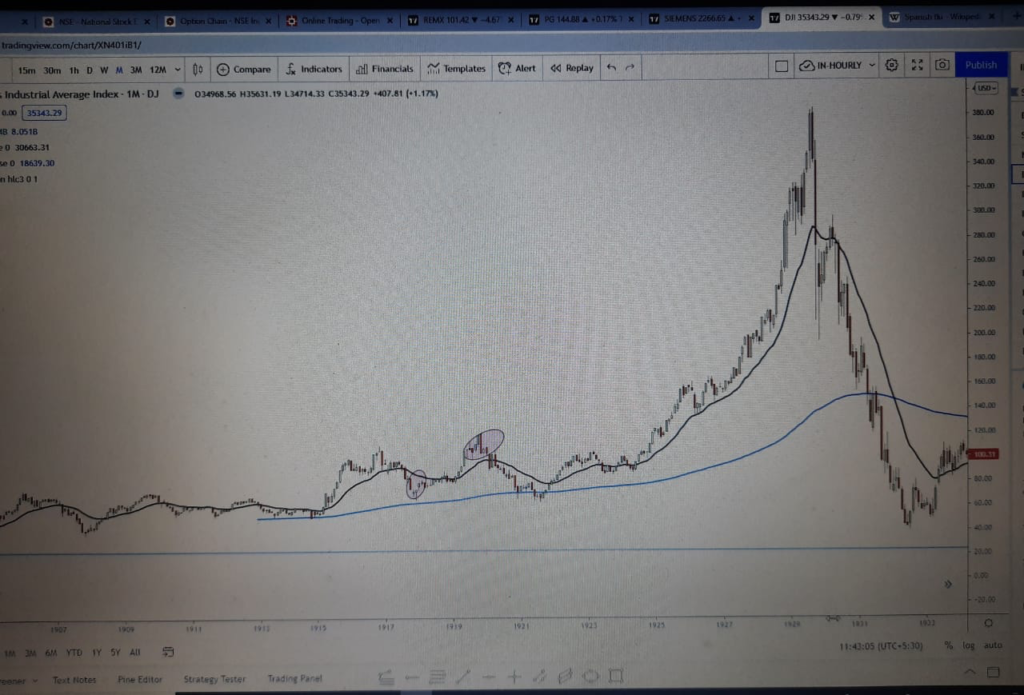
Analogy of Spanish Flu from Feb 1918 to April 1920: using DOW
1. The index bottomed in Dec 1917 (ending a 13 month bear market from Nov 1916 suffering a 40% drop).
2. Markets rallied ahead of the arrival of Spanish Flu proving once again that there is no better lead indicator than financial markets. Spanish Flu originated in US in Feb 1918 as an antidote to end the previous bear market. (We had amply proved in our 2014-15 pandemic report that, pandemics have historically bullish for markets and generally stike at the fag end of a bear market).
3. Dow rallied 85% from the bottom to register a top in Nov 1919. So, Dow topped 4 months before the Spanish Flu officially ended in April 1920. By April 1920, Dow had already corrected 25% from the top. Markets again proved to be the leading indicator.
4. Dow eventually fell much deeper and went on to retest the Dec 1917 bottom in August 1921. Then it was testing the 200MMA support.
5. The bear move began after the Dow closed under 20MMA in Feb 1920.
6. We don’t know, as of now , when will the Covid19 pandemic end. We do hear certain voices that by Mid 2022 the Covid19 pandemic may largely be over. However, going by history, the markets may top out and begin a correction a few months ahead of the pandemic officially ending.
7. Dow has rallied 95% from the Covid19 bottom of 18200. We are into the 17th month of rally from the bottom.
8. Technically Dow looks stretched with collapsing internal breadth numbers.
9. The signal to sellout (20MMA) is now at 30600, approximately 15% lower. Portfolio may suffer badly by the time we wait for the breach of 20MMA. It may not be out of place, actually may be prudent to consider proactive profit taking from CMP of 35600 to further upsides if any.
10. The 200MMA is now placed at 18600. Though in the Spanish Flu of 1918, Dow eventually fell to test 200MMA , we are in no way advocating that it would so this time around too, but our endeavor is to lock in profits when the markets allows us rather than sell in panic when it reverses.
11. It is to be remembered and noted that post the August 1921 bottom retest , the DOW launched itself into the most biggest rally of 8 years upto 1929. The antidote provided by a pandemic is generally long term and a bullish sign for the decade.
However, portfolios survive better by being light at market tops and heavy at market bottoms.
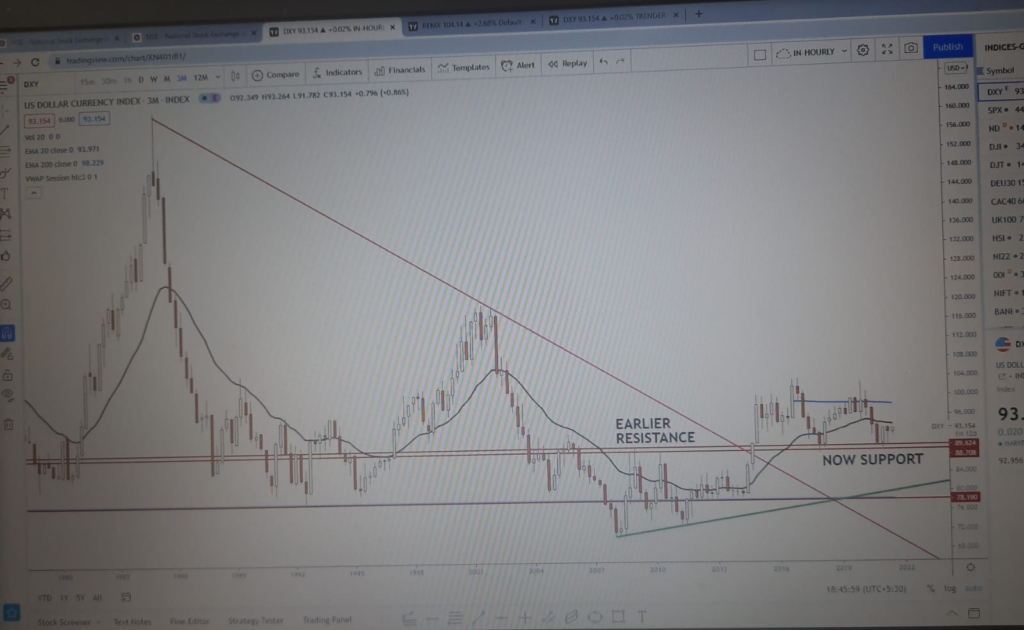
Also we had a talk on US dollar whose direction decides the fate of risk assets
usd quarterly…..the bear camp is neglecting the horizontal support of 89-88 zone. I had noted this even earlier when usd waz at 89 and every one had super bearish targets on the downside….that’s why I had suggested a possibility of usd making a counter rend move to 94-95.
The black MA on the chart is a 20QMA….placed now at 94….any close abv should be viewed as an important development in the near term. Then in all probability a move to 98 will become live. That would be detrimental to risk assets.
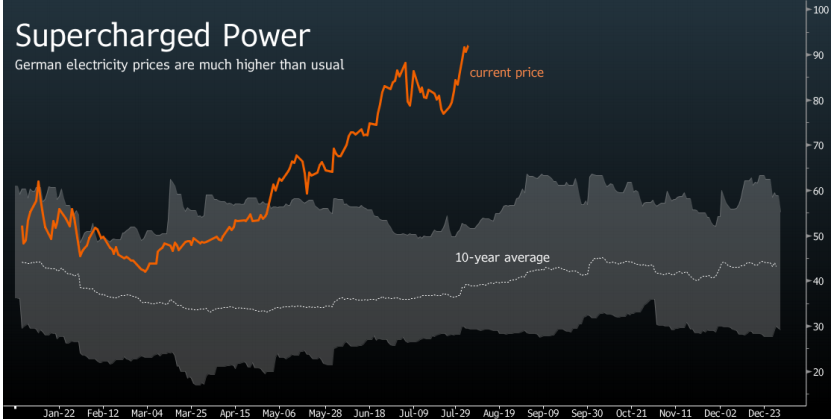
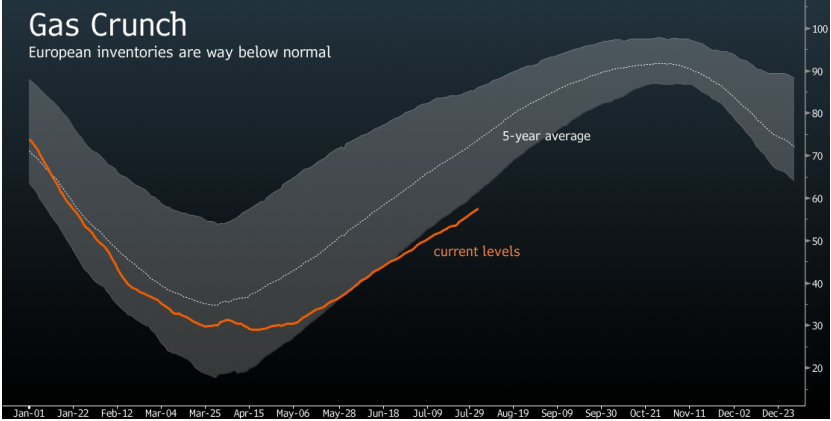
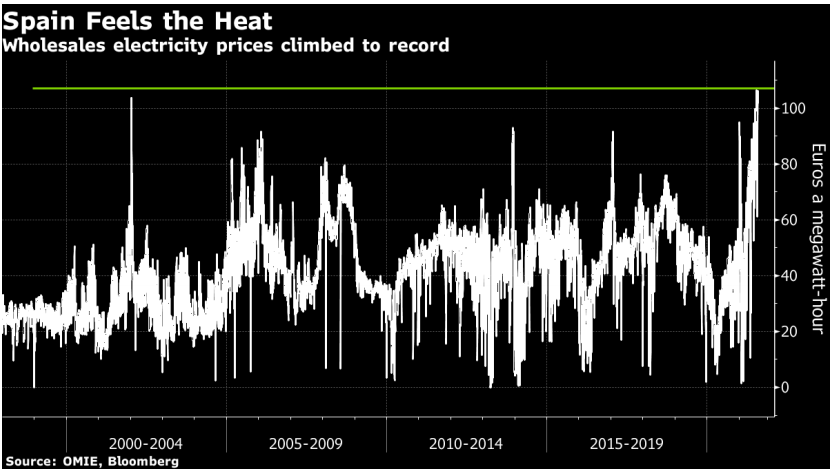
The mindless pursuit of “green and clean energy” without creating an efficient alternative to fossil fuel will in all likelihood lead to an unproductive continent.
Look at some charts below
The above charts tell you the story of energy prices in Europe. Emerging countries like India needs to carefully watch the cost associated with energy transition.
I have shared Neppolian views on markets on this blog in the past. I got one more opportunity to pick his sharp mind to understand the polarization in markets.
Below is the summary of main points
1. Global markets are a fragmented lot. Most Asian indices like Nikkei, Hangseng, Shanghai composite etc topped in Feb 2021 and have been correcting for the last 5 months and have already dropped 10+%.
2. In US too, fragmentation is visible. Even as Nasdaq/SP500 making new highs, Dow Jones Transportation index has been correcting for the past 2 months and RT2000 for the past 4 months.
3. Most European markets have gone sideways.
4. Market internals are crumbling, even as the mainline indices are trading closer to ATH.
5. This looks like the classic reactionary phase, post a big 100% gain period. May continue to rumble like this before a trend resolution is found.
6. In general, reactionary phase or consolidation phase could take the shape of a slow correction or at rare times a sharp collapse. Usually, the developed markets will go through a slow correction and emerging markets a sharper correction. Anywhichways, after a solid run uptrend, a consolidation phase usually resolves in the direction of the earlier uptrend.
7. A repeat of 2020 like quick and deep collapse is ruled out. Markets have a way with not behaving in similar or recent manner eventhoigh most participants may look forward to similar collapse or rallies being themselves anchored to a malady known as recency bias. So we are not likely to get either a deep collapse or a rampant rally for some time.
8. That said, Indian markets are made of stocks rather than indices. In India, there is good participation from across sector. Broad basing is happening and is good for the structure of the markets. Many stocks are making new ATH after 2017-18, especially quality mid and small caps. This is suggestive of leadership through these names for at least next 2-3 years. So large upsides may yet be realizable. So buy on dip strategy will work in such names and sectors. However, unless one is ready to keep or work with a deep stop such names/sectors will practically be not tradable. In India, we have seen a year or year rolling 100% index gains only a few times (91-92), 2003-04 and 2008-2009 and each of these times the indices doubled, either we have seen a sharp collapse or a lengthy time consolidation running into years. Participants may expect a repetition of the past behavior but market may/not oblige.
9. Markets are looking stretched and tired in the near term, but at the same time, setup wise looks structurally long term bullish. Generally, when the markets expand to a new ATH beyond 161.8% measured from the previous bear trend, in future corrections (even the deepest ones) do not fall below the previous top or inverse 132.8% levels…..these levels for Nifty would read as 12500 and 10000 as of now. So, 12500 would require a 20% fall and 10000 would require a 33% fall from current market price. In India 20-30% fall is where most bear market end….barring exception of 2008 and 2020.
10. So in my sense, Long term portfolio can still be built but can be done only if the stops are kept at such levels to persevere at least 20% index correction. Till the markets reach a reasonable support level between 14000-12500, the best strategy would be to hold a very flexible portfolio of momentum + base breakout type stocks. Also, the exit rules will have to be a combination of individual stock based stops or market wide level stops. This would require a mindset to build-exit-rebuild continuously.
11. Also the new clutch of money coming into Indian markets from the retail/non professional group is humongous. We must welcome this money with open arms as these are likely to permanently increase liquidity in the markets…as I certainly feel 90-95% of these Covid19 breed of traders will eventually loose and give a permanent liquidity boost to the professional traders. So deepening of the liquidity in Indian markets is a given.
12. Net net , one must look for opportunities to go long of stocks in meaningful dips. Till these meaningful dips come , run a flexible portfolio.
“For a climber, saying that you are stopping by Everest is like saying that you are stopping by to see God.” ― Roland Smith, Peak
The pace of GDP growth is likely to peak in Q2. That makes sense given the amount fiscal stimulus in the first few months.But it is the pace of deceleration that matters more, and that remains an open question.This is interest because the pace will affect inflation, yields, and the Fed.At the moment, it looks “peakish” from GDP expectations to Fed hike timing to CPI forecasts.
Lots of Lines… But Useful
It is a messy chart. But it communicates the point of growth being peakish for the moment and the deceleration in the future. For the second quarter, the growth expectations may be a touch high given the lagging labor market recovery (more on that topic below). That should spill into the third quarter as individuals return to work.
But the story is really about the fourth quarter and the beginning of 2022. Those estimates remain well above the longer term “potential growth” of the U.S. That is somewhere around 2.25%. This summer will continue to see eye-popping GDP and growth statistics as the economy reopens. But the question is what happens after that.
Lots of Churn
There has been a tremendous amount of commentary and headlines surrounding the JOLTS report with much of the focus on the number of job openings soaring. But what might be more important for understanding the labor market dynamics at work here is how many people are quitting their jobs. There is an incredible amount of churn in the U.S. labor force. That 3.1% quit rate represents just under 4 million people. One side-effect of rising wages is to incentivize job switching. It may turn out that the wage gains were largely captured by quitters and switchers – not necessarily those coming back to the workforce. The churn helps explain the lack of an uptick in labor force participation while hires have moved above pre-covid levels.
How does this tie into the narrative around GDP? With this type of dynamism and job openings, it increases the likelihood of exceedingly strong growth this summer.The question of the pace of deceleration becomes a fourth quarter and 2022 question.
CPI Should Normalize
Then there is inflation. The above chart is similar to the GDP chart only the retreat toward normality is quicker. Again, all of this makes sense. Inflation pressures are expected to be transitory. But the question is – again – the rapidity of the retreat. After all, the “base effects” that are helping make inflation look horrid today will be completely the opposite in 2022. Simply, the deceleration of inflation could be one of the more surprising features of late 2021 and 2022.
All in 2023
Why is any of the above important? All of the above complicates the Fed’s decision-making. Not to mention, the dynamics of the deceleration will also affect yields – particularly longer duration. For the moment, markets believe 2023 is the year of the hike. Expectations for 2021 and 2022 have receded. Maybe it was all the “talking about talking about taper” talk that moved expectations for a hike higher. Oddly, taper talk (and eventual tapering) would have the effect of pushing down growth and inflation expectations. And therefore yields.
And that is the odd part of all of the above. GDP is going to decelerate with inflation (probably) following suit to even greater extent. All of this while the Fed is talking about talking about tapering their asset purchases. Maybe the decline in the 10-year yield is more signal than noise. With seemingly everything looking peakish, it is worth contemplating what the otherside might look like.As always, please do not hesitate to reach out with comments, questions, or suggestions (all replies to this email come directly to me).
Please feel forward to anyone that might be interested. Here Is the sign-up page, and here is the archive.Samuel Rines Avalon Advisors – Chief Economist