I am talking about my favourite asset i.e Silver .
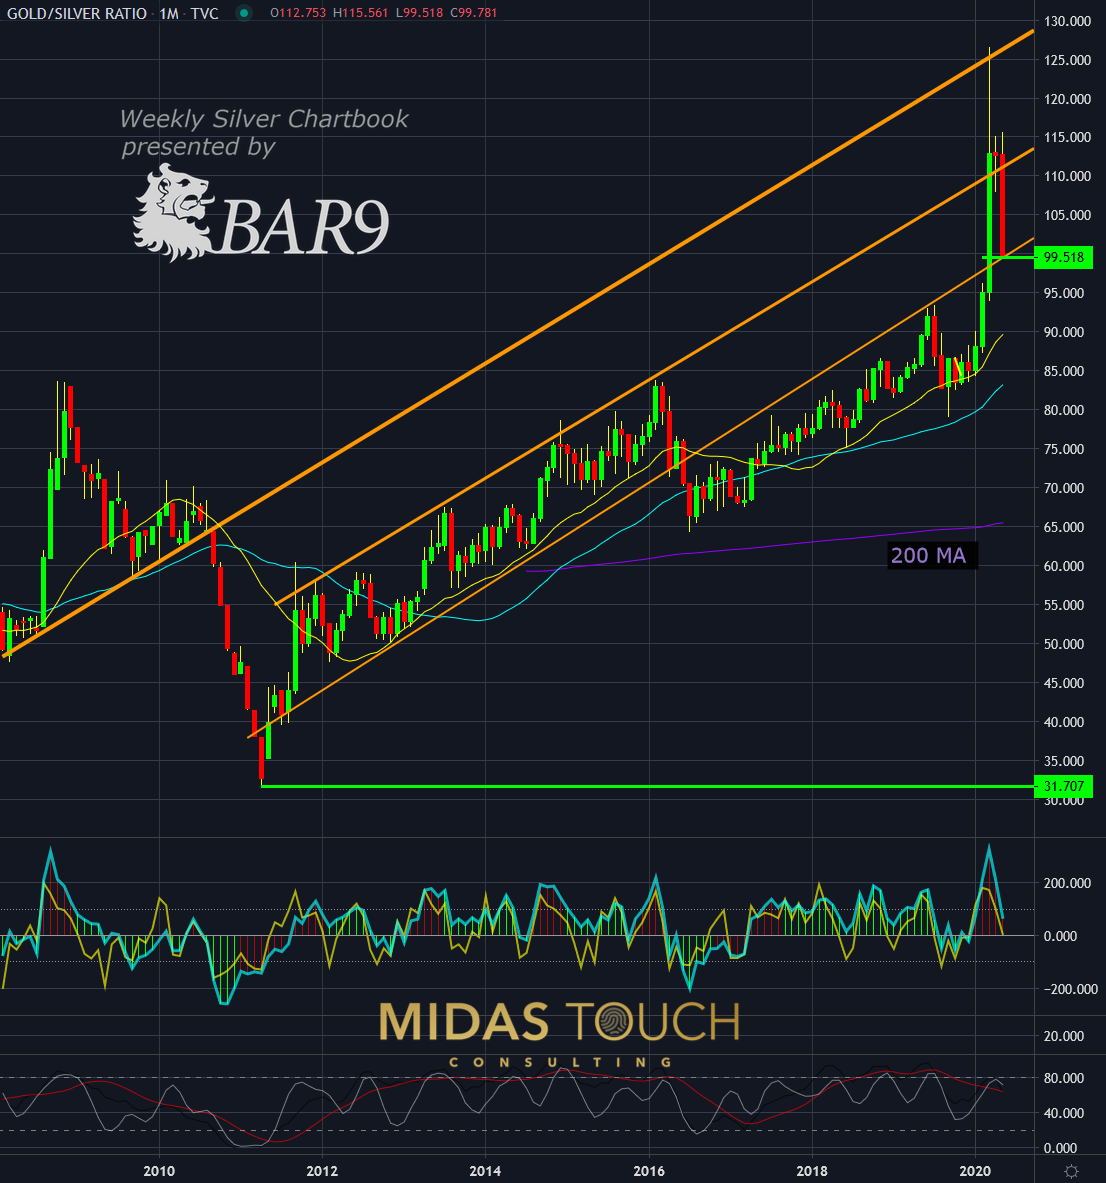
Gold/Silver ratio hit an all time high ratio of 1:120 in march this year and since then silver is silently outperforming GOLD with this ratio breaking down below 1:100 ( silver outperforming GOLD).

according to Midas Touch consulting
At this moment of time it takes about 97 units of Silver to purchase one unit of Gold. The monthly Gold/Silver-Ratio chart above illustrates that nine years ago it took only 31 units to accomplish the same purchase. Relationships like these rarely stay long in extreme measurements like the two mentioned. Consequently, it is quite reasonable to assume that we will at some point find ourselves near the 200 moving average, a value between those two extremes more likely in the future. Once Silver which is always late and lags, catches up with Gold’s extension, this medium Gold/Silver-Ratio zone will be reached. This means there is a force in place driving Silver prices still higher.
Julian Bridgen of M12 Partners write
After hitting our initial target around $100, the market chopped sideways for a week. But now, the Gold/Silver ratio appears to be starting the next leg. My target is the mid-80’s … a lower gold/silver ratio is historically inflationary!

The best way to capture Silver upside is through Silver Miners.