by Bryce coward via Knowledge leaders capital blog
The returns of the 2009-2020 bull market were nothing short of extraordinary. From the 2009 low in the S&P 500 to the 2020 high, stocks gained a massive 488%, or nearly 18% on an annualized basis. This compares to an average nominal price return for US stocks of about 5.5% annualized going all the way back to 1896, or 6.7% in the post-war period. So, the recent bull market produced average annual returns more than 3x that of normal. Even if we measure the S&P 500’s full cycle performance from the low in 2009 through the low in 2020, that still gives us an annualized return of 14.5%, or nearly three times the annual average return through history.
Going forward, can this type of high return environment be replicated? To answer that question it helps to understand the sources of equity appreciation from the previous cycle and ask whether those things are likely to be repeated during this cycle.
Let’s start with decomposing earnings per share into its piece parts.
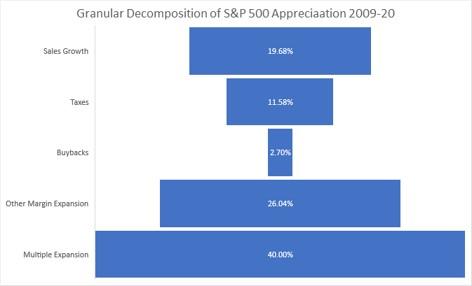
- From the 2009 low in stocks through the recent high earnings per share rose about 265% in total (12.5% annualized, from about $43/share to about $157/share).
- Contributing to this rise was rising sales, which increased about 33% in total, or 2.6% annualized.
- The tax cuts enacted in 2017 also added significantly to aggregate earnings, boosting EPS by 19.3%.
- Share buybacks were on a tear over the last five years, adding 1.3% to EPS in each of those years through the reduction in the denominator.
- But share issuance was rampant at the beginning of the cycle. In total, share buybacks added 4.5% to aggregate EPS over the last bull market.
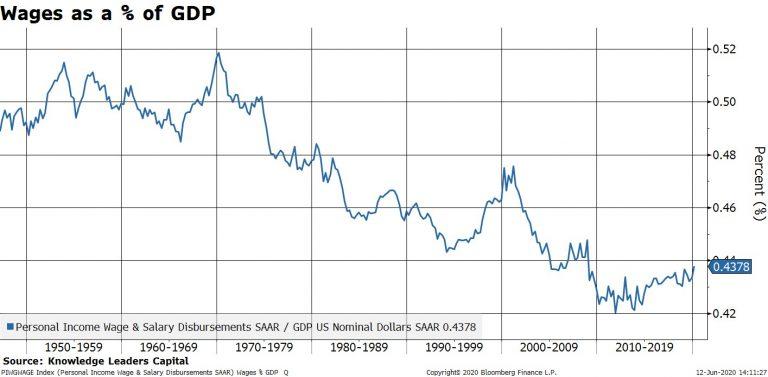
- The final leg in EPS growth is what we will call ‘other margin expansion’. The aggregate profit margin for the S&P 500 expanded from 7.7% in 2009 to 11.8% in 2020. Some of this margin expansion was due to tax cuts, but most of it was due to lower interest rates (10-year rates fell from about 3.3% to 0.3% more recently), and wages falling relative to aggregate output (wages as a percent of GDP fell from 45%, to an all-time low of 42% in 2011, and have recently risen back to 43.5%).


In the next chart we put all this together into a breakdown the S&P 500’s total appreciation into the granular piece parts.
With that behind us, we need to analyze each component of share price appreciation from the last cycle to in order to judge whether it is likely to be repeated this next cycle.
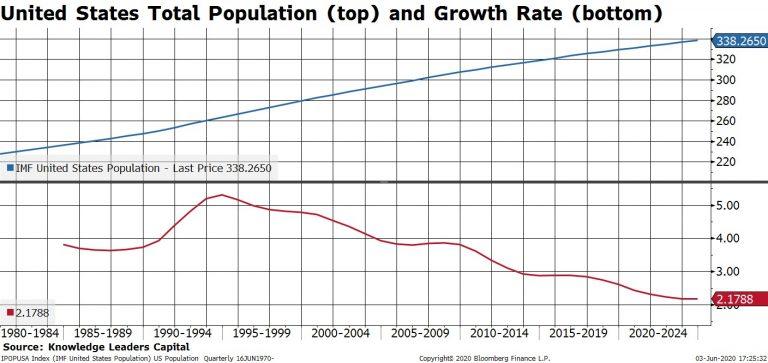
Sales growth. Are aggregate sales likely to rise by 2.6% annualized going forward? Sales growth closely tracks population growth. From 2009-2019 the US population grew by 3% per year on average. From now until 2024, the IMF estimates that the US population will only grow 2.25% per year on average. A 0.75% lower rate of population growth in the years to come vs the previous decade would seem to imply a lower aggregate level of sales growth for the S&P 500 this cycle compared to last cycle.
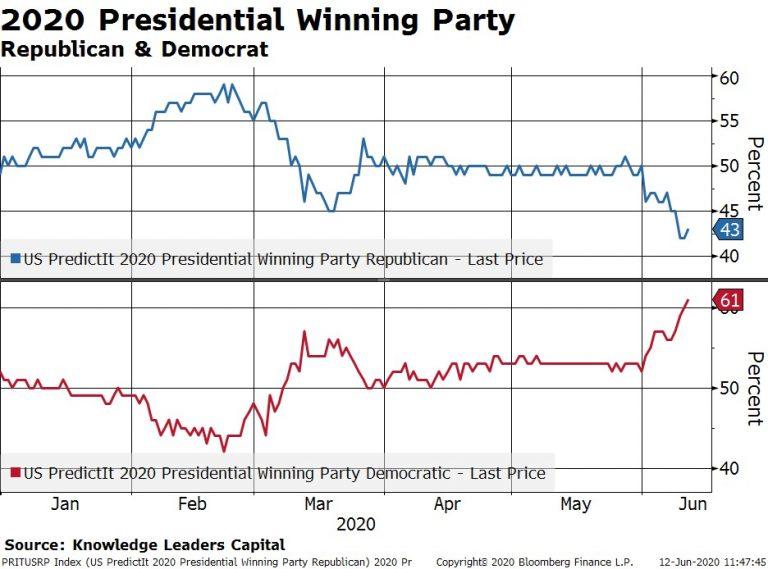
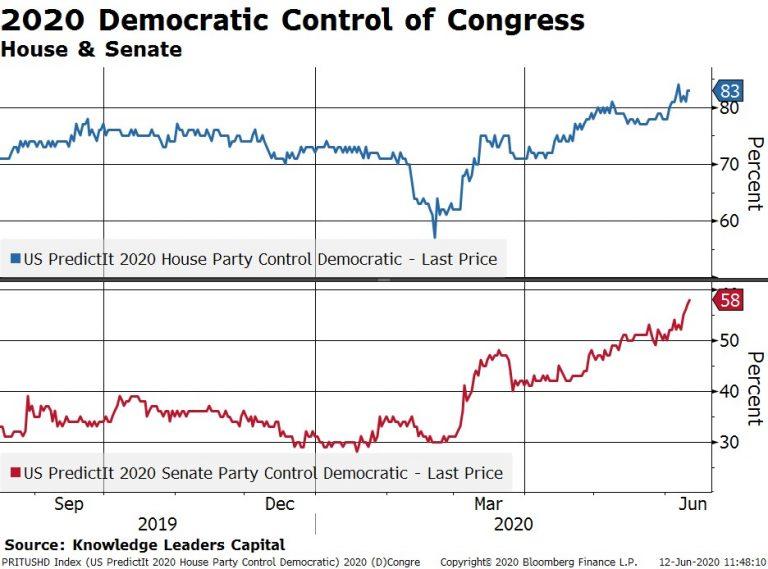
Tax cuts. It would stretch the imagination to assume another round of massive corporate tax cuts in the years ahead, even if the Republican party were to sweep in November. Alternatively, if the Democrats sweep, the corporate tax rate is likely to rise to 28% (it’s a campaign promise by Joe Biden). Currently, Biden is the odds on favorite to take the White House and the Democrats are the favorites to retake the Senate. Therefore, tax cuts certainly cannot be counted on for EPS growth this time around and may in fact reduce aggregate EPS.
Share buybacks. In the age of bailouts the term “share buyback” has taken on a negative connotation. Even if there is not legislation regulating buybacks in the coming years, we are hard pressed to assume a higher level of buybacks during this cycle compared to last. For this reason, the buyback factor may be neutral this cycle compared to last.
Other margin expansion. With the 2-year Treasury rate at 19bps, the 10-year at 70bps, and BAA spreads only a bit above average at 292bps, we are hard pressed to see another significant interest rate reduction being a catalyst for margin expansion this cycle. At the same time, wages as a share of GDP are still only slightly above the post-war low. A Blue wave in November would certainly usher in policies to help swing the pendulum back in favor of labor at the expense of capital. Therefore, margin expansion due to lower wages as a percent of output would seem an unlikely source of margin expansion.
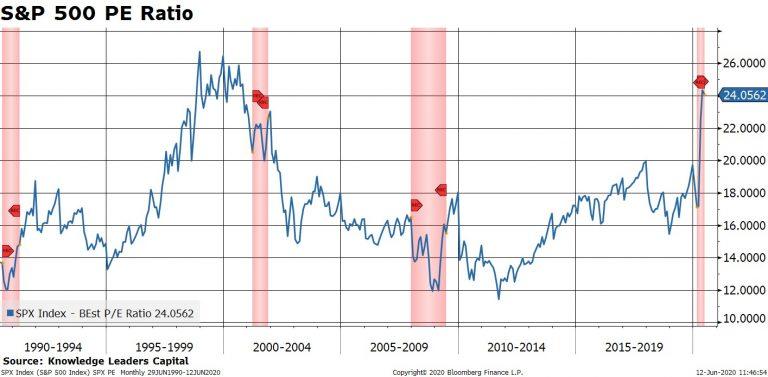
Finally, multiple expansion. At the beginning of the last market cycle the S&P 500 was sporting a forward PE of 10x. Back in March, the PE only reached a nadir of 17x and is already back to 25x. Could the forward multiple double from the March low and reach 34x? Anything is possible (see negative oil prices). But even with Fed asset purchases (which empirically are accretive to multiples), we would be hard pressed to count on multiples topping those from the 1999-2000 period by a wide margin.
In sum, the last market cycle was a unique one in terms of the aggregate stock price appreciation as well as its sources. Some of those sources were clearly one offs (tax cuts), while others may have simply reached their logical limits (interest rates, wages as a share of output). In the end, we find lots of reasons to expect lower EPS growth and less multiple expansion during this market cycle than last. At the very least, this means we have to re-calibrate our return assumptions moving forward and not expect a repeat of the 2009-2020 cycle. At worst, it could mean that achieving even average equity returns over the coming years could be a challenge.