While going through “The seven things of Ethical Collapse” by Jennings, I realised how relevant it in today’s time, and what is common in companies which experience financial frauds. When payment companies and banks “nudged” customers towards cashless economy they never asked their choice because it was too profitable an opportunity for them.
Author: Ritesh Jain
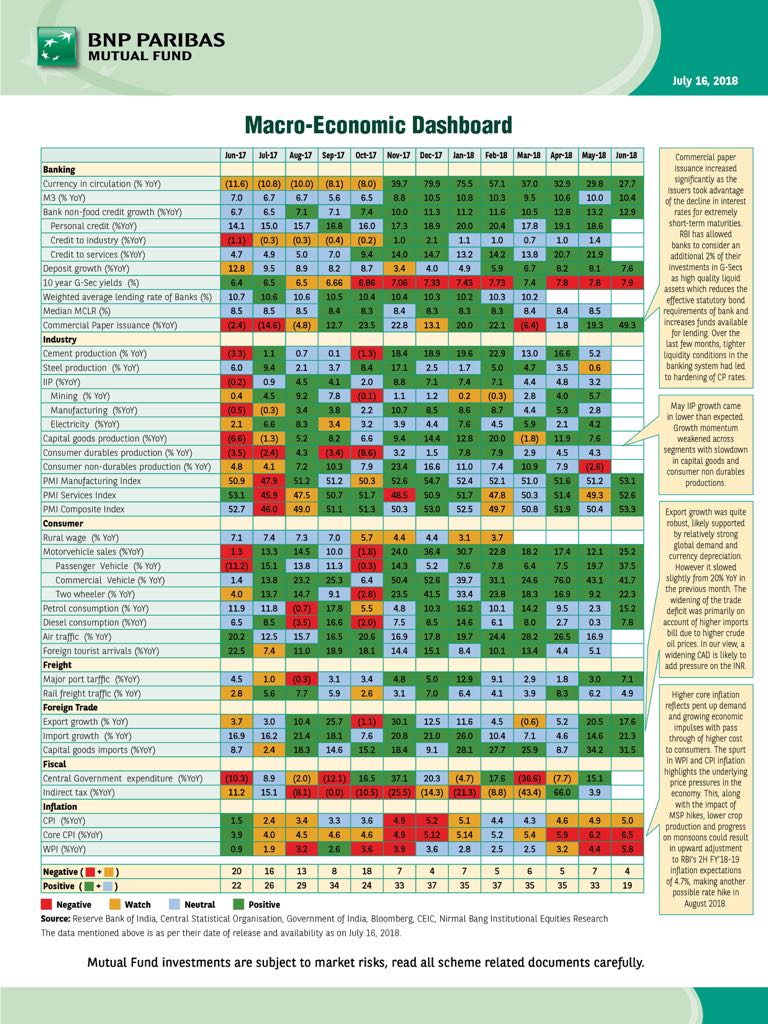
Macro Economic Dashboard
Fortnightly summary of India’s Economic Data – Some observations
1.Huge spike in commercial paper issuances led by some leeway from RBI to banks and strong demand from not only NBFC/HFC but also from manufacturing sector on account of inventory rebuilding.
2.Surprisingly strong Petrol and Diesel consumption in face of rising prices.when prices rise the consumption should reduce but we are seeing strong demand and this is bad for trade deficit.
3.Purchasing Managers Index (Composite PMI) at a year high. This indicator shows robust economic momentum.
4. Biggest area of concern continues to be Trade deficit.Tepid growth in exports but strong growth in wasteful electronic imports.
Gold, Mining Stocks on the Verge of a Major Bull Market
A timely article on Precious metals especially when prices are at 52 weeks low and have been in a bear market since the August 2011 peak at $1920. I can be accused of confirmation bias and acutely aware that till the time US equity markets continues to do well Gold will struggle,and thats why we have to be patient .
Charts That Matter – Volume 8
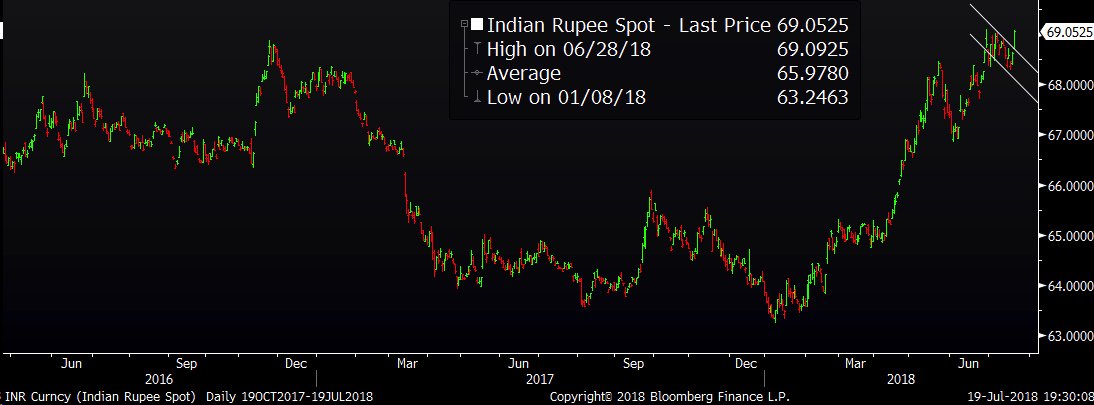
1.Indian Rupee Closes at its weakest level on record of 69.05/$. Interestingly it has also broken out on chars. I am medium term (1-3 years) bearish on Rupee simply because Capital flow favors Dollar over INR.
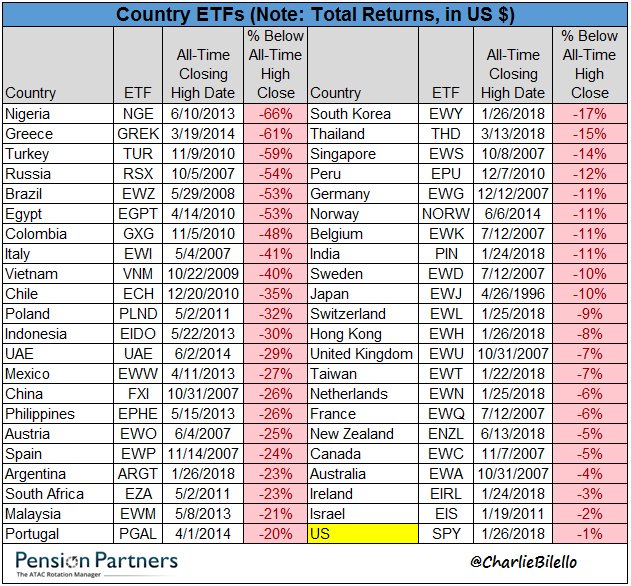
2.Country ETFs, % Below All-Time High…India: -11%,China: -26%,US: -1%. India and US both put a low in last week of January but US has bounced back whereas India ETF is still down. Japan put a high in 1996 a level which is yet to surpassed …. what a wealth destruction
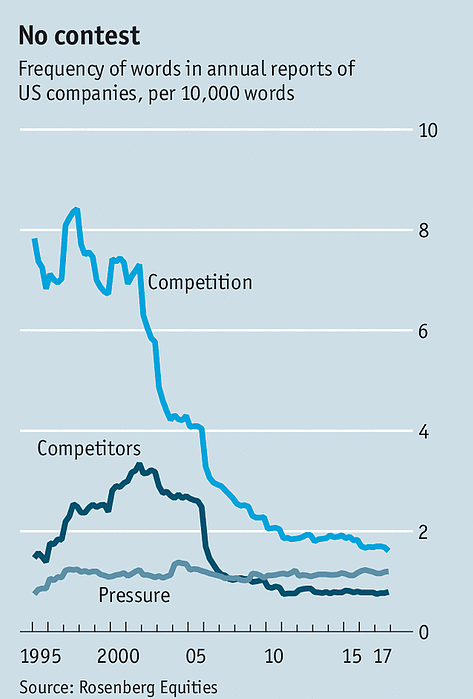
3.Decline of Competition
Firms do not even talk about competition anymore. This chart from the Economist shows that in annual reports, companies have less and less need to discuss competition from other firms which is strange
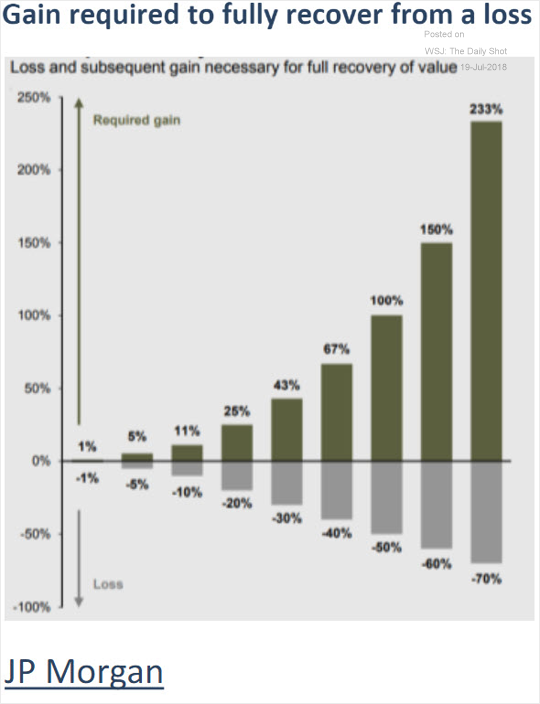
4.Percent gains required to offset losses. This is why losses hurt lot more than Profits
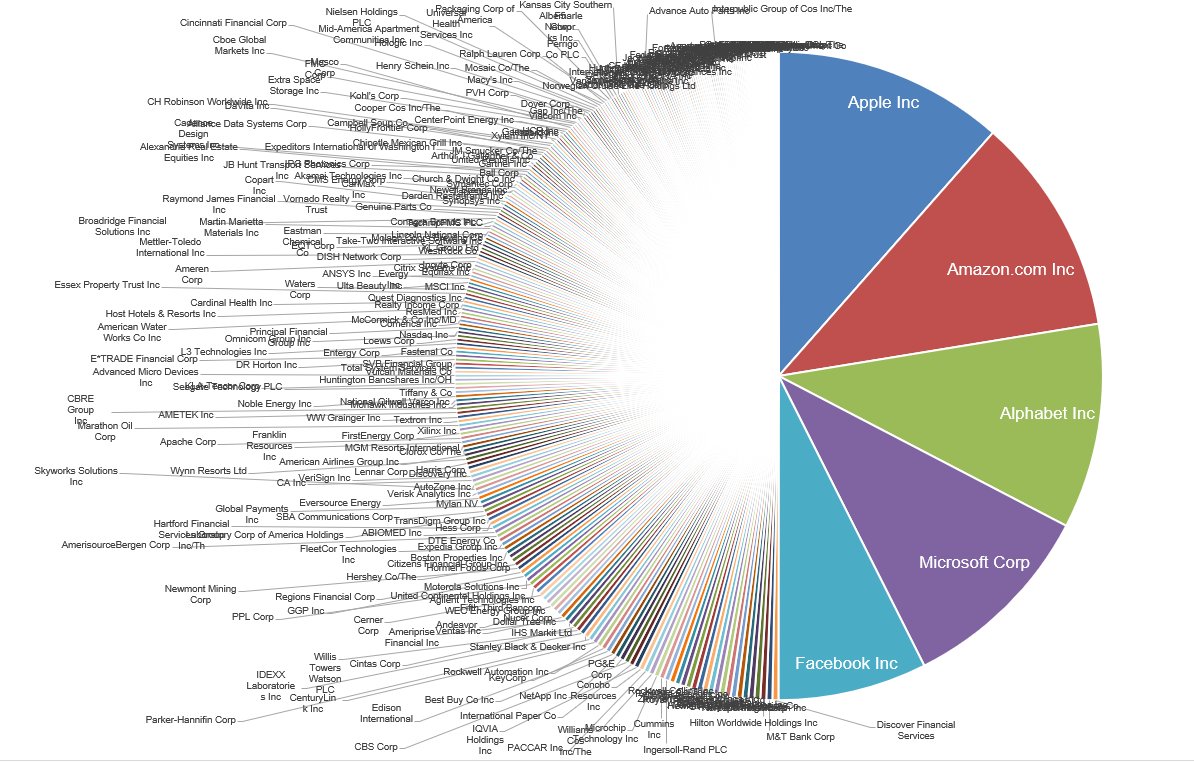
5.Almost Monopolies
The market cap of the top 5 S&P 500 companies: $4,095,058,706,432
The market cap of the bottom 282 S&P 500 companies: $4,092,769,755,136
Charts That Matter- Vol 7
1.A recent survey by Indiaspend shows,a majority of Indians prefer political leaders from their own caste, tribe or religion, indicating how identity politics plays a significant role in state and general elections. This was especially so among non-literates across caste and religious groups. There is a general election coming up in 2019 and this does not bode well for India.

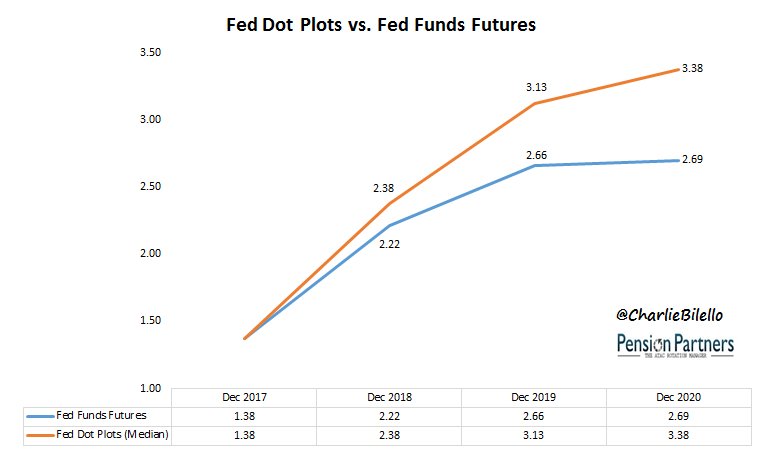
2.The Fed is projecting 6 more 25 bps rate hikes by the end of 2020.The market is currently pricing in 3 more hikes.If FED continues to hike rates and takes the short term rates to around 4% then US will simply continue to attract more money from rest of the world.
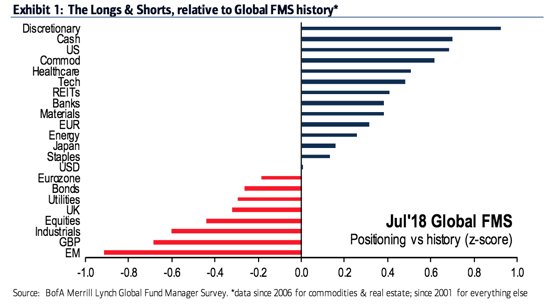
3. BofAML’s main takeaways from July FMS: Sentiment/expectations bearish, lowest equity allocation since Nov 16′, cash levels elevated & near triggering “extreme bearish” contrarian buy signal. Markets don’t make a long term top with this kind of cash levels.
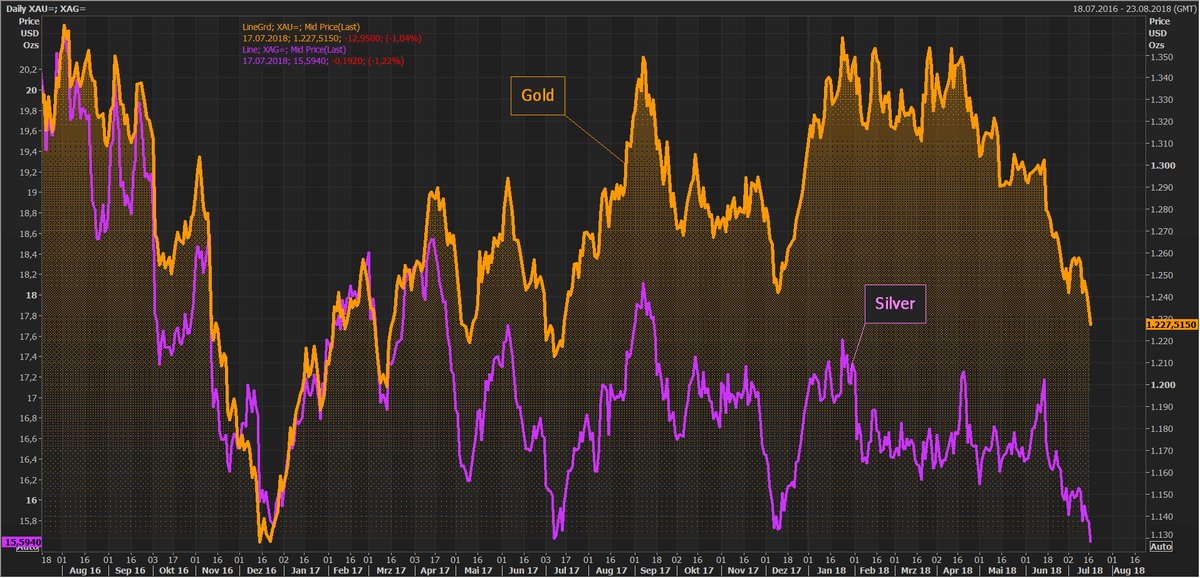
4. Ouch! Gold and Silver fall after Fed’s Jerome Powell’s upbeat remarks about US economy and projection of gradual hikes in key interest rates boosted the dollar. Gold at 1y low, Silver at 2y low.
And for some Mind boggling statistics
If we exclude the market cap of top 10 stocks, the remaining over 4,000 stocks listed on BSE have lost a whopping Rs 16.70 lakh crores since January 2018! More than 300 stocks have fallen anywhere from 50% to as high as 90% from their one-year high prices. If, as experts say, the stock market is a leading indicator of the economy, then the economy is not in great shape and may get worse.
Innovators vs just average – All winnings go to the winner; it won’t stop
Victor writes
1.Most companies manage their own decline. It is fine until disruption hits.
2.Innovators are different; they facilitate disruption & work with secular trends
3.Irrespective of industry,the gap between winners and the average is widening.
Steve Jobs argued in one memorable quote that “any company run by sales department is basically managing its own decline. In other words, it has reached the stage in its evolution where the objective is essentially to re-package what are essentially undifferentiated and commoditized products to create extra ‘stickiness’ or an illusion of customer value. In another quote he stated that ‘it is hard to design products by focus groups; a lot of times, people don’t know what they want until you show it to them’. This is not dissimilar to Henry Ford quote that ‘if I had asked people what they wanted, they would have said faster horses’. He did not give them faster horses; instead he delivered affordable cars that people did not know they needed.
These two quotes from pioneering innovators (not inventors), highlight the difference between excellence and managing businesses. It is what differentiates Innovators from average run-of-the-mill corporates trying to survive by yielding responsibility to sales departments and marketers to ‘move the needle’. The next step for these ‘average’ corporates is usually inviting management consultants to advice on cost controls and either M&A or divestments as means of prolonging the agony. What makes innovators special is not just that they are good but that the average is just average.
As the recent OECD study highlighted the productivity of top 5% of firms in any industry is now growing 4-5x faster than productivity of non-frontier firms. It is the process that has been evolving for at least 20 years but there is a noticeable acceleration. It is also not surprising that profits are becoming highly concentrated in select few niches and top profit generators. Technological disruption has already disintermediated a plethora of industries (from news, entertainment to retail) and is moving rapidly into new areas (education, financial services and manufacturing).
Although most investors associate disruptors with tech names (and being the conduits of disruption implies that tech is over represented), the most innovative firms do not need to be tech. In other words, these are companies that flow with the strong secular currents rather than just managing negative impacts.
The time for these thematics/disruptors is likely to persist for decades and as Victor concludes “we believe that Thematic-based investment is here to stay for years to come”.
( you can now subscribe to worldoutofwhack.com by just enetering your email id in the blog)
Charts That Matter- Vol 6
1. The disconnect between your Mutual Fund NAV and Sensex. Wealth managers are using this illustration to shift the blame and explain the difference between rising sensex and not at all rising NAV’s.
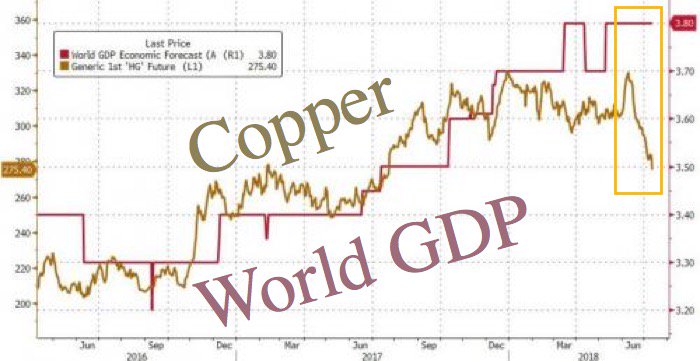
2. Copper versus World GDP. World economy has always followed copper and this time will be no different.
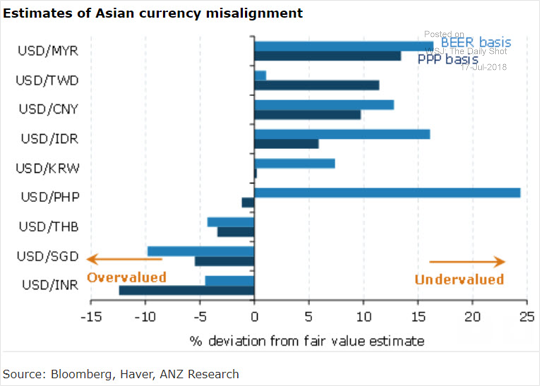
3.Which Asian currencies are undervalued (BEER = behavioral equilibrium exchange rate, PPP = purchasing power parity)?. Indian Rupee is most overvalued as per this matrix among its Asian Peers
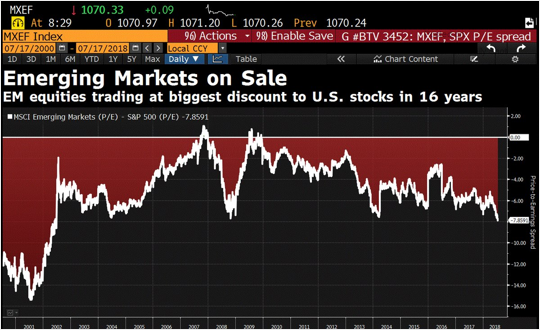
4.EM shares are trading at the highest discount to US stocks in 16 years. Normally it should lead to mean reversion
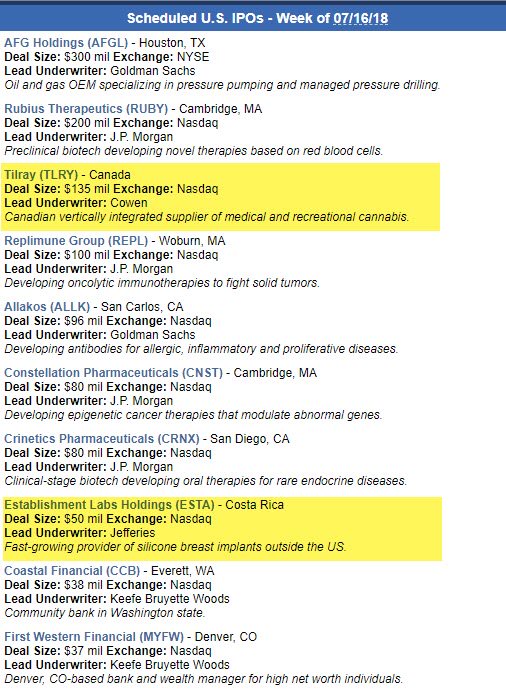
5. The IPO’s getting listed this week make up weed and BOOB…….Hmm Interesting
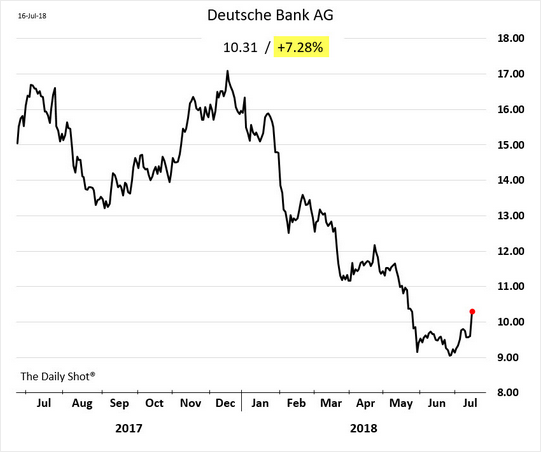
6.Deutsche bank in my view is canary in global coal mine. One of the the most opaque and leveraged balancesheet in world . Deutsche CDS and bonds have already seen widening Spread . Any further significant fall in its share price could cause panic in asset markets
Charts That Matter- Volume 5
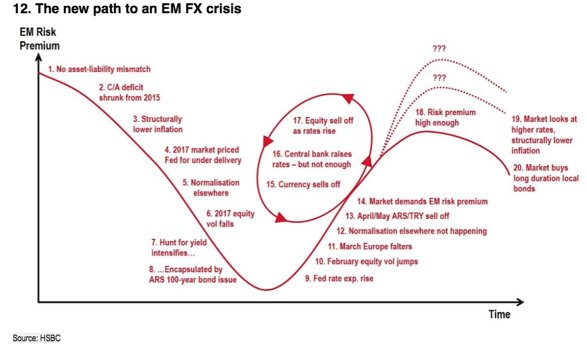
1.The new pathway to an EMerging Market FX crisis via HSBC.
In my view India is still at stage number 14.Long way to go.
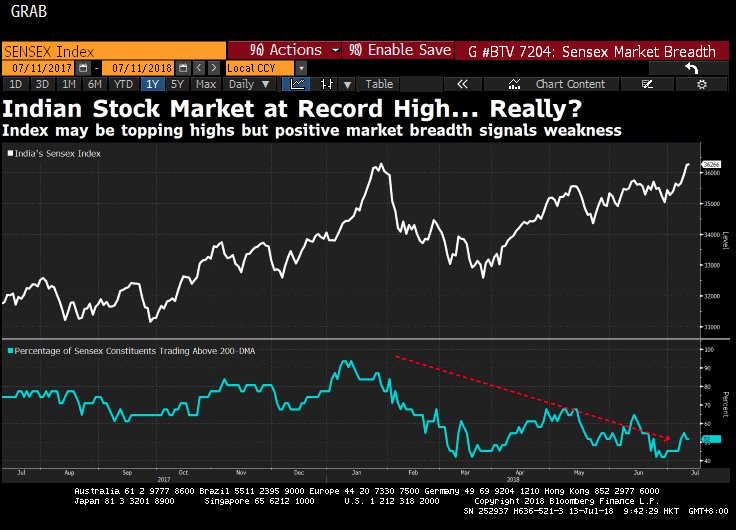
2. If anyone tells you that the Indian stock market is in terrific shape just because it’s at an all-time high, show them this chart and see what they say.Breadth is just too narrow
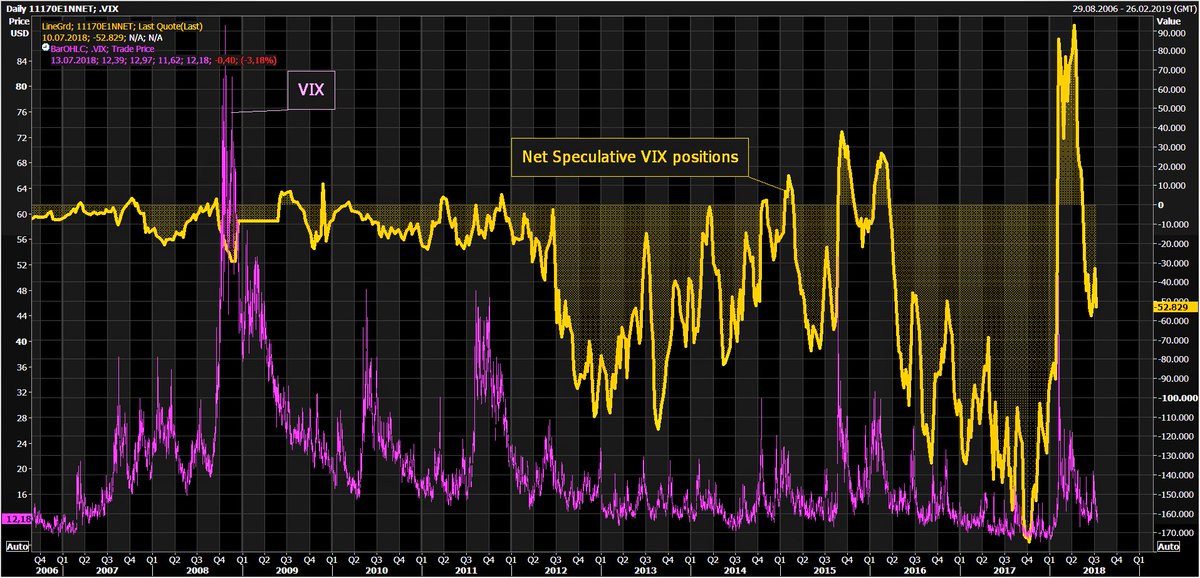
3.Compacency has started creeping and as usual Investors have very short memories: The Short-VIX trade is back only 5mths after Feb Short-VIX massacre.
Boys will always be boys.
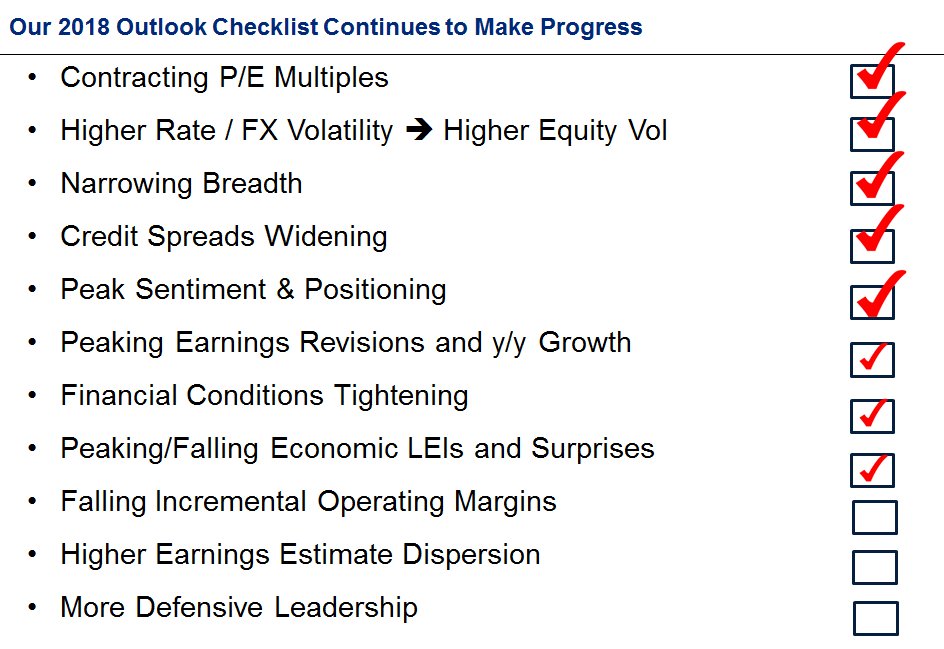
4.Morgan stanley Risk outlook checklist. We still need to check few boxes before we go into Red Alert
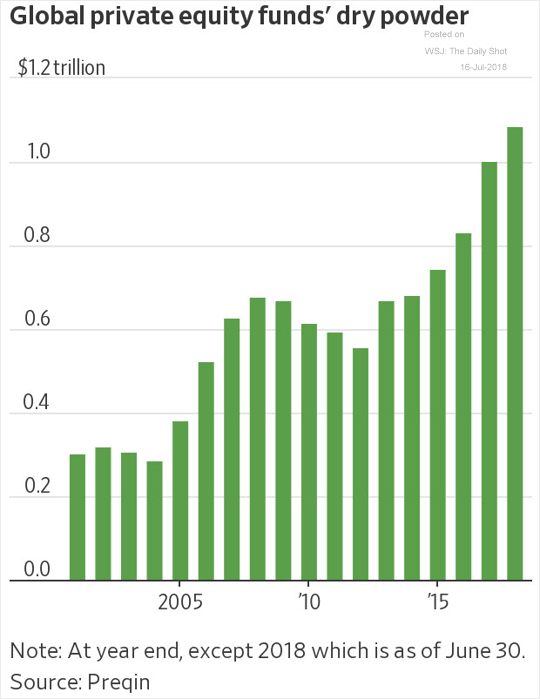
5. Private equity firms are sitting on a record amount of “dry powder.” This trend doesn’t bode well for PE performance (too much capital chasing fewer deals).This is also the reason that we might not have seen the final high in equity markets
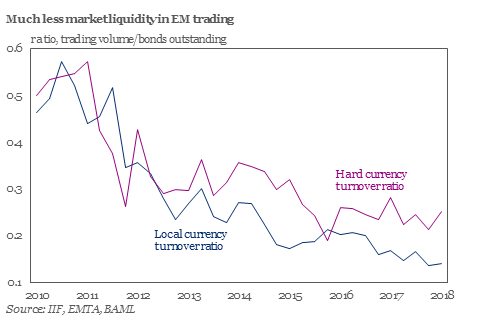
6. Lower levels of liquidity in Emerging Markets are likely to mean more market volatility going forwards. This also means that large size Funds should underperform Smaller size funds. Invest accordingly
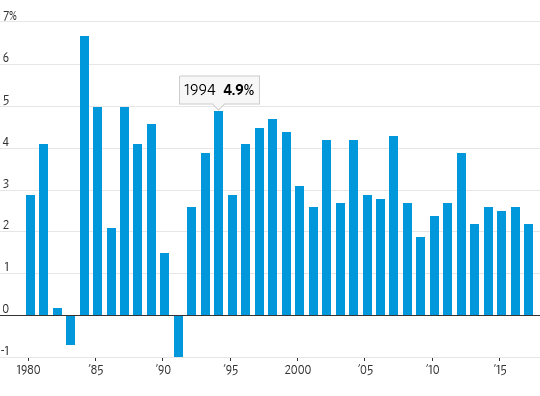
7. An unparralaled feat in post world war era
Australia is experiencing an amazing economic run—a 27-year expansion that survived a regional economic crisis in the 1990s, a global economic crisis in the 2000s, and a boom-boost cycle in its core commodity sector in the 2010s.
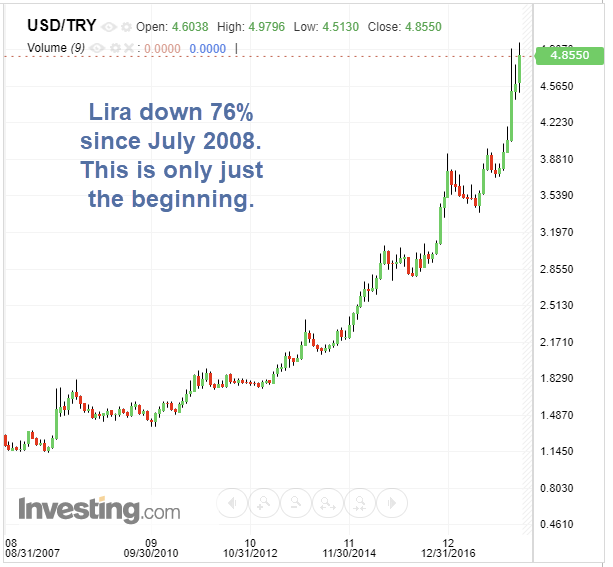
8. The next country……
Turkey isn’t close to hyperinflation yet. But the path it’s on is a guaranteed way to get there.
Turkey on Venezuela’s Path.Erdogan jailed political opponents.Parliament effectively made Erdogan prime minister for life.Erdogan took over the press.Erdogan took over the courts.Erdogan took over finance.Erdogan about to take over the central bank names his son in law as central bank governor
Hyperinflation Nearly Inevitable
Venezuela did not hop straight into hyperinflation and Turkey likely won’t either.
However, if Turkey remains on the same path, which seems highly likely, hyperinflation is the inevitable outcome.
Interesting articles
The market breadth is becoming narrow and this is not good sign of health of economy
Charts that Matter- Volume 4
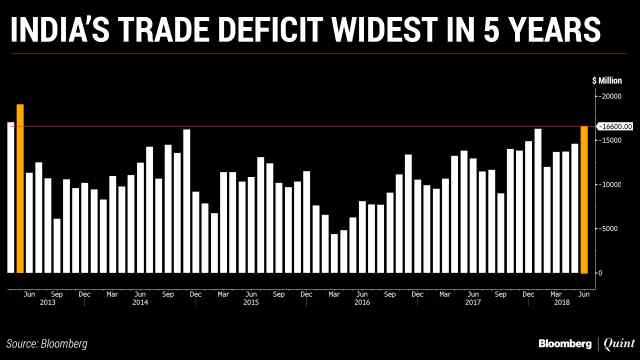
1. India Trade deficit and imports at 5 year high.Oil is obviously the major culprit but useless electronic imports are also responsible for this surge.Trade deficit for Q1 FY 19 close to $ 45B indicating a CAD of 2.5% of GDP.So unless Oilprices come down we will see a general weakening of rupee
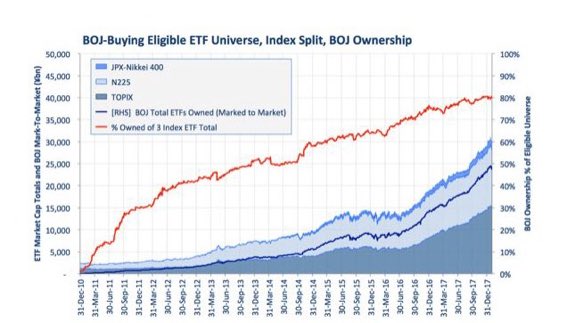
2. This charts shows the Bank of Japan now owns 80% of the eligible equityindex ETFs!All big monetary experiments start with Japan and this one is for history books. BOJ already owns so much of domestic bonds that there are days when not a single trade takes place in JGB’s.
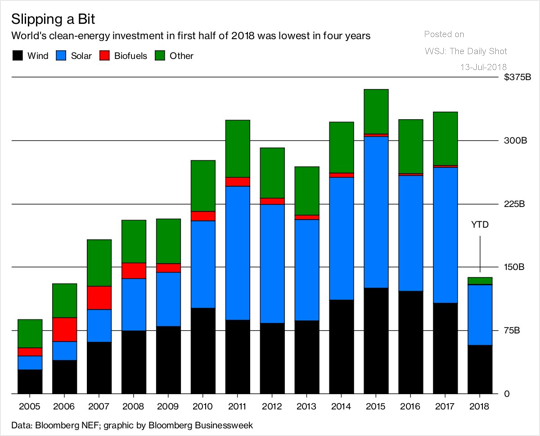
3. Global Clean energy investment are lowest in last four years.With surge in oil prices, the investment in clean energy should have gone up this year.I believe most of these investments were never profitable in first place and relied upon govt subsidies to make a business case.
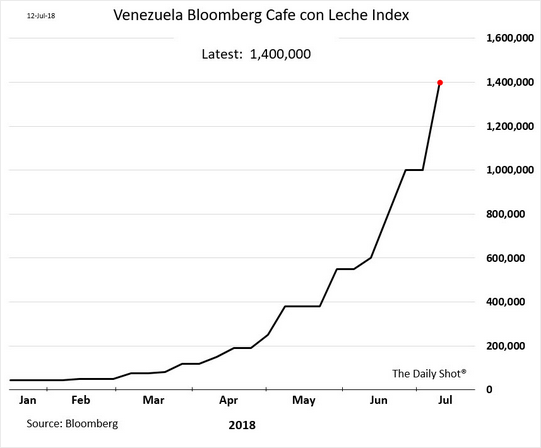
4. This is different kind of monetary madness ,coupled with socialism and corruption gone horribly wrong leading to modern day hyperinflation. There is joke in Venezuela about Maduro diet as 75% of venezuelans population has lost on average 9kg of weight in last 1 year as prices of things rise much faster than the incomes.Below is price of one cup of coffee in Bolivar
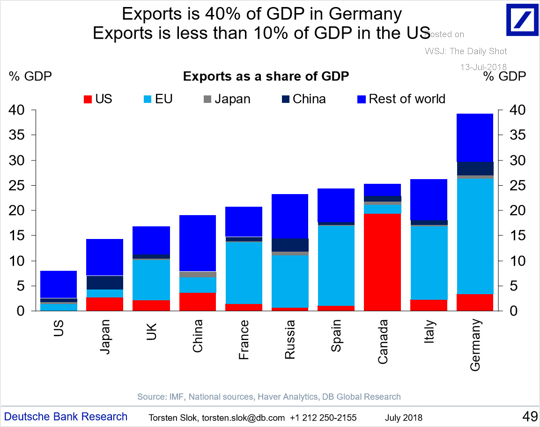
5.The trade fight is not between China and US. Biggest looser is actually Germany which mostly depends on exports for its growth. Germany is having added headwind of aging population .
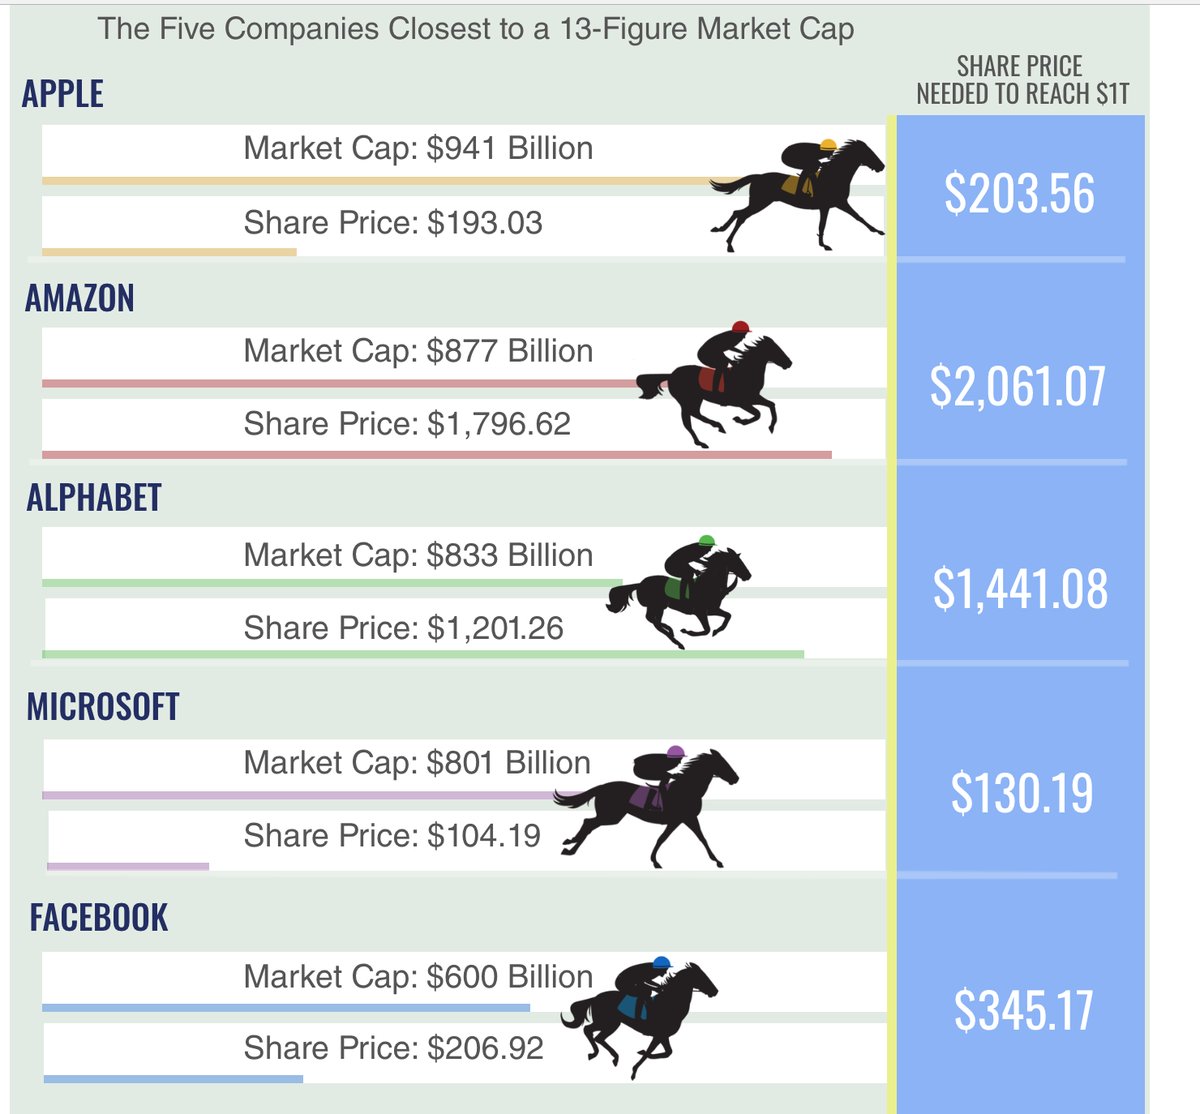
6. The race to a trillion dollar marketcap is on. Here is what share price Amazon or Apple would need to hit to reach the milestone. Would anyone bet on the underdogs? Google, Microsoft or Facebook.
Markets and economies always make a long term high towards events like big bang IPO , Tallest Building , hosting of olympics etc.
whats bigger than trillion dollar market cap?
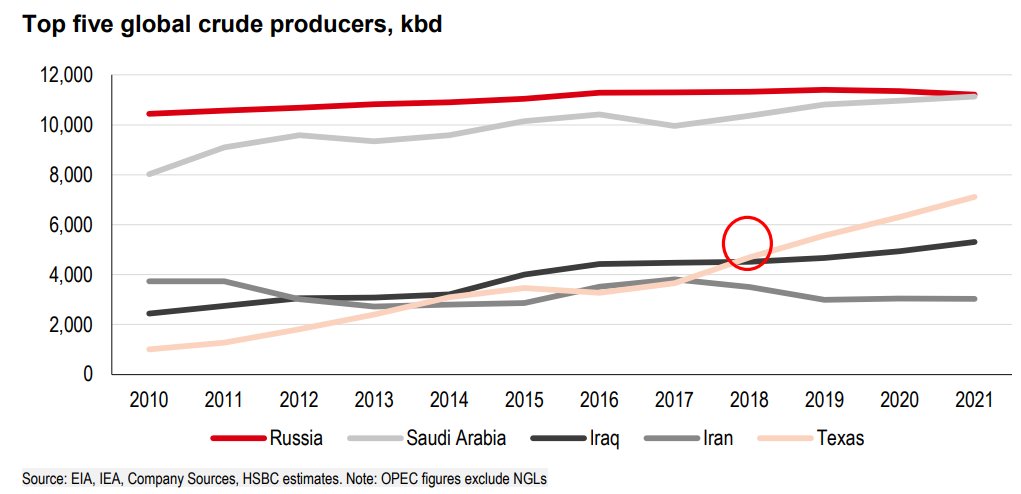
7. Times.. they are changing .Texas will overtake Iran and Iraq as the world’s third biggest “global” crude oil producer this year, says HSBC .American oil is different and better than rest . It is the lightest, purest oil produced in the world, as well as the most valuable and easiest to refine.