
Making sense out of Chaos
I have been reading Samuel Rines for some time and must admit that he brings a fresh thinking to the economic thinking. In the following article he explains why ” Markets are not Lying” and this time is really different
The data does not seem to make sense. Manufacturing is back to growth, services are back to growth, and unemployment in the mid-teens. But it makes sense. While production is surging, employment is lagging. That is the great disconnect. This creates a few oddities. Most importantly, it creates a “cyclical upturn” without the typical “yield consequences”. It also creates difficult to interpret data. “Dr. Copper” – known to be one of the better predictors of economic upturns – is pointed to a further pick-up in activity. To that point, economic surprises have surged to dataset highs. With the Fed only caring about employment – and the labor market seriously lagging the cyclical upturn, “this time is different” with a return to growth placing little pressure on longer-term U.S. yields. In the end, the relationship between the data and yields (and broader markets) seems to be thoroughly nonsensical but makes perfect sense.  “Maybe the mind’s best trick of all was to lead its owner to a feeling of certainty about inherently uncertain things. Over” “Maybe the mind’s best trick of all was to lead its owner to a feeling of certainty about inherently uncertain things. Over”― Michael Lewis, The Undoing Project: A Friendship That Changed Our Minds “The data makes no sense.” “There is a disconnect between markets and the data.” Those seem to dominate the headlines currently, and they seem to be taken at face value. Nothing should ever be taken at face value. In fact, the data and yields make sense together when the data is fully parsed. Much of the frequently cited disconnect is the labor market. On the surface – that is true. Continuing claims are all over the map. While Florida appears to be in a downtrend, California has popped following the surge in COVID cases. Meanwhile, Texas never really brought many back to work. That is the choppiness of the labor market. And the labor market is the only thing the Fed is current interested in getting back to “normal”. This is where the disconnect lies.   Other pieces of data are furthering the head scratching “disconnect”. Complicating the interpretation of volatility in continuing claims (which will continue), the widely ISM Manufacturing Index surged to a level not seen in a couple years and the forward-looking new orders sub-index began to garner steam as well. With any reading above 50 indicating expansion, the index is indicating growth has returned, and new orders are signalling the expansion is here to stay for a while. Other pieces of data are furthering the head scratching “disconnect”. Complicating the interpretation of volatility in continuing claims (which will continue), the widely ISM Manufacturing Index surged to a level not seen in a couple years and the forward-looking new orders sub-index began to garner steam as well. With any reading above 50 indicating expansion, the index is indicating growth has returned, and new orders are signalling the expansion is here to stay for a while. But – even with production and orders pointing toward growth – employment remains well below 50. In other words, employment is contracting as production accelerates.  And it is not simply manufacturing either. The ISM Non-manufacturing (services) Index also rocketed off the COVID lows with new orders leading the charge. Employment (yes, there is a theme here) remained depressed and in contraction territory. Again, activity has begun to pick-up without a concomitant increase in the employment gauge. Employment tends to be far more volatile than the overall index, but the current 14 point spread is the widest differential between the headline index and the employment sub-index in history. And it is not simply manufacturing either. The ISM Non-manufacturing (services) Index also rocketed off the COVID lows with new orders leading the charge. Employment (yes, there is a theme here) remained depressed and in contraction territory. Again, activity has begun to pick-up without a concomitant increase in the employment gauge. Employment tends to be far more volatile than the overall index, but the current 14 point spread is the widest differential between the headline index and the employment sub-index in history. That is extreme to say the least.  That is how you get this type of surge in economic surprises without much in the way of labor market improvement. Is the Citi US Economic Surprise Index broken? Is it lying? No. It is simply measuring the unbelievable surge in the all of the “other” data outside of the labor market. That is how you get this type of surge in economic surprises without much in the way of labor market improvement. Is the Citi US Economic Surprise Index broken? Is it lying? No. It is simply measuring the unbelievable surge in the all of the “other” data outside of the labor market.  And that is where the nonsensical data meets a sensical reaction. Normally, “Dr. Copper” and U.S. Treasury yields react in a similar manner to a cyclical upturn in the U.S. economy. Copper rises as demand increases for industrial/manufacturing purposes, and yields rise due to the relationship of a better economy meaning higher employment and increasing wages leading to inflation. And that is where the nonsensical data meets a sensical reaction. Normally, “Dr. Copper” and U.S. Treasury yields react in a similar manner to a cyclical upturn in the U.S. economy. Copper rises as demand increases for industrial/manufacturing purposes, and yields rise due to the relationship of a better economy meaning higher employment and increasing wages leading to inflation.Activity is increasing across both manufacturing and services, but it is not leading to a pronounced upturn in employment. Copper and yields are not lying. There is an acceleration in activity. It is difficult to argue otherwise, and it is likely to continue. So, it makes sense for markets to react to that data. COVID is a different beast than most recessions. The leisure and hospitality sector is taking an outsized beating. Workers in the sector are exposed to a vagaries of surges in the virus that can cause them to be unemployed, underemployed, or employed all in a single month. That keeps Fed policy hopelessly sanguine for the foreseeable future. Longer-term yields are not lying. Maybe then, there is no disconnect between “markets” and the “data”. It is simply a question of putting the data together in way that captures the peculiarities of the moment. A “cyclical upturn” without the typical “yield consequences”. This time is different. |
By Steve Seville
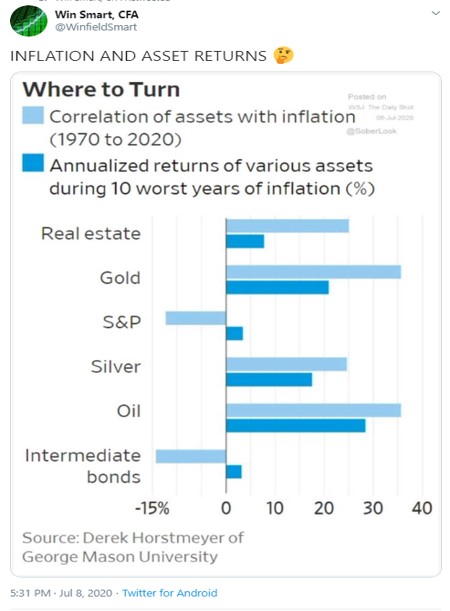
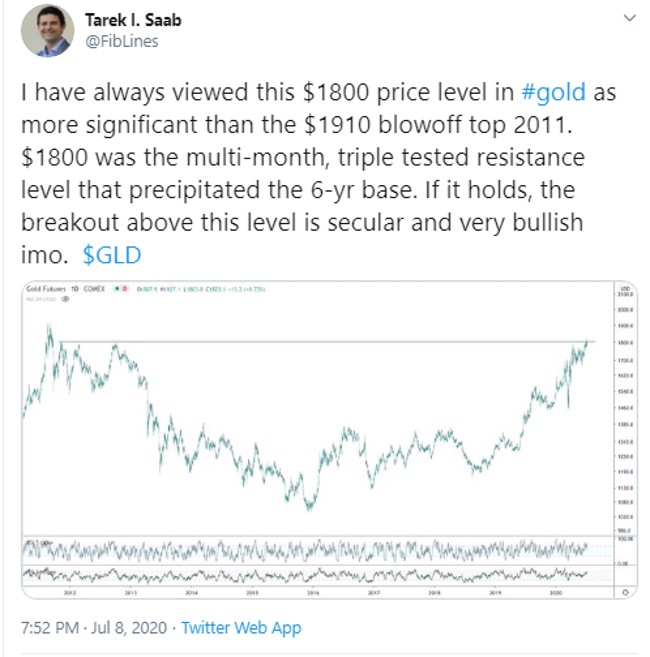
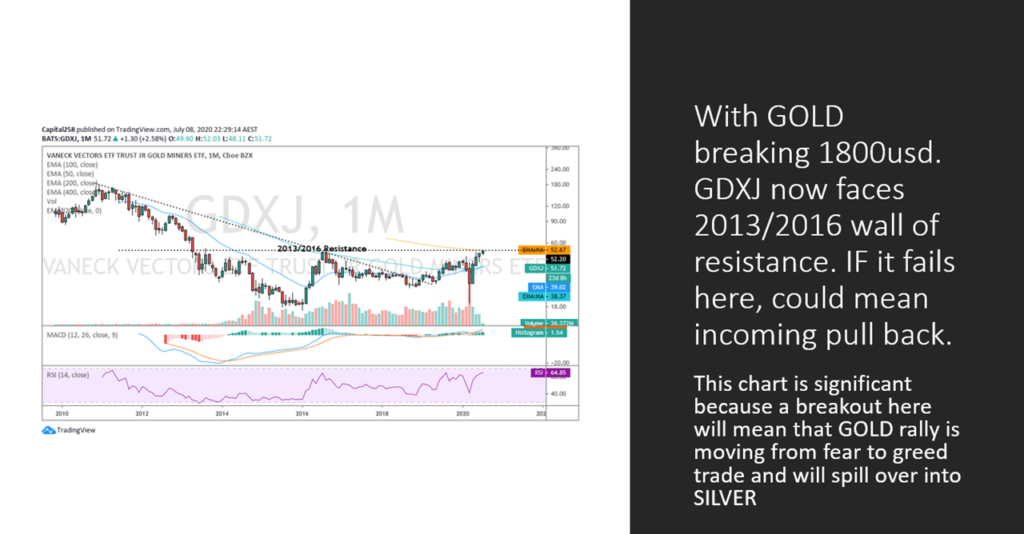
Gold is more money-like and silver is more commodity-like. Consequently, the relationships that we follow involving the gold/GNX ratio (the gold price relative to the price of a basket of commodities) also apply to the gold/silver ratio. In particular, gold, being more money-like, tends to do better than silver when inflation expectations are falling (deflation fear is rising) and economic confidence is on the decline.
Anyone armed with this knowledge would not have been surprised that the collapse in economic confidence and the surge in deflation fear that occurred during February-March of this year was accompanied by a veritable moon-shot in the gold/silver ratio*. Nor would they have been surprised that the subsequent rebounds in economic confidence and inflation expectations have been accompanied by strength in silver relative to gold, leading to a pullback in the gold/silver ratio. The following charts illustrate these relationships.
The first chart compares the gold/silver ratio with the IEF/HYG ratio, an indicator of US credit spreads. It makes the point that during periods when economic confidence plunges, the gold/silver ratio acts like a credit spread (credit spreads rise (widen) when economic confidence falls).
The second chart compares the silver/gold ratio (as opposed to the gold/silver ratio) with the Inflation Expectations ETF (RINF). It makes the point that silver tends to outperform gold when inflation expectations are rising and underperform gold when inflation expectations are falling.
We are expecting a modest recovery in economic confidence and a big increase in inflation expectations over the next 12 months, meaning that we are expecting the fundamental backdrop to shift in silver’s favour. As a result, we are intermediate-term bullish on silver relative to gold. We don’t have a specific target in mind, but, as mentioned in the 16th March Weekly Update when the gold/silver ratio was 105 and in upside blow-off mode, it isn’t a stretch to forecast that at some point over the next three years the gold/silver ratio will trade in the 60s.
Be aware that before silver commences a big up-move in dollar terms and relative to gold there could be another deflation scare. If this is going to happen it probably will do so within the next three months, although we hasten to add that any deflation scare over the remainder of this year will be far less severe than what took place in March.
*The gold/silver ratio hit an all-time intra-day high of 133 and daily-closing high of 126 in March of this year. This was one of the many unprecedented market/economic events of 2020.
https://tsi-blog.com/2020/07/why-silver-will-outperform-gold-over-the-coming-year/
By Doug Noland
The Shanghai Composite surged 7.3% this week, increasing y-t-d gains to 10.9%. The CSI 300 rose 7.6%, with 2020 gains of 16.0%. China’s growth-oriented ChiNext Index’s 12.8% surge boosted year-to-date gains to 54.5%. Copper jumped 7.1% this week. Aluminum rose 4.6%, Nickel 4.0%, Zinc 8.3%, Silver 4.2%, Lead 4.2%, and Palladium 3.5%. China’s renminbi advanced 0.9% this week to a four-month high versus the less-than-king dollar.
July 9 – Bloomberg: “Like millions of amateur investors across China, Min Hang has become infatuated with the country’s surging stock market. ‘There’s no way I can lose,’ said the 36-year-old, who works at a technology startup… ‘Right now, I’m feeling invincible.’ Five years after China’s last big equity boom ended in tears, signs of euphoria among the nation’s investing masses are popping up everywhere. Turnover has soared, margin debt has risen at the fastest pace since 2015 and online trading platforms have struggled to keep up. Over the past eight days alone, Chinese stocks have added more than $1 trillion of value — far outpacing gains in every other market worldwide.”
China’s Total Aggregate Financing (TAF) expanded a much stronger-than-expected $490 billion in June, up from May’s $455 billion expansion and 30% above growth from June 2019. TAF surged a remarkable $2.976 TN during the first-half, 43% ahead of comparable 2019 (80% ahead of first-half 2018).
It’s not easy to place China’s ongoing historic Credit expansion in context. While not a perfect comparison, U.S. Total Non-Financial Debt (NFD) expanded a record $3.3 TN over the four quarters ended March 31st. In booming 2007, U.S. NFD expanded about $2.5 TN. Chinese Total Aggregate Financing has expanded almost $3.0 TN in six months.
In the face of economic contraction, TAF increased a blistering $4.39 TN, or 12.8%, over the past year. For perspective, y-o-y growth began 2020 at 10.7% – and is now expanding at the strongest pace since February 2018. Beijing is targeting TAF growth of $4.3 TN (30 TN yuan) for 2020, about 25% ahead of record 2019 growth (and up 45% from 2018 growth).
China’s New Bank Loans expanded $259 billion in June, up from May’s $212 billion and 9% ahead of June 2019. At $1.727 TN, year-to-date New Loans are running 25% ahead of comparable 2019. Consumer lending has bounced back, likely fueled by some pent-up demand for mortgage Credit. At $140 billion, Consumer Loan growth was up from May’s $101 billion and 29% above June 2019 growth. The $509 billion year-to-date expansion in Consumer Loans was 4% below comparable 2019. Yet Consumer Loans were up 14% y-o-y; 33% in two years; 59% in three; and 135% over five years.
China’s M2 money supply expanded $496 billion during June to $30.5 TN, an almost 20% annualized pace. Over six months, M2 surged $2.120 TN, or 14.7% annualized. At 11.1%, year-over-year M2 growth has been running at the strongest pace since January 2017. M2 expanded 20.6% over two years; 30.9% over three; and 60.1% in five years, in one of history’s spectacular monetary expansions.
For perspective, U.S. M2 rose a record $950 billion during 2019. China’s M2 expansion more than doubled this amount in only six months. And with U.S. M2 up over $3 TN, combined Chinese and U.S. first-half “money” supply growth approached an incredible $5.2 TN.
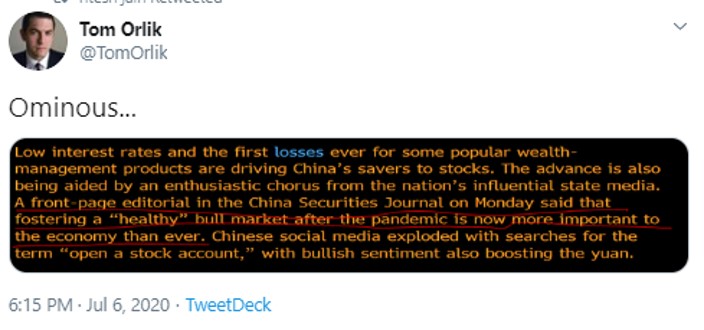
July 7 – Wall Street Journal (Jacky Wong): “Analysts fret that U.S. markets have become irrational thanks to so-called ‘Robinhood’ retail traders with plenty of time on their hands. But American markets have nothing on China. Chinese stock markets have been on a tear lately: the CSI 300 index, a gauge of the largest companies listed in Shanghai and Shenzhen, has gained 14% just in the past week… What really seems to have gotten Chinese investors excited however, is state media’s sudden switch to a bullish tone. A Monday front-page editorial in the state-owned China Securities Journal said it’s now important to foster a ‘healthy bull market’—in part because of more ‘complicated’ global trade and economic relations.”
It is a central tenet of Credit Bubble Analysis that things turn “Crazy” near the end of cycles. And with the thesis that we’re in the concluding (“Terminal”) phase of a multi-decade, super-cycle global Bubble, there’s been every reason to foresee Utmost Craziness.
In the most simplified terms, Bubbles inherently gather momentum and inflate to dangerous extremes. Mounting fragilities ensure policymakers employ the increasingly outrageous measures demanded to hold collapse at bay. Craziness is cultivated by a confluence of late-cycle intense monetary inflation (i.e. QE and speculative leverage) and deeply ingrained speculative impulses.
The bigger the Bubble, the more intense the speculative fervor; the greater the attendant government intervention; and the more convinced market participants become that officials won’t allow a bust. Throw Trillions at systems already acutely prone to Bubble excess and you’re courting disaster (that’s you, Washington and Beijing).
The global nature of Bubble Dynamics makes this period unique. And while Europe, Japan and EM are important contributors, the global Bubble is foremost underpinned by historic U.S. and Chinese monetary inflation. That these two countries are increasingly bitter rivals adds unique challenges to Bubble analysis.
The irony of it all: China’s communist party readily promoting the stock market. Do they have much choice? The Federal Reserve over three decades shifted away from the traditional model of affecting bank lending – elevating the financial markets to the primary policy stimulus mechanism. Instead of measured interest-rate reductions, on the margin, stimulating bank lending, the Fed has resorted to Trillions of securities purchases (QE) and zero rates to directly trigger market speculation and asset inflation. This model proved an absolute boon to U.S. markets, the economic expansion, the dollar and broader U.S. global influence. To compete, Beijing knew what it had to do.
The Nasdaq100 is up 23%, lagging China’s ChiNext Index’s 54% 2020 gain. These competing superpowers are increasingly in hand-to-hand combat for technological supremacy and global dominance. It is also apparent that these two economies will be “decoupling” – in an increasingly unsettled, bi-polar world. The relationship has of late commenced an ominous free-fall.
They do, however, share some commonality. The U.S. and China are both targeting securities markets to reflate their faltering Bubbles. Typically, the primary risks associated with exacerbating Bubble excess would be domestic-focused – i.e. increasingly unstable markets, economic maladjustment/fragility, and heightened social and political instability. Yet today’s backdrop adds a critical geopolitical component. Both face the momentous consequences that collapsing markets would entail for their competing global interests. Stakes are incredibly high – and policymakers respond accordingly.
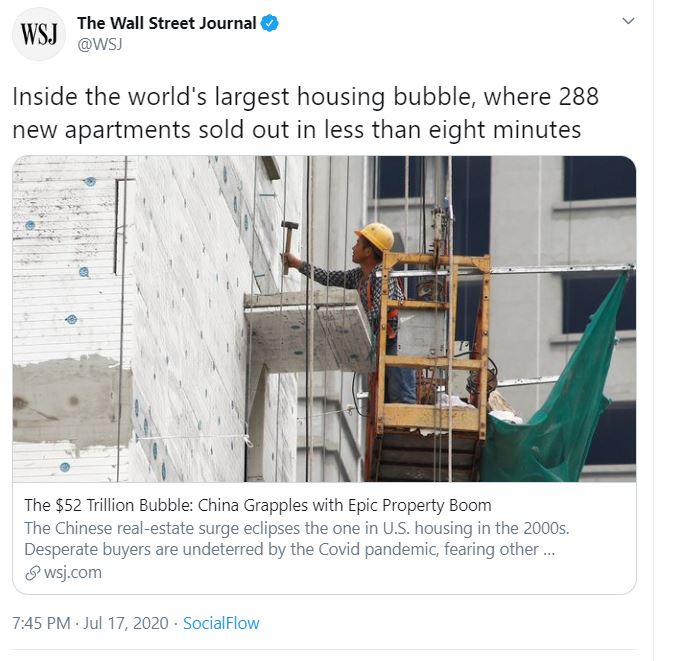
Chinese equities have been booming, and sentiment has turned bullish on China’s economic recovery. I’m unimpressed. Considering the unprecedented monetary stimulus along with pent-up demand, recovery is thus far unremarkable. Especially with surging COVID cases globally, China export sector struggles will be ongoing. And I question the wisdom of further stoking China’s historic apartment Bubble. I’ll be surprised if Chinese consumers don’t remain at least somewhat cautious for months to come. But if Beijing is hellbent on spurring a recovery, I wouldn’t bet against them in the short-term.
A combined $5.0 TN of new (U.S. and Chinese) “money” supply ensures epic distortions. For one, “money” has flooded into global securities markets. This has fomented an extraordinary reversal of short positions and hedges across global risk markets – equities, corporate Credit, commodities and currencies. Financial conditions have loosened markedly, with risk markets in the throes of a historic short squeeze.
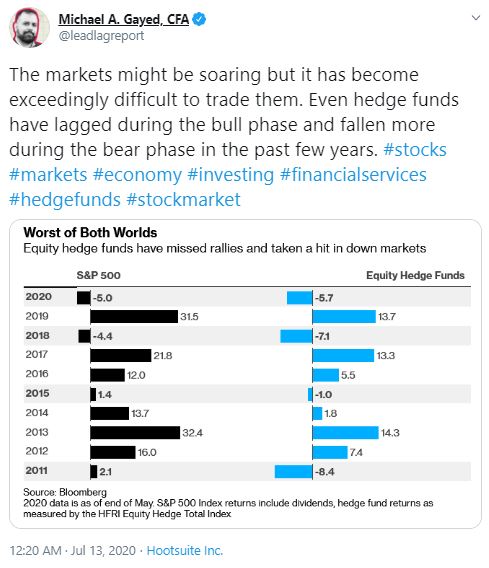
July 8 – Financial Times (Laurence Fletcher): “Lansdowne Partners’ decision this week to shut its flagship hedge fund has dealt a big blow to a key strategy — equity long/short — that is already struggling to find losers in stimulus-soaked markets. The move by the… fund… marks a major retreat by an industry pioneer. It also highlights how tough life has become in the years since the financial crisis for managers trying to pick out overpriced stocks during a seemingly unstoppable bull run. ‘It is much harder to see opportunities in the short book, either in terms of generating specific value or as a hedging offset to the long investments,’ wrote Peter Davies and Jonathon Regis, managers of the Lansdowne Developed Markets fund… Lansdowne’s problems reflect the wider challenges facing the $830bn-in-assets equity long/short hedge fund sector.”
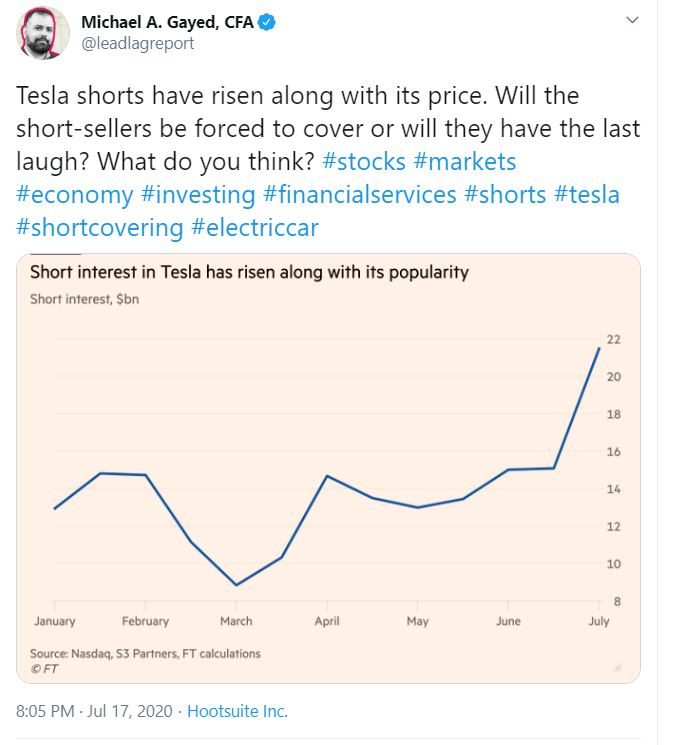
Tesla was up another 28% this week, boosting one-month gains to 51% and its year-to-date advance to 269%. With market capitalization of $287 billion, Tesla is the poster child for stock prices divorced from underlying fundamentals. Yet this dynamic is anything but limited to big Nasdaq stocks. At this point, panic buying and short squeeze dynamics have destabilized markets – from U.S. and Chinese equities to global stocks, corporate bonds and commodities. Did Beijing this week willfully administer a deathblow to shorts in Chinese equities and the renminbi – a squeeze that quickly broadened to the industrial commodities and global equities, more generally?
It’s not unusual for short squeezes to unfold even in the face of deteriorating fundamentals. There is often a final “blow-off” fueled by a confluence of speculative excess, panicked short covering, and derivative-related trading. It’s a key facet of late-cycle Craziness.
That sick feeling in my stomach returned this week: this is out of control. COVID is out of control. Market speculation is out of control. And it’s this combination that recalls the unease I was experiencing back in February, as a speculative marketplace was content to completely disregard mounting pandemic risk.
It’s difficult to fathom the almost 400,000 new U.S. COVID infections since last Friday’s CBB. Hopes from just a few weeks ago of a return to a semblance of normalcy have been crushed. The specter of overflowing ICUs and hospital wards has returned – but instead of NYC it will unfold in cities and towns across the entire southern U.S. And it looks like a replay of PPE and COVID test shortages.
And what the future holds appears more unsettled today than even in March and April. Back then we believed there was a curve to flatten. With shared sacrifice, we’d overcome the pandemic. It was not that many weeks ago when the estimate for COVID-related deaths was revised sharply lower to 60,000. Our nation has lost 134,000.
A harsh reality has begun to set in. At this point, no one – or any model – has a clue as to how many will perish – or even the general trajectory of this pandemic. The relatively low daily death rate was early in the week still a talking point for the dismissive. The daily death count surpassed 800 by the end of the week – on the way to 1,000, 2,000 or even higher?
Will the most populated states in the country be forced to dramatically tighten restrictions? Texas, Georgia, California and others are contemplating a return to “lockdown” conditions. Does this widely dispersed outbreak portend a major nationwide spike in infections – in cities, towns and rural communities? Are we prepared? Have we procured sufficient supplies?
Stocks are surging, so the economic recovery must not be at risk, right? Yet it’s difficult for me to see how the economy – at home and abroad – isn’t facing serious chronic problems. We’re only weeks away from the start of a new school year – and there’s little clarity. College football games are being cancelled and the entire season is slipping away. It’s simply difficult to comprehend what a mess we’ve made of things. Outrage is justified.
In Miami, apparently only 17% of new infections are generating follow-up contact tracing. Beyond the lack of sufficient tracer personnel, many newly infected are simply refusing to cooperate with local authorities. As a nation – from top leadership to us common citizens – we’ve got to quickly get our crap together and approach this crisis with more of a wartime mindset. Surging stock prices notwithstanding, there’s more than a small probability (10%, 20% – 50%?) of a quite problematic scenario.
Meanwhile, divisions, partisan infighting and a proliferation of nonsense are inflicting irreparable damage. Zerohedge uses this photo of Putin with a mischievous grin enjoying his bucket of popcorn. I imagine Xi and Putin chatting affably on a secure line in utter amazement – giggling.
Russell Napier wrote a piece on the above subject which I have summarized below
Q1 2009 Russell advised holding US equities till inflation reaches 4% .By 2011 , he saw problems in global banking system that would result in anemic credit growth making deflation a likely outcome. Inflation peaked below 4% in 2011 and by early 2015 US was reporting mild deflation.
The journey of inflation from 4% to 0 was not negative for the equities as a whole , it was negative only after inflation declined below 1% and corporate earnings declined.
We are currently in a deflation shock but by 2021 Inflation in developed world will be at or near 4%.
In Q4 2019, the conclusion was made that rising inflation would bode well for European equities, however a deflationary forecast was made. Since Q4 of 2019 we have had deflation shock with more to come causing equity prices and inflation linked bonds to move lower. European markets are pricing in even more low inflation but the forecast is that inflation will be near 4% in Eurozone which leads to a bullish call on European equites.
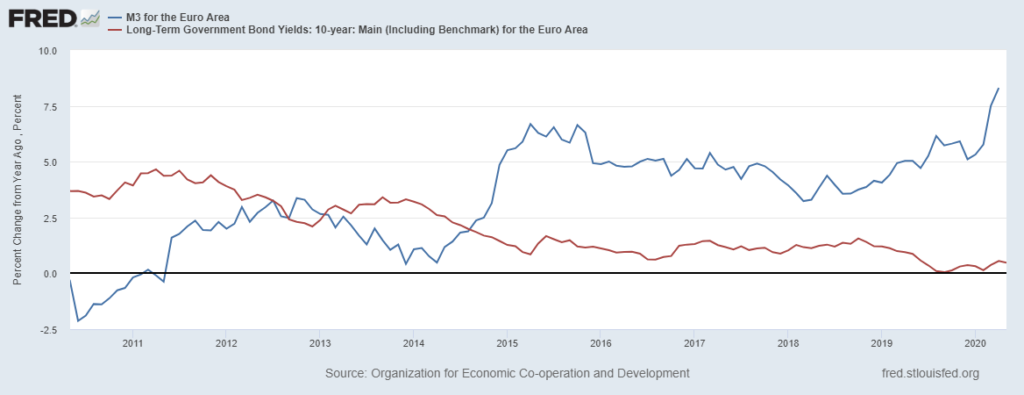
In eurozone bank credit guarantees have not yet fully impacted broad money growth, hence eurozone broad money growth will go higher. Eurozone M3 is already growing at 8.9% YoY and will exceed 2007 peak in after a few months. The other view by analysts is that as emergency programs subside surge in broad money growth will be an aberration and not impact inflation. The forecast is however as politicians use commercial banks balance sheets to launch new initiative backed by loan guarantees, these temporary measures will likely become permanent. Cautious investors would like to confirm the permanence of such schemes however Russell suggests it is time to embrace this new reality before its permanence is confirmed.
Case in point Spanish governments credit guarantee program has extended from $100 to $150 billion already.
The silent revolution as termed by Russell is the permanent shift of power of money creation from central bankers to democratically elected politicians. The incentive structures and mandates of politicians aligns with control of money supply through commercial bank balance sheet control. This means higher long-term interest rates even though near-term outlook is deflation.
The silent revolution will be priced in by the markets much before inflation actually shows its whites.
So current course action is to hold equities as market discounts the silent revolution with a lag. The equites may not rise all the way till inflation reaches 4%. It is highly unlikely governments would accept the accompanying long term interest rates corresponding to 4% inflation. As total debt to gdp ratios in both government and private sectors is at highs even before covid 19. These high debt levels can crush the reflation trade if interest costs rises dramatically, hence yield curve cap will be implemented
At levels of annual inflation above 6% , velocity of money could go out of control and with it ability for inflation to be tamed. Russell assumes governments may not want inflation to spiral above 6% , thereby the long term interest rates could be allowed to rise till 3%. The success of a repression is based on gap between inflation and interest rates. He suggests that even if inflation is allowed to rise as high as 6%, expect aggressive moves to tame it even as long term interest rates reach levels of 2 to 3 %. Allowing interest rates to higher levels too slow a deleveraging or a need of inflation that is too destabilizing.
In a world of rising inflation expectations central bankers will not be able to control long term interest rates. A cap on interest rates would be implemented by forcing savings institutions to buy government debt at targeted yields. Many believe that the combination of capped yields and rising inflation will be positive for equity prices , that will depend on what the saving institutions will have to liquidate to make way for the government debt , which is most likely to be equities. As yields get capped for decades the liquidation can be very prolonged.
Conclusion being that Equities will benefit on road to inflation. Move to cap rates between 2 to 3% can come before inflation reaches 4%. yield curve cap will be implemented by forced purchases of bonds by savings institutions which will have to sell equities to create space for bonds. In nutshell enjoy this equity ride till inflation touched 4%.
Louis Gave of GAVEKAL is also a great macro thinker and he just changed his view.
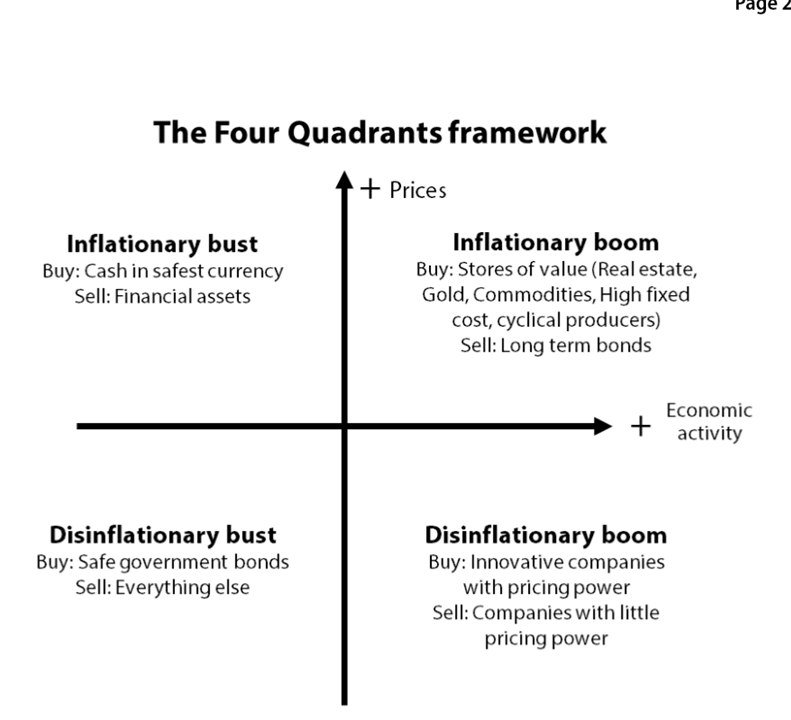
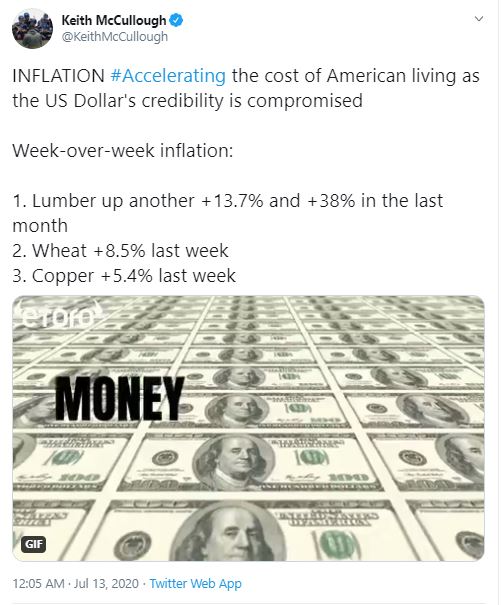
He believes that we are “accelerating into inflation” and hence the portfolio allocation should reflect the new reality.
He also believes that we are moving from ” Disinflationary boom” quadrant to “Inflationary boom? quadrant and the portfolio should be shifted accordingly.
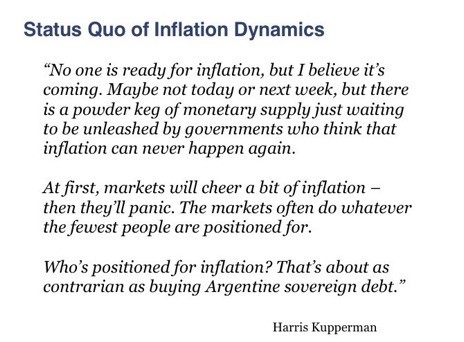
Harris Kupperman also wrote about emerging Inflation Dynamics on his blog.
My views
I belive the market is underestimating the impact of coordinating fiscal and monetary policy and is not appreciating the impact this can have on real economy and prices.