An Interesting Summer Awaits US all

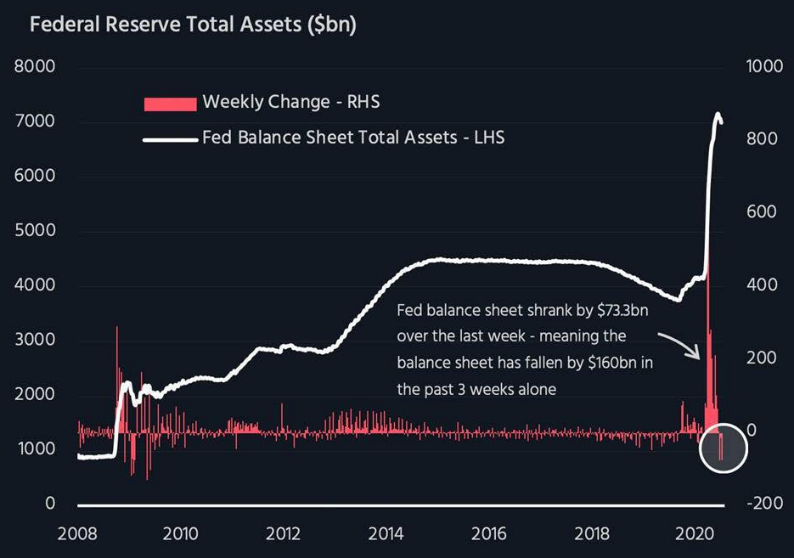
Since March of this Year the Federal Reserves balance sheet expanded from $4 trillion to $7.168 Trillion as the coronavirus spread played out.

Source : https://twitter.com/VPatelFX/status/1278808097679642627

But as of 2nd July 2020, the federal reserves balance sheet shrunk by $160 billion, which has been on account of Foreign Banks paying back the Swap Lines drawn in March.

Source: https://twitter.com/VPatelFX/status/1278808097679642627

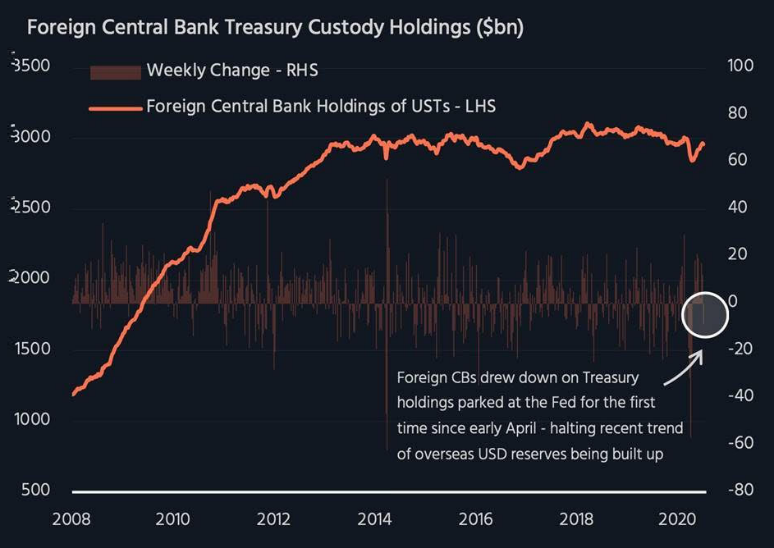
Foreign Central banks have again started selling treasury holdings which is concerning as this reverses the overseas buildup of reserves.

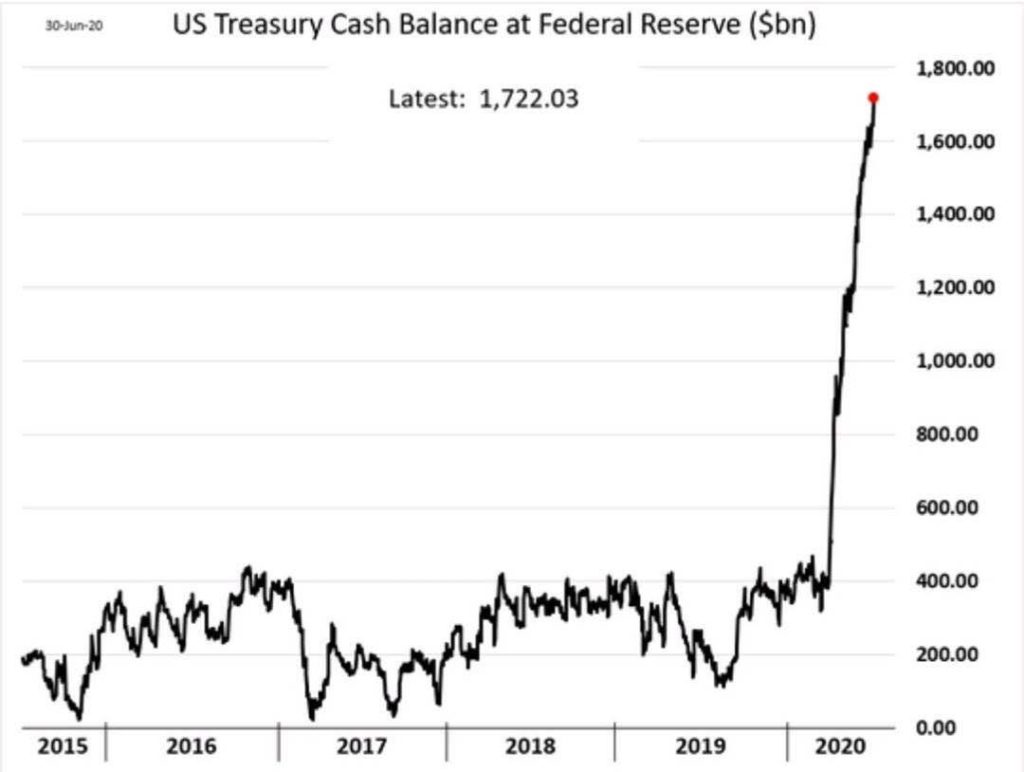
Meanwhile the US Treasury has increased cash balance at federal reserve to $ 1.72 Trillion which is extremely aberrant behavior. This can bode positive for the markets in the run up to the election. But in the interim till the money remains unspent and liquidity tightens in the banking system it can affect markets.

This is all indicative of the US Treasury preparing for a liquidity splurge in the run up to the lection to support asset prices leading into the presidential election. For the treasury to achieve this objective it would have to start spending money in August which would lead to a new high in the market just before the elections.

The course of action would be to be cautious at these levels and wait for either price or time correction expected in the month of July to reduce cash levels and add risk to play for a massive rise in liquidity towards US election.

The age of Inflation- Why I changed my view after 25 years- Russell Napier

Russell Napier had a concall today in which he outlined his views. He is the best known DEFLATIONIST in the world along with Albert Edwards . I have been following his work for almost a decade and when he wrote an article few days back that developed world inflation could touch 4% by 2021 I was intrigued.

Summary of his views below

  • Credit Guarantees offered by government over bank lending revolutionary because broad money growth will exceed 10% for foreseeable future.
  • Money created by Govts vs by Banks is the difference this time.
  • Developed world Inflation to exceed 4% by Next Year as velocity normalises to pre GFC level.
  •  QE did not lead to growth in GDP but only DEBT to GDP increased.
  • Central Bankers Don’t have control of money supply.
  • Government is now taking Contingent Liability and offering to bail out any default on principal thereby banks are now creating money.
  • Senior Bankers have told FT that these forced lending loans will result 50 % of them will likely go bad, also the average tenor of these loans are around 6 years.
  • Bank Credit guarantee solves problems of QE which did not lead in increase in lending to real sector.
  • The green loans and reconstruction loans are the real money magic tree and politicians will not relinquish this power, most severe in Europe as 19 countries printing money without any coordination.
  • Euro will thus cease to exist due to excess printing and capital controls.
  • US will be last holdout due to property rights, dollar will strengthen vs Euro
  • EM ‘s getting through this especially countries without foreign denominated currency loans, financial restrictions and debt to gdp does not go above 200% will attract capital.
  • US M2, China M2 and Eurozone M3 to go even higher backed by Credit guarantee schemes and can continue for some time.
  • China has limits to what it can do and will thereby have a flexible exchange rate.
  • Japanese equities can be a winner due to inflation emerging.
  • Non-Bank Credit will get capped by forcing institutions to buy more government bonds and ratchet up transaction tax etc and will thus have to sell their current holdings which can bode consequences for equity prices both ways.
  • Velocity was down due to QE, because if you exchange new money for an asset there is a high chance the next transaction will also be used to buy an asset rather than goods or services .
  • US broad money grows by above 10% and thereby velocity will go up.
  • All these events are bad for bonds although in near term they can sustain value as regime changes
  • Yield curve control because of higher inflation is like throwing fuel on fire, worked previously because early yield curve events were when there was deflation.
  • Federal Reserve will force savings institutions to buy bonds and use them for yield control and these institutions may thus have to sell equities.
  • US residential real estate is reasonably valued with respect to wages and thereby can gain.
  • Major Reallocation of wealth from lenders to borrowers will happen and will be enforced by financial repression.
  • Equities that were pilloried before will be good to buy for example Japan , because of higher real returns.
  • From a 10-year perspective prefer first Japanese equity ( high gearing with higher sales growth) and then EM equities. Very bullish on India
  • Prefer GOLD to GOLD miners
  • There were two forces of deflation 1. China and 2. Technology. In the new cold war china is now taken out of equation
  • Will not invest in Russia or china because you might be thinking of return on capital but my worry is return of capital
  • India is the biggest beneficiary of new cold war between US and china
  • Prefer mortgages to commercial real estate or private equity because govt guaranteed credit will favor voters to keep “American dream going”
  • Prefer chemical/petrochemical/cement/steel/supermarkets
  • Prefer banks in short term but in long term govt “running banks is not good”

We cannot operate economic policy if we do not have a strategic and medium-term framework: Rathin Roy

Says decision needs to be taken on funding mechanism of public institutions such as NIPFP

“We need to design and think through the future in a strategic and medium-term framework. We need to work better with the data we have and, most importantly, we need to have wider public participation on the kind of economic policy we need. We need to, therefore, move from an administrative approach to an executive approach,” says Rathin Roy, Director, National Institute of Public Finance and Policy (NIPFP).

Roy, who has now put in his papers, has always been vocal about his views on ways to recover from economic shocks. Chatting with BusinessLine, as he prepares for his next move (which he didn’t disclose) come September, he said: “I have been, for years, advocating that we modernise our public systems; while I have been listened to with great courtesy, this has not happened. I believe this is very important for India.”

His experience as part of the Prime Minister’s Economic Advisory Council is that the political class is more receptive to suggestions than the bureaucracy, he said. Excerpts:

What triggered this decision to move out of NIPFP?

Well, my decision to move out was taken last year. I had been contemplating it for some time. It had nothing to do with Urjit Patel joining NIPFP (the former RBI Governor has been appointed NIPFP Chairman). I would have loved to work with him.

I felt I needed to work and talk about the situation the world and India find themselves in today without being constrained. I have felt for some time that the problem we face with the economic crisis and the Covid-19 crisis is just not to do with the government, but to do with society at large.

A low fraternity society results in deficiencies in outcomes. A divided society begets a polarising polity. These severely detract from the effectiveness of economic policy and the functioning of rules and institutions.

What do you think is the biggest long-term challenge?

I have been, for years, advocating modernising our system. While I have been listened to with great courtesy, I believe this is very important for India. I believe we cannot operate an economic policy if we do not have a strategic and medium-term framework.

We need to work better with the data we have, and most importantly, we need to have wider public participation on the kind of policy we need. We need to, therefore, move from an administrative approach to an executive approach — I have spoken about this but have failed to get traction.

I think it is about time that some leader sees this as a very important constraint on the effectiveness of economic policies in India, and attention is paid to developing a medium-term and strategic policy approach.

What were the challenges at NIPFP?

A decision needs to be taken on whether public institutions like NIPFP should continue to receive public funds to undertake policy-relevant research, or purely exist as service providers and training centres. Both cannot be simultaneously achieved, and many public institutions in India have diminished because of the inability to see this contradiction.

Since the private sector is not going to fund research on public finance, it becomes an existential question for NIPFP — whether it can continue in the same way. We need to see how the funding base can be broadened, consistent with our public interest mandate.

How do you see Aatmanirbhar Bharat package? Is it a stimulus?

First and foremost, I have never advocated any government providing a stimulus. What the government can do is be supportive of economic activity — support where it is needed. What the government has done, I think, is to provide some income support to vulnerable groups, which is a good thing.

But the bulk of the response has been to facilitate monetary and credit support, This implies, essentially, asking the private sector to take the initiative and, in turn, incentivise them with more reforms. Whether it will work or not, we will have to see.

The private sector will have to play a vital role in restoring the economy. What we are lacking is a three-four-year roadmap that tells us the things we will do to recover from the shock and how it will align with the process of recovery after Covid. In a medium-term fiscal framework nested in such a roadmap, the issue of financing is very tractable.

What we are missing today are two things on the fiscal side — a medium-term fiscal policy and a medium-term economic strategy. In the absence of these, we are just looking at how to survive for the next three-four months because we don’t have the executive machinery to talk about debt and deficit in the medium term. To talk about these in the short term doesn’t help.

Data for economic projections remain a challenge. Do you agree?

I think we have to understand that good data put into public domain, accompanied by good analysis, is an essential input into effective policy making. If the immediate administrative imperatives of government, or the preferences of a powerful individual, drive policy actions, then the results are bound to be sub-optimal.

Thus, for example, if the data show that tax collections are falling, and analysis shows this is a structural trend, I think it is inappropriately defensive to carry on as if this were a temporary phenomenon.

The question which you have to ask is: why is it low; but that would require examination of data which is not in the public domain. That would also require a culture of prompt and consistent sharing of data, which is not the case at this time.

https://www.thehindubusinessline.com/economy/we-cannot-operate-economic-policy-if-we-do-not-have-a-strategic-and-medium-term-framework-rathin-roy/article31916170.ece
Owning Gold is as Much about Diversification as it is about Capital Appreciation

June 24, 2020 By Bryce Coward

Regular readers of our content know that we have been building the case for several years now on why gold deserves a place in diversified portfolios. Sure, we see significant upside in gold (unlimited upside, in fact), aided as I will show by the unprecedented rise in US dollar money supply in response to the COVID crisis. But the case for gold is much deeper than simply a story of potential capital appreciation.

These days, gold as an asset class is in an entirely unique position to not only provide upside potential, but also provide a layer of diversification within a portfolio that neither stocks nor risk-free nominal bonds can achieve on their own or even together. Much of this has to do with the rather disadvantageous position of risk-free bonds at the moment that have brought us to the death throes of the 60:40 portfolio. Indeed, with risk-free rates so close to zero (even on the long end), bonds simply don’t have enough convexity (aka capital appreciation potential) left in the tank to act as a sufficient diversifier of equity risk. After all, if the 10-year bond yield drops to 0.00% from the current 0.68%, that would provide owners of that bond with a whopping 6% capital appreciation, which is not nearly enough to cushion a 20% or 30% equity selloff.

Now, things may be different if the Federal Reserve was open to the idea of setting the Fed Funds rate at -3% or -4%, but that idea has been sufficiently brushed into the dusk bin. Instead, the Fed appears more likely to add some form of yield curve control to its policy toolbox. This will relegate risk-free bonds to a purgatory of sorts in which they can provide neither income nor capital appreciation potential of any magnitude.

Conversely, gold provides both capital appreciation potential as well as diversification to equity risk. Said in modern portfolio theory parlance, gold has the potential to bring one’s portfolio closer to the efficient frontier. That can no longer be said of nominal risk-free bonds.

Now, let’s get to some charts to illustrate these points.

The fundamental case for higher gold prices is really quite simple. While many view gold as an asset class that rises when inflation expectations or actual inflation rises, it’s even simpler than that. The quantity of gold is relatively fixed. The quantity of money is not. Therefore, when the quantity of money rises, the price of gold as priced in terms of that form of money must also rise. Sure, inflation may be a consequence of a rising money stock (Milton Friedman’s “inflation is always and everywhere a monetary phenomenon”), but it also may not be (see 2009-2019).

So from an empirical perspective, we observe that gold has a closer relationship with the quantity of money in the economy than it does actual inflation. The first chart below shows the US dollar price of gold compared to United States M2 money supply. The price of gold tracks the quantity of money quite well, with some deviations from trend that have always corrected over a fairly short period of time (see the late 1970s-1980s, early 2000s, 2010-2011).

Another way to show this idea is to plot the price of gold relative to the money supply. What we observe is a flat overall trend with the bulk of the distribution concentrated around a rather narrow central tendency (blue bars on the right of the chart show the distribution of observations). Sure, the price of gold is not entirely a function of the quantity of money, otherwise the line would be flat as a pancake, but it’s close enough for government work.

Now, when we do the same exercise again and plot the price gold relative to consumer prices, we see something entirely different. First, the trend is not flat, but has a positive slope. Second, the distribution of the series is not concentrated around a narrow central tendency, but instead the distribution itself (blue bars on the right) is kind of flat. Basically, this chart shows that gold really is a rather imperfect inflation hedge. The other explanation is that our measurement of consumer prices is imperfect, but that is a topic for another day.

Since the price of gold generally rises with the with the quantity of money, it makes perfect sense that gold would perform well with the M2 money supply growing at 23% YoY, as it is currently. Further, it doesn’t take much extrapolation or imagination to see the path toward continued fast money growth. After all, with policy rates at 0.00%, the remaining tools of fiscal spending that is funded by an ever-growing Fed balance sheet (i.e. money growth) makes logical sense at this juncture.

With the fundamental case for higher gold prices out of the way, let’s move onto gold’s application as a portfolio diversifier. The reason it makes sense to form multi-asset portfolios vs all-equity portfolios is that equity risk hard to diversify away with a portfolio of…equities. Indeed, even as there exists idiosyncratic risk exposures of individual stocks, there are market forces of demographics, interest rates, productivity levels, economic growth rates, etc. that affect both public and non-public equities. One way to show this concept is simply to plot the average correlation between stocks in the S&P 500. The average correlation between the S&P 500 constituents ranges from 40-60% in normal times and then rises towards 100% in selloffs (see early 2018, late 2018, early 2020). In other words, all that idiosyncratic risk exposure of equities as an asset class (both public and private as we recently learned) gets tossed out the window in a selloff and one’s “diversified” equity portfolio morphs into market risk only, or beta.

It used to be that long-term Treasury bonds could be used as a diversification tool to cushion the blow of equity selloffs because they typically appreciated a lot during market drawdowns. We can show this by plotting the correlation between US stocks and long-term bonds in the bottom panel in the next chart. Since 2014, long bonds were nearly always negatively correlated with stocks and had a central tendency of -10% correlation to -40% correlation. That negative correlation is what you want from a hedge, or diversifier. But, you also need capital appreciation potential from that hedge. Bonds don’t have that anymore, as I previously showed.

What about inflation protected bonds? TIPS don’t have an interest rate floor the same way nominal bonds do. Theoretically, TIPS yields could trade severely negative if the Fed caps 10-year nominal bond yields at say, 0.50%, while actual inflation runs at 3% or 4%. TIPS also have a negative correlation with stocks just like nominal bonds as we see in the next chart. So, it appears, that TIPS may still have a place in a diversified portfolio as a hedge.

Now, let’s turn to gold. Gold exhibits the same negative correlation with stocks that both the nominal bonds and TIPS do. However, unlike nominal bonds it has no theoretical upside. And unlike TIPS, gold may appreciate in price independent of actual or expected inflation trends.

That is not to say, however, that gold and TIPS aren’t related. Indeed, gold and TIPS sport an average correlation between +40% to +60% (first chart below). This compares to a negative correlation between nominal long-term bonds and gold (second chart below). But the drivers in their price are different enough to justify places for both asset classes in a diversified portfolio. Indeed, gold has outperformed TIPS by 20% over the last 12 months and is undergoing what a technician might call a base breakout vs TIPS (third chart below). This action undoubtedly is a result of that growing supply of money to offset what is admittedly a hugely deflationary economic backdrop currently.

Sign up for reports from Knowledge Leaders Capital.

$190 oil sounds crazy. But JPMorgan thinks it’s possible, even after the pandemic

I know the following article first published in CNN sounds crazy and may be it is crazy but aren’t crazy things happening around us.

why I liked the article is because it has all ingredients of a great economics 101 about demand and supply. No body is contesting falling demand for crude but what about a steeper drop in Supply aided by collapse in Capex necessary to maintain the supply. Add a spice of climate activist and Large funds which are shunning oil equities, the oil guys are a lonely lot

CNN BUSINESS WRITES ….In a little-noticed report, JPMorgan Chase warned in early March that the oil market could be on the cusp of a “supercycle” that sends Brent crude skyrocketing as high as $190 a barrel in 2025.Weeks later, the coronavirus pandemic set off an epic collapse in oil prices as demand imploded. And yet the bank is doubling down on its bullish view.Brent hit a two-decade low of $15.98 a barrel in April. US crude crashed below zero for the first time ever, bottoming at negative $40 a barrel. The United States, Russia and Saudi Arabia — the three largest producers — have dramatically slashed production in response. The massive supply cuts helped breathe life back into oil prices.

Oil is up $80 in seven weeks. The remarkable recovery could be too good to be true

Oil is up $80 in seven weeks. The remarkable recovery could be too good to be trueThough demand remains depressed, JPMorgan still thinks a bullish oil supercycle is on the horizon. A huge amount of supply has been taken offline and the industry could have major trouble attracting future capital. “The reality is the chances of oil going toward $100 at this point are higher than three months ago,” said Christyan Malek, JPMorgan’s head of Europe, Middle East and Africa oil and gas research.

Looming deficit suggests prices will ‘go through the roof’

For years, the world has had more oil than it needs. That glut caused storage tanks to fill up to the point that crude turned negative in April. So oil producers slashed supply. But now the pendulum in the boom-to-bust oil industry could swing too far in the opposite direction. Oversupplied oil markets will flip into a “fundamental supply deficit” beginning in 2022, according to a JPMorgan report published June 12. The most likely scenario, JPMorgan said, is that Brent rises to $60 a barrel to incentivize higher output. The report didn’t spell out a price target for its bull case scenario — yet Malek told CNN Business that JPMorgan’s $190 bullish call from March still stands. In fact, he thinks it’s even more likely now. Malek, who has been bearish since 2013, pointed to the very large supply-demand deficit that’s expected to emerge in 2022 and could hit 6.8 million barrels per day by 2025 — unless OPEC and others pump much more. “The deficit speaks for itself. That implies oil prices will go through the roof,” he said. “Do we think it’s sustainable? No. But could it get to those levels? Yes.”

BP sounds the alarm

Of course, it’s hard to imagine triple-digit crude today. Some analysts believe even the rebound in US oil from negative $40 to positive $40 in just seven weeks is overdone. Coronavirus cases are spiking in some areas in the United States and Latin America. Demand for gasoline is improving but isn’t nearly back to pre-pandemic levels. And it could take years for the airline industry to fully recover — if it ever does.

BP warns of $17.5 billion hit as pandemic accelerates move away from oil

BP warns of $17.5 billion hit as pandemic accelerates move away from oilBP (BP) warned this week that the health crisis could have an “enduring impact on the global economy,” causing less demand for energy over a “sustained period.” The UK oil giant slashed its forecast for Brent crude prices over the next three decades by 27% to $55 a barrel. BP also said it plans to write down the value of its assets — including untapped oil and gas reserves — by up to $17.5 billion. Somewhat counterintuitively, JPMorgan’s Malek said the BP writedown and gloomy forecast are “one of the most bullish” developments he’s seen. That’s because oil companies must spend heavily just to maintain production, let alone increase it. If they do nothing, output will naturally decline.And BP’s weaker outlook suggests even fewer long-term oil projects will make the cut. That in turn will keep supply low — even as demand rises. “It validates our point,” Malek said.

Oil spending could collapse to 15-year lows

Between 2015 and 2020, more than 50 new oil projects were sanctioned globally, according to JPMorgan. But the bank estimates just five so-called “greenfield” projects will come on the line in the next five years. And some Big Oil companies including BP, Shell (RDSB), Total (TOT) and ConocoPhillips (COP) have delayed making final investment decisions. Global upstream investments are expected to plunge to a 15-year low of $383 billion in 2020, according to a recent Rystad Energy report. Those spending cuts, Rystad said, will make it “more challenging to maintain existing production” and will potentially impact the “stability” of supply in the long run.

The pandemic won't fix the climate crisis. This $3 trillion recovery plan could

The pandemic won’t fix the climate crisis. This $3 trillion recovery plan couldOf course, Saudi Arabia and Russia have the firepower to respond quickly to supply shortages. The two nations, along with the rest of OPEC, are intentionally holding back production to get rid of the supply glut. But Saudi Arabia needs much higher oil prices to balance its massive budget, with breakeven at about $80 a barrel. “They’re not going to flood the market” for that reason, Malek said. That could leave room for the United States to respond. US output has also dropped sharply, with the number of active drilling wells sinking to a record low, according to Baker Hughes data that goes back to 1987.

The climate change factor

Yet shale drillers can’t bank on the once-unlimited stream of Wall Street funding. Investors are demanding frackers live within their means after years of burning through piles of cash. “Shale is growing up. It’s still there, but it’s maturing,” said Malek. Capital is being further restrained by heightened concerns about climate change and the rise of socially responsible investing. A growing number of investors simply don’t want to touch oil stocks. The combination of the price crash, capital flight and climate change could limit the oil industry’s ability to attract the necessary money — just when it’s needed the most. The past few months have shown how difficult it is to forecast the future. While $190 crude might sound far-fetched, so did negative-$40 oil.

https://www.cnn.com/2020/06/18/investing/oil-price-spike-jpmorgan/index.html

Big Bang Theory

Rohit Srivastava of indiacharts has written a brilliant article on cause and effect relationship.

For those who still believe in fundamentals should read the article below.

Rohit writes…In my most recent ‘Forex Analytics’ webinar I spoke about two possible regime changes that are taking place right now. The 1st major change is likely to be a move away from the deflationary regime towards an inflationary regime. I titled this ‘The reflation trade 2.0’ because the 1st attempt to make the shift was made in 2017 when the dollar index topped out to decline for the entire calendar year.

That was followed by a 2 year advance in the dollar that made a protracted attempt at the beginning of 2020 to take out the top made in 2017, but failed to do so and has left us behind with the possible double top in the dollar index.

dxy190620

While most people might wait long enough before they shift their positioning based on the above setup, Elliott wave analysis allows you to have the confidence to do so at a point when the risk reward is exponential, meaning that you are close enough to the turning point that may become the important stop loss for your view to go wrong. The ability to assess the probability of an opinion is not possible with any other fractal science. Knowing it early gives you a clear risk reward to deal with.

If you start looking for data to confirm then you might end up looking at backward looking information for example the chart below of WPI inflation that was published after the most recent data and shows a drop in wholesale prices growth to the lowest level in years. But this decline did not start in 2020 after the COVID-19 pandemic. Deflationary forces have been pushing down inflation since 2012 you look at longer dated chart.

wpi

This second chart shows the history of inflationary cycles in India. There are many spikes to 15% and higher that later cooled off. But we went below 5% after 2 decades in the late 1990s. The most recent episode saw inflation peak in 2010 and since then deflationary forces are at hold. The chart below is into the year end of 2019, so it misses the recent drop seen above. Now back at near zero inflation has a chance to start another move higher especially aided by fiscal and monetary stimulus.

cpi history

in my mind the 1st signal of this regime change came with oil prices dropping to single digits achieving many long-term forecasts for sub $ 20 that had been made over the years. Subsequently not only has the Fed stepped into buying oil bonds, but central banks around the world have resumed asset purchases that are being accompanied by some form of fiscal intervention as well. That oil prices have gone back from single digits to $ 40 recently may have gone unnoticed as the media went silent/numb on the rebound, after going hyper when we dropped to negative in the futures market. This quarterly chart shows the massive candle that we are forming on the rebound. 

crude 190620

Starting last year itself the RBI stepped up bond buying by conducting LTROs in a direct attempt at bringing down long-term interest rates to ensure transmission. The initial size of the program was small but expanded many fold after the Covid crisis. This is unlikely to stop.

RBI-Buys-Govt-Bond-1

The direct result of these operations can be seen in declining bond yields, that are now below the trendline from the 2002 lows, setting us up for interest rates that may end up being the lowest that we have seen in Indian history. This is now a trend and not a knee-jerk reaction as the central bank may continue to push yields lower, and over time expect borrowing rates not just for the corporate sector but consumer related purchases as well to come down significantly. Over the next year or two I would not be surprised if borrowing rates come down to lower single digits something we have probably not seen in decades.

gsec 190620

For investors this has a very significant bearing on their investment behavior. On the one hand saving accounts become even more unattractive and deposits lag behind the inflation rate. As inflation slowly makes a comeback equity valuations that appeared expensive all of a sudden start looking cheap. Valuation models after all a function of interest rates [or the risk free rate] and once you bring down rates everything changes. Some might argue that the end result would be a bubble, but bubbles are processes and they first need to be built before they can pop. The opportunity is in between

The years 2010 to 2018 involved the recognition of India’s economic winter in the form of excessive debt in the corporate sector and its resulting impact on non-performing assets in the banking system. Most of these problems are now in the open and being addressed by the central bank. Many corporate groups and banks and financial institutions have already reached near failure over the last 7-9 years. In its most recent address the RBI has stated that it will not allow any more of the banks/financials in India to fail.

We all know about the debt problem or the problem of overcapacity in some sectors and are doubtful about the solutions. However economic winter cycles always end with 1 of the 2 outcomes. Either a default by all over stretched sectors or and the debt leads to a series of banking and corporate failures and a contraction in the economy on the back of these events before growth can be revived, or, those in power decide along the way to attempt to inflate their problem of Debt/GDP by expanding the denominator in nominal terms. In short the nominal GDP can be increased by slowly increasing prices at an acceptable rate, to bring down the debt to GDP ratio.

It is very important to understand which one is being undertaken by the government or central bank in power to be able to comprehend the end result and its impact on investment assets. Too many people relate a deflationary cycle with the 1929 US stock market crash that involved the Dow Jones Industrials index falling by 90%. What they forget is that one of the reasons for this deep decline was the then President’s decision to allow businesses and banks to fail if they had made mistakes. This was among the primary reasons why the collapse exaggerated itself on the downside.

This is also the reason why central banks are more proactive this time round to avoid a similar scenario. However the other alternate path is to inflate. The is an option. In other words the outcome at the end of a deflation is not just something that has to happen one way, but a function of what the policy path is to reset the debt. By default or inflation. So we are not in a position to decide this. We have to pay attention to the policy makers and then take the lead. This then will show up in the many indicators discussed here from the dollar to inflation to interest rates. The path to inflation is the path it appears, at least at the moment, that most of the world has taken to. Provide as much liquidity in the financial system as required to ensure that there is no financial collapse because of systemic issues. To allow failed businesses to either restructure or be downsized and refinanced into a new entity. US started down that road in 2008, India now faced with its own crisis is going down the same path now. Lower rates and avoid financial failure. Then wait for the lower rates to reignite consumption as the cost of borrowing new money goes down making it viable even at higher prices of goods [read inflation of prices] accompanied by wage increases [another form of inflation in wages]. 

While the US has been trying to inflate its economy since 2009, it is new for India because we are only going through this process now. After more than a two year crash in mid-and small cap stocks and the broad market, and a sell off in large caps in the post pandemic period, India joins the rest of the world in an attempt to reflate the economy without a debt collapse. In many parts of the world where monetary policy is no more having an effect on the economy direct government spending is now be undertaken. India is currently at the stage of using more of monetary policy before it can adopt more fiscal profligacy. So a lot of the inflation India may face maybe imported. This part is important to understand. Monetary policy only supports expansion of debt and consumption but that does not always result in rising prices. Fiscal spending is more direct and its impact on demand and prices could be very different. India however is still behind the curve in the long wave cycle than other parts of the world. We are doing what they have already a decade ago.

All the above put together is having changes in many major trends that have been in force over the last decade. Here are a couple of charts showing historical cycles of some patterns. The 1st between value and growth investing. It displays a prolonged period of growth outperforming value a trend that might be overdue for change.

image 5113bc58-fefa-4ad5-9d99-91f64ec7e96820200604 231352

The 2nd chart shows another trend where developed markets were outperforming emerging markets. Part of the reason may have been the pressure that came from a rising dollar. The US recovery since 2009 was accompanied by a rising dollar that lead to many crisis in bond markets of Brazil and Russia, and a hyperinflation in Venezuela, and trouble in Turkey. The list may be longer, but an easing of pressure on the dollar could change this trend once again in favor of emerging market equities.

image-26

The advent of floating-rate currencies has been one of the greatest financial engineering feats of our time. It has allowed the world to manage interstate balances and debts in a way like never before. In the past the government would have had to devalue its currency openly creating a currency panic. However this single change decades ago change the game completely. Today multiple central banks devalue their currencies simultaneously or in sequence one after the other with no net effect on either. This does not mean that there have not been any casualties along the way, but at large we have been able to create a much larger credit environment. The chart below shows the exponential growth of total credit both government and corporate over time. The risk to emerging market debt that is at large now denominated in dollars comes from rising dollar. Between 2008-2020 EM debt expanded by over 10$ trillion [estimates]. A falling dollar environment where a large part of the dollars are supplied by the US Fed reduces the pressure on these financial markets.

EM debt to gdp

If the above trends create an even bigger bubble, we will have to deal with it tomorrow. But we are not at the end but a possible new beginning of a global bubble to be created by cheap money and easy credit in Emerging markets. Ems may attempt to Mimic the extravagance of the west. The regime shift from a strong dollar to a weak dollar maybe one of the biggest culprits of this trend. One of the secondary effects of all of the above might be another regime shift that markets have not thought about. Liquidity may flow from DMs to EMs financing another round of expansion at lower rates of interest as long as inflation does not become a problem.

Last but not least we may witness a move from a low Volatility regime to a high volatility regime. After years of the US weeks remaining below 17 on average, we may now have to get used to above 17. A similar period of high volatility can actually be seen between 1997 and 2003. In other words the tech bubble of the late 1990s actually took place in a high volatility regime and it did not change till the next bull market took hold. Few discuss this today given that low volatility has become the norm with many strategies built around it. If higher volatility becomes the norm then expect the coming bubble to the rapid and fast both on the way up and on the way down.

VIX 190620

At the end of such a long discussion people always want a timeline for these events. In my experience time is not a science but a guesstimate of possible future outcomes. The 7 year cycle for the dollar from 2017 may end in 2024 and can provide a rough timeline for these outcomes. What you can expect though is that this game goes on till inflation runs hot enough for one markets to pay attention. At that point interest rates will have to adjust to that reality and might break the bond market bubble. Interest rates particularly in EMs would be important. Interest rates in DMs are already flirting with negative rates. EMs are starting a move from high yield to low yield at the end of a deflationary crash in oil and commodity prices. Low interest rates and liquidity are the fuel for EMs as of now as long as the dollar is falling. If any of these factors change course so will I.

All this is still part of how the Economic Winter ends. So being bullish or bearish has nothing to do with the Economic winter. The winter is about debt. But the impact on markets can change from time to time based on policy action toward that debt and we need to pay attention. Given this explanation there is nothing irrational about what the markets are doing right now. Still, for those of you who still think it is irrational, while markets can be irrational longer than anyone can be solvent, timing is everything, irrespective.

MMT Going Mainstream…

via adventures in capitalism

June 14Th

Harris Kupperman writes

My Good friend Kevin Muir from Macro Tourist has been banging on about Modern Monetary Theory (MMT) for ages. I’ll admit, some of his pieces have been difficult to read as I’m firmly planted in the Austrian school—I believe gold is money and everything else is fiat. I believe governments create inefficiency and corruption while politicizing common sense ideas. I am against MMT in all of its insidious forms as it only legitimatizes all that I disagree with. With that out of the way, I’ve matured enough to know that what I think doesn’t matter. My job isn’t to stake the moral high ground; it is to make money for my hedge fund clients by noticing trends before others do. While I disagree strongly with MMT, Kevin has been right to repeatedly educate himself and his readers on MMT because it’s coming (whether or not you want it).

With Kevin’s permission, I have re-posted his most recent MMT note in full. I think this will be one of the most important macro pieces I’ll post on this site. There’s been a fundamental change in how governments tax and spend, yet most do not yet realize it. MMT is going mainstream. Are you ready…???


Yesterday, MMT-advocate, Stephanie Kelton released her much-awaited book, The Deficit Myth.

You might think MMT to be a crock. It might make every bone in your body shudder. You might feel sick to your stomach as you read the theory. These are just a few of the responses I have heard from traditionally trained hard-money types who learn about MMT.

I suspect most of you know that I am open-minded to many aspects of MMT, but expect it will be taken too far – just like monetarism has been taken too far.

When I see the extreme monetary policy of Europe and other countries with negative rates, all I can ask is how can anyone claim with a straight face that monetarism is working for us? So yeah, I would rather try something new than continue down the current road of easier and easier monetary policy.

Yet, what you or I think about a particular economic policy doesn’t mean squat. I am not here to debate what should be done, but what will be done.

So let’s put aside the economic merits of the different schools of thought, and focus on discounting their probable implementation.


The Deficit Myth

I haven’t yet fully read Prof Kelton’s book, but glancing at the introduction, she does an admirable job sketching out her viewpoint in easy-to-understand layman’s terms. I have taken the liberty of pulling the important bits:

There is nothing new in Kelton’s introduction. MMT’ers have understood these concepts for more than a decade.

But we always must remind ourselves, as traders and investors, what’s important is to discount how the public perceives those ideas. Remember the whole Keynesian beauty contest concept (probably not the most politically correct analogy, but let’s remember that Keynes lived in a different era. In fact, I suspect if Keynes were alive today, he would be more politically correct than some of his most vocal opponents –Niall Ferguson apologizes for remarks).

Keynes rightfully understood that investors discount what the crowd will perceive as the most likely outcome as opposed to the best choice.

Which brings me to my main point. And I know some of you might think this is nuts. But I don’t care.

I have been watching for signs that the concept of “governments are not financially restrained” taking hold within the non-financial community.

I have even postulated that the corona virus crisis might prove to be the tipping point for this theory gaining traction. With all the extreme fiscal measures being put in place (without undue immediate negative effects), the public might realize that the government’s large fiscal response works miracles at staving off short-term economic pain. They might suddenly understand there is nothing holding society back from doing that again for other priorities.

Well, I think I got my signal. Earlier in the week, I noticed a popular rapper tweeting out the following:

Yup. The whole theory behind MMT is being endorsed by rap musicians now!

When disputing the need for a balanced fiscal budget, MMT’ers have often resorted to the argument, “if there is always money for war, then why isn’t there always money for other social programs?”

I don’t want to dispute the validity of their argument. However, the narrative that “we need to balance budgets” has been torn down by the corona crisis better than the war argument ever did.

Over the last month, a growing portion of society has concluded that there was never any financial constraint to spending money.

I know the hard-money and traditionally-trained-economic thinkers will scream bloody murder at that thought. I get it. It doesn’t seem to make any sense. How can there be a free lunch? There is no such thing.

I will repeat again – I don’t want to discuss the merits of MMT. We will save that for another post.

What’s important – and it’s probably the most important thing that has ever happened in my investing career – is that the narrative surrounding deficit spending has changed.

Deficits are no longer “bad”. The budget hawks have all been silenced.

This will have ramifications that will last generations.

If this MMT school of thought continues to gain traction, then many of the investment playbooks from the last few decades need to be thrown out the window. It will be as a dramatic shift as the 1981-Paul-Volcker-stamping-out-of-inflation. It will be an end of an era.

Over the course of the coming months I will discuss the long-term investment consequences. But I wanted to highlight that MMT is about to go mainstream. And as it becomes more popular, it will turn investing as we know it on its head.

Decades from now we will look back at the corona crisis and say it changed more than just our attitudes about viruses, it marked the beginning of a change in the way we think about money.