The Corona effect on Supply chains and Inflation

Louise Gave was interviewed by Tyler Hay of Evergreen Gavekal on above topics.

Summary

On Supply Chains

I think the question around global supply chains is already a big focus of the US presidential campaign. The arrow in President Trump’s quiver is to say that this all happened because China is an untrustworthy partner. There’s going to be tremendous pressure on industries coming out of this to reduce their exposure to the international supply chain.

I wrote a piece at the beginning of this crisis called “Exponential Optimization.” I think that if you look at the past decade, we’ve lived in a world where everything has been optimized as much as possible. That includes optimizing balance sheets, share buybacks, and portfolios; but it also meant optimizing the supply chain. If that meant businesses could find a producer in the middle of Wuhan, China that would produce goods cheaper than alternatives, then they would do business there.  Of course, the idea of producing things in Wuhan might no longer seem like the best idea.

One of the first things to look at when constructing a portfolio is how much government pressure will be placed on a business to produce at home rather than in China, which will undoubtably impact margins. Take healthcare as an example. We live in a world where 90% of antibiotics are produced in China. Is that something that the government will feel comfortable with going forward? My guess is that drug companies around the world will be told that if they want to sell their drugs somewhere, they have to be produced at home without regard to cost. We can’t live in a world where all of our drugs are produced somewhere else.

We had a 30-year stretch of globalization in the supply chain, but it turns out that finding the cheapest producer actually has an embedded cost that we weren’t recognizing. Now that we’re recognizing this cost, we’re finding out that it’s actually really, really high. I think there will be big disruptions to the global supply chain and people will probably want to invest in companies that aren’t going to be massively dislocated from needing to relocate their supply chains.

On Inflation vs Deflation

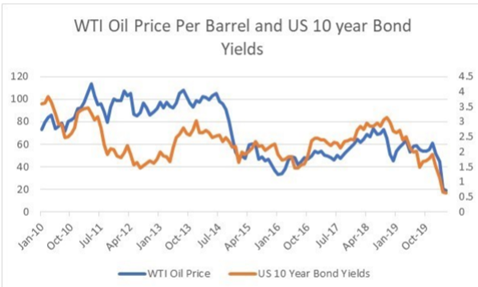
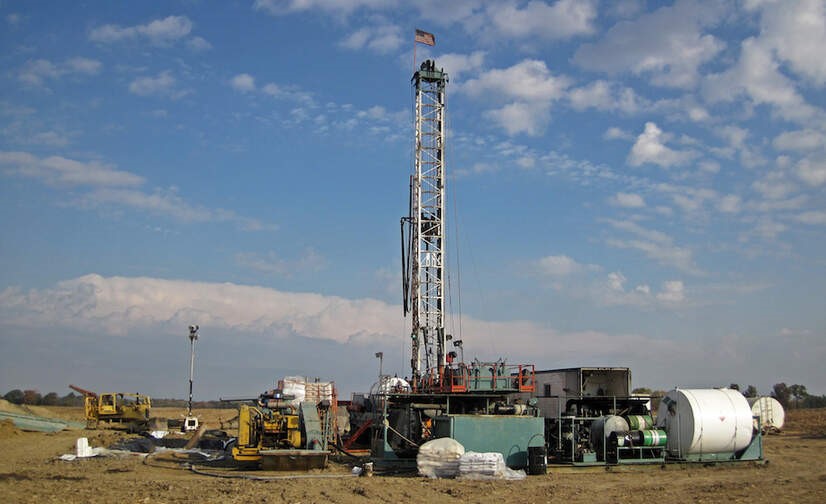
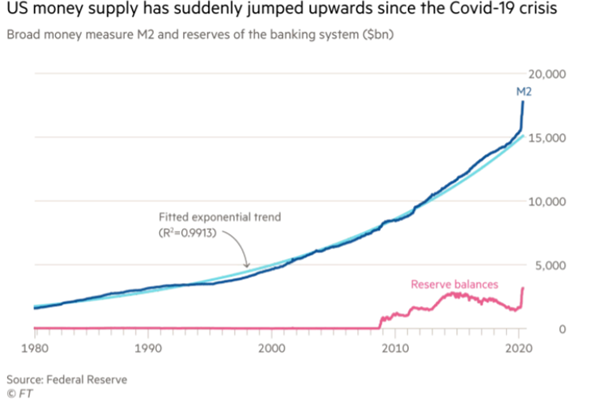
As a firm, Gavekal has been firmly in the deflationary camp for years and years. The reason for this is that every shock to the system was a fundamentally deflationary shock in that it didn’t really reduce supply – in fact, it often increased supply – but it did destroy demand. If you take the 2008 crisis as an example, we saw Quantitative Easing (QE) 1, 2, and 3, and a lot of people made the case that this was going to lead to a massive inflationary problem. But what people missed is China’s response to the crisis. It went on a capital and infrastructure spending boom such as the world has never seen. Up until 2008, if you were producing in China that meant you were either producing in Shenzhen or Shanghai. The production base for China was actually relatively small at that point. After the huge infrastructure spending boom China went through in 2008, you could produce in many other cities in China. The 2008 crisis resulted in nearly 500 million Chinese workers joining the global economy, which was a fundamentally deflationary shock. At the same time, oil prices were at $150/barrel and companies were pouring into new production all around the world. As money poured into energy infrastructure, oil prices came down over the next several years and today we’re much, much lower. Of course, the current economic hit means a destruction in demand, but the big question today is what happens to supply. What I see in the energy space is capital spending being slashed, so if I’m projecting three years down the road, I don’t think there will be an increase in supply of energy but a deterioration in the supply of energy.

Similarly, I don’t think that there will be an increase in the supply of workers. I think that the world will turn their backs on the Chinese workforce. Instead of bringing a supply of 500 million workers to the global economy, we’re going to be pushing them back. So even though I see a destruction in demand, for the first time in quite a while, I also see a destruction in supply. In fact, this entire crisis is really about a destruction in supply. We’re now seeing it in industry after industry.

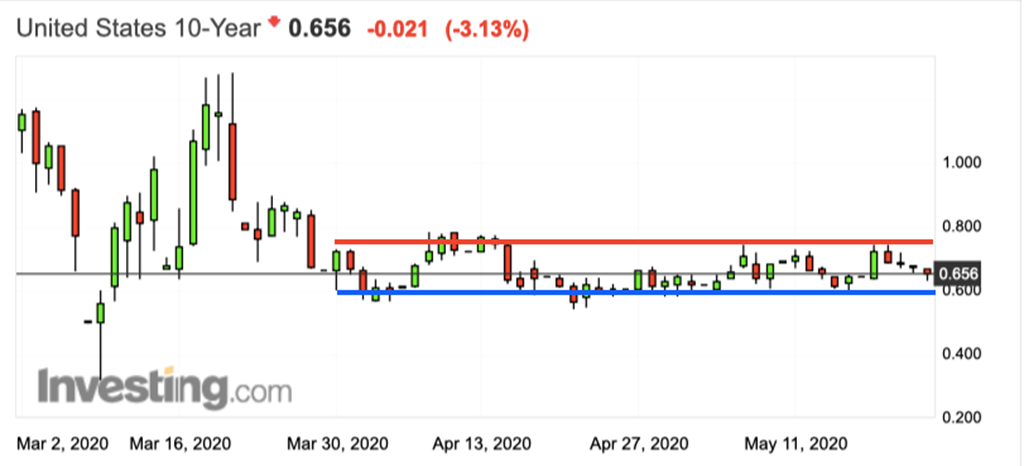
My big fear is that if you look at the TIPS market (Treasury Inflation-Protected Securities), it’s now projecting inflation of 1.1% every year in the US for the next ten years. Aside for 2008, the US hasn’t had an inflation rate of 1.1% in the modern era. Now we’re supposed to have 10 years in a row?

Right now, the rate of inflation is 1.5%. What happens over the next six months if, instead of going to 1.1% as the market anticipates, inflation goes to 2.0% or 2.5% as the result of supply chain disruptions? I think that would create a whiff of panic in the markets. I’m much more afraid of inflation that’s not priced in, than deflation that’s fully priced into markets.

History rhyming to the same tune again?

Russell Clark of Horseman Capital writes

1st Half (2000-2010)– Reflation trade

From a purely macro perspective, the emerging market and reflation story of the 2000s was a reflection of the exciting macro story of that period, the rapid growth of Chinese exports

– Rising commodity prices, Weak Dollar, Strong growth

2nd Half (2010-2020)– Deflation trade

The macro story of 2010s has been the tremendous growth in US oil and gas production, to make the US the world’s largest energy producer, and to turn the US from an energy importer to exporter.

Falling commodity prices, Strong Dollar, Weak growth

The tune – Core periphery model– Let me explain the components of this model

Core = US Dollar

Periphery = Rest of the world

1st half money moves away from core fueling rally in Periphery (emerging markets)

2nd half …The combination of slower Chinese growth, rapid oil production growth led to a collapse in oil prices, contributing to suppressed inflationary pressures, and this has precipitated a collapse in bond yields as central banks have desperately tried to reignite growth.

Rise in oil supply by shale + existing suppliers

Led to  Deflation

Which led to

which further led to

 Safety trades comprising of high tilt towards growth stocks + gold + long dated bonds

So what do we see happening

Many of these trends will reverse

Well the US shale boom seems to be ending which means us will be a net importer again and restart dollar weakening cycle.

With an uptrend of regulation moving towards the growth sector comprising highly of tech sector and a wave of regulatory green shoots regarding free riding of media platforms on free content we see entry of regulation as a reversal of the growth stock trend. The other parallel is like the dotcom bubble we live in the offload risk on to others platforms and a bubble based on Machine learning.

All this money from growth stocks will mean revert to Value stocks which have underperformed growth for better part of the last decade

Silver might start outperforming GOLD…..

Gold-Silver Ratio, monthly chart as of May 27th, 2020

and yield curve might start to re steepen again with help from short term yield capped by central banks.

Most investors are not ready for the change in this narrative and by the time they start repositioning their portfolio to reflect the new realities… major gains would have already been made.

Move on GUYS, I am back

I am talking about my favourite asset i.e Silver .

Gold/Silver ratio hit an all time high ratio of 1:120 in march this year and since then silver is silently outperforming GOLD with this ratio breaking down below 1:100 ( silver outperforming GOLD).

Gold-Silver Ratio, monthly chart as of May 27th, 2020

according to Midas Touch consulting

At this moment of time it takes about 97 units of Silver to purchase one unit of Gold. The monthly Gold/Silver-Ratio chart above illustrates that nine years ago it took only 31 units to accomplish the same purchase. Relationships like these rarely stay long in extreme measurements like the two mentioned. Consequently, it is quite reasonable to assume that we will at some point find ourselves near the 200 moving average, a value between those two extremes more likely in the future. Once Silver which is always late and lags, catches up with Gold’s extension, this medium Gold/Silver-Ratio zone will be reached. This means there is a force in place driving Silver prices still higher.

Julian Bridgen of M12 Partners write

After hitting our initial target around $100, the market chopped sideways for a week. But now, the Gold/Silver ratio appears to be starting the next leg. My target is the mid-80’s … a lower gold/silver ratio is historically inflationary!

Image

The best way to capture Silver upside is through Silver Miners.

Macro voices interview with Dr Pippa Malmgren

  • Shape of the economic recovery: Why “Letter Shapes” like V, W, L, and U are insufficient to describe what will occur
  • How financial markets will react to multiple recovery scenarios in the real economy
  • U.S.-China relations in the post-COVID19 world
  • State of the art in industrial drone technology

https://www.podbean.com/ew/pb-b3uei-ddc8bd

Falling Rig Count and Demand Normalization

05/ 28/ 2020

Topics: Oil MarketsCommoditiesNatural ResourcesShale Oil

Share

“If production were to average 80.5 mm b/d, then global inventories would go from ‘full’ to 15-year low levels in only two months.”

US added 38 percent more oil and gas rigs last year

Image Source: desmogblog.com

In recent blogs we’ve been discussing how OPEC+ cuts coupled with “involuntary” cuts from U.S. shale producers will dramatically limit available supply when demand normalizes. However, there is another element that will also affect future oil supply: the huge retrenchment in drilling activity taking place today.

The US oil rig count has fallen 45% in the last six weeks alone and our models suggest these declines will continue. Of the publicly traded companies we follow, capital spending has been cut by 40% on average so far with many companies now announcing a second round of cuts. In total, we estimate that the US oil rig count will fall by nearly 75% from 2019 levels. Our proprietary neural network tells us that US production will decline sharply by 2.1 mm b/d as we progress throughout 2020 based on these drilling assumptions (before considering any shut-ins). In other words, based upon capital spending guidance, new production would not nearly be enough to offset natural field declines from aging wells. This phenomenon would then continue into 2021 unless drilling activity were sharply increased later this year (something we think is unlikely).

In the rest of the non-OPEC world, several final investment decisions (FIDs) have already been postponed or rejected on long lead-time projects, making it a near certainty that production from this group will decline well into the 2020s. Summer maintenance programs in the North Sea will likely be deferred as well, saving near-term cash at the expense of production.

Together with the shut-ins discussed above, attrition from lower drilling expenditures and deferred maintenance could cause production to fall to 80.5 mm b/d by the end of 2020.

Image Source: rigzone.com

As demand normalizes, today’s large inventory overhang will be worked off much faster than anyone realizes. For example, “full” crude storage is approximately 3.5 bn bbl while the 15-year low level is 2.5 bn bbl. In the oil section of our Q1 2020 letter we discuss demand drivers in depth, but for now assume that demand normalizes slowly over the year eventually reaching 95 mm b/d by year end. While this sounds optimistic, we should point out this projection assumes demand would still be lower year-on-year by 5 mm b/d by year end (a conservative estimate). If production were to average 80.5 mm b/d, then global inventories would go from “full” to 15-year low levels in only two months. Even if OPEC+ fully reversed their production cuts, inventories would go from full to dangerously low in just under five months.

However, the reality in 2021 may be even more dramatic. Demand will likely continue to normalize, adding the remaining lost 5 mm b/d to regain the 100 mm b/d level. At the same time, the shales will continue to decline well into 2021, opening the gap between supply and demand to well over 10 mm b/d sometime next year.

http://blog.gorozen.com/blog/falling-rig-count-and-demand-normalization?utm_campaign=Weekly%20Blog%20Notification&utm_source=hs_email&utm_medium=email&utm_content=88645664&_hsenc=p2ANqtz-841SzaM_Bk3Vqn7l59vSr-aHCVBmDngNBF8tmdVCwT2NOe5_tq87ZHIpFyTtORzSpBrL4JHifgAbyPvvpQHijmmktXeQ&_hsmi=88645664

The Law of Holes- IceCap Asset Management

Keith Dicker has taken us to the uncomfortable corners of the investment world in this month’s newsletter.

The link to newsletter is attached below but I thought of sharing this chart from his newsletter which clearly depicts the outcome of massive money printing across the globe

http://icecapassetmanagement.com/wp-content/uploads/2020/05/2020.05-IceCap-Global-Outlook.pdf

Next bazooka ” Yield Curve Control”

Federal reserve Bank dusted an old trick to kill two birds with one stone.

Federal Reserve Bank of New York President John Williams said policy makers are “thinking very hard” about targeting specific yields on Treasury securities as a way of ensuring borrowing costs stay at rock-bottom levels beyond keeping the benchmark interest rate near zero.

“Yield-curve control, which has now been used in a few other countries, is I think a tool that can complement -– potentially complement –- forward guidance and our other policy actions,” he said in an interview Wednesday on Bloomberg Television with Michael McKee and Jonathan Ferro. “So this is something that obviously we’re thinking very hard about. We’re analyzing not only what’s happened in other countries but also how that may work in the United States.”

This will not only ensure a lower value of USD and increase the inflation expectation but also lower the DEBT/GDP by inflating away the debt.

The same remedy was applied by US in aftermath of WW2 nation building.

The default on bond obligation was more nominal than real. With cap on bond yields and increase in spending, the real interest were negative for better part of decade. The smart money went in search of returns and that decade was one of the best period for US equity markets as higher inflation and lower bond yields coupled with war spending led to higher corporate earnings and reduced the over all Debt/GDP of the US economy.

Conclusion

Fed is increasing floating trail balloons about yield control and I believe we might see the post WW2 playbook again which will lead to -3% to -5% real rates in US in next few years. This will be the decade when real assets makes a come back.

Silver’s Silver Lining

By Michael A. Gayed, CFA via seekingalpha.com

Summary

Investors may consider some exposure to silver as the multi-year, supply-demand surplus scenario looks to be transitioning towards a more favorable picture.

On the demand side, I expect industrial production to ramp up by H2 20/2021; the increasing trend of electrification and solar energy should support demand sentiment.

In these heady, uncertain times, laced with excess monetary stimulus, silver, to me, offers more value than gold.

I do much more than just articles at The Lead-Lag Report: Members get access to model portfolios, regular updates, a chat room, and more. Get started today »

Everyone’s looking for gold. So, I’ll be the one collecting the silver. – Rehan Khan

Source: Yahoo Finance

A couple of weeks ago, I questioned if silver might take some steps to correct its broad underperformance relative to gold. Since then, the former has made some headway in addressing this, with May proving to be a really good month so far. Of course, this outperformance has come over a very small sample size, and I don’t want to jump the gun, but I do think there are some rather interesting conditions brewing for the medium-term prospects of the white metal.

Gold-silver ratio

The gold-silver ratio has almost always been a good leading indicator of how things could pan out in the world of silver, although, it’s fair to say that we might have to calibrate our expectations, given how this ratio has zoomed towards unprecedented levels recently. Up until this year, the long-term average of this metric was around 60, with the 85-90 levels being hit only 4 times over the last 20 odd years (2003, 2008, 2016, and mid 2019). At 100-plus levels, currently, this ratio does appear rather stretched with room for more reversion. Even if you think reversion towards the long-term average of 60 might be a bit of a stretch, I do think there are some compelling fundamental factors (which I expand on below) that could help push the ratio down to the bottom end of the ascending price ratio channel, which is around the 80-90 zone (which would still be overbought by historical standards).

Source: Trading View

Broad supply-demand picture

Source: Silver Institute

Over the last four years, the supply-demand equation for silver has not been conducive for silver prices with a surplus being seen every year. However, what’s encouraging is that the imbalance has really come off from the elevated levels of 62-68 million ounces seen in 2016/2017. In 2020, whilst we are likely to have yet another year of surplus, you’re still looking at a whopping 53% y-o-y drop in the market balance at 14.7 million ounces. The key juxtaposition here is between industrial demand and mine production. Whilst industrial demand had grown at a CAGR of 3% from 2015 to 2019, mine production during this same period came off by -2%, and I don’t think we are too far away from having a deficit situation in silver.

Silver supply

Source: Metals Focus

Mexico remains, by far, the largest producer of silver, making up c.23% of global production. Peru is the other dominant country in this space, and even before the pandemic brought things to a standstill, there were some pretty significant production cuts in both these countries last year. This was mainly on account of declining grades at several large mines and disruption-related losses at some major silver producers.

This year, things have turned for the worse since mid-March, with all the key silver producers being impacted by mandated production suspensions, refinery and smelting disruptions, and transport disruptions. Mexico is still in broad health emergency with lockdowns until May 30th, although mining has been permitted since May 18th, provided a certain mine is located in a municipality with no to few active COVID-19 cases. In Peru as well, one has seen a similar theme, although there has been a gradual resumption of activities since the 2nd week of May, with miners operating at 35-40% capacity. All in all, c.66% of total global silver production was put on hold this year, the most for any metal!

Even for the rest of the year, I’m not sure we can expect a significant ramp up on the production front with big silver mining companies, including Pan America Silver Corp. (NASDAQ:PAAS) and First Majestic Silver Corp. (NYSE:AG), all announcing plans to cut capex and exploration activities.

Silver demand

Unlike gold, silver’s utility in the industrial landscape is a lot more pronounced. Key applications include electronics, automobiles, medicine, solar, water purification, window manufacturing, and brazing alloys. I wrote recently about why we could see a pickup in global industrial production by H2-20 and that should bode well for the prospects of silver with industrial demand accounting for c.55% of total silver demand.

Two silver consumer segments that I am particularly enthused about are the automobile and the photovoltaics segments. Silver’s use in automobiles has gone up considerably over the last decade due to a push towards more electrification (silver is one of the most reflective and best conductors of electricity). Whilst this industry may have been hampered in H1, demand in the large auto markets of the world is preparing for a rebound.

Source: CPM Group

If you look at the supply-demand table above, you can see that industrial demand from photovoltaics has grown very strongly, doubling from 48.4 million ounces in 2014 to 98.7 million ounces in 2019. I believe solar energy is here to stay as it is an inexhaustible fuel source that is pollution-free and one that is fast becoming more versatile and affordable. According to Allied Market Research, we’re looking at a c.21% CAGR industry, poised to hit $223 billion by 2026. An interesting concept that is gaining traction in the US is solar carports. This is one of the most viable options for refueling EVs and is currently in use at several large department stores, federal and state locations. The US Department of Energy has suggested that the country might need c.8000 solar carport stations to provide a minimum level of urban and rural coverage. In addition to a general industrial pickup, as we go greener and vehicle electrification gains momentum, silver demand should inevitably ramp up.

Silver – a less expensive gold proxy for these uncertain times

In addition to the utilitarian value that it offers industries, I’d also like to think of silver as something as a gold proxy. On account of the unprecedented level of recent monetary stimulus that has decimated the value of paper currencies, precious metals such as gold and silver will be increasingly seen as a store of value to mitigate this. Gold, of course, has been the rockstar of asset classes in the recent past, but I think there is greater value to be seen in silver. I expect physical investments in silver to ramp up as investors diversify away from uncertain equities and seek suitable alternatives to cope with a potential reflation scenario. Net physical investment in silver which grew at 12% YoY in 2019 is poised to grow at an even greater rate of 16% this year. Interestingly inflows into silver ETFs have been gaining speed, up 13% YTD. Incidentally, last week, a major ETF – iShares Silver Trust (NYSEARCA:SLV) saw a significant week on week spike of 5.4%, adding 24 million units.

Conclusion and how to play silver

The risk-reward on silver is not as appetizing as it was back in March, and as mentioned at the start of the article, May has been particularly good for this white metal, with silver futures up c.17% on a 1-month basis. That said, as implied by the gold-silver ratio, I still think there is further room for silver to move. Over the medium term, encouraging fundamental factors should keep interest in this metal elevated. If you’re an equity person, you can consider key silver miners such as First Majestic Silver or America Silver Corp. but this would not be my first preference as they also have exposure to other metals and you have to contend with company-specific issues. Besides, these stocks have more than doubled in value since the March lows. My preference would be the ETF iShares Silver Trust that more closely tracks the performance of silver and is still yet to break out of the long-term range.

Source: Trading View

https://seekingalpha.com/article/4349941-silvers-silver-lining

Why a calibrated intuition matters?

There are three distinct sides of risk –

1.Odds of a phenomenon occurring

2.Average consequences of a phenomenon occurring.

3.Tail end consequences of a phenomenon occurring.

As this crisis and almost every decade we find our financial system being dominated by players who concentrate on the first two aspects of risk and not the last one. These funds like a few quant funds had risk party executed using low vol strategies which blew up even in the face of fed backstops.

These tail risk events don’t matter until they suddenly are the only thing matters as the market swings from purchasing power risk to principal risk. Now is there a class , textbook or special coaching that can allow you to think about tail risk. And the answer seems to be no because such a calculation is not rationally possible by the brain nor is it possibly computable in the fundamentally uncertain universe, we live in.

It is over here that experience or trauma matters because these memories can fundamentally reshape your risk aversion and perception through its effect on the hippocampus and Amygdala of the brain.

The author recounts his own experience where he and two of his other friends would go out skiing sometime in places that they weren’t allowed to as they were prone to avalanches. This one time he actually faces an avalanche that does not turn out to be life threatening but buries his feet in the snow , all the friends laugh it off but he was clearly shaken. The next time he went skiing again with his friends on being asked to ski the dangerous parts again , he unconsciously said no. The author makes the point that these unconscious decisions can affect our lives for better or worse , much more than the conscious decisions which fall into the first two categories of risk.

In investing, the average consequences of risk make up most of the daily news headlines. But the tail-end consequences of risk – like pandemics, and depressions – are what make the pages of history books. They’re all that matter. They’re all you should focus on. We spent the last decade debating whether economic risk meant the Federal Reserve set interest rates at 0.25% or 0.5%. Then 36 million people lost their jobs in two months because of a virus. It’s absurd.

Tail-end events are all that matter.

Once you experience it, you’ll never think otherwise

https://www.collaborativefund.com/blog/the-three-sides-of-risk/

Deflation, Inflation or Stagflation?

As the Long-term debt cycle dynamics become more important as the day passes. This crisis has been one where we have had demand and supply side contraction at the same time. The current scenario signals deflation and may also render previous inflation indices meaningless.

While previous money printing by central bankers had to led to hyper inflation , Current US M2 shows large jumps in growth , so a combination of constrained output along with rapid monetary growth may signal inflation , if velocity of money follows an uptrend. However , just like the last bout of inflation in the 1970s an unexpected surge in inflation might come about as supply chains fray. The supply chains are concentrated and more fragile than ever before, for example the shutting down of one Tyson food plant had affected 4 to 5% of pork supply in the US.

The probability of highly fragile structures failing and leading to inflation cannot be downplayed and deserves a much important role in portfolios. As a trader remarked on CNBC that the bond market almost universally expects deflation which means there will be inflation.

The problem is if we see the worst possible outcome i.e STAGFLATION. The supply chains are going to be reshored, inventory buildup is no more going to be Just In Time but more long term and this will increase the use of working capital. I agree, the demand will take time to recover, but for STAGFLATION, you don’t require high demand but a reduction in supply.

I believe the outcome of COVID will be a STAGFLATION and don’t count on bond markets to tell you that because any signs of INFLATION/STAGFLATION will lead to capping of yield by central bankers.

In the chart above of US 10 year treasuries you can see that yields are now confined to a range. whether by design or market forces will determine the future performance of different assets.