A Return to Tiananmen, Part II: The Ending of Hong Kong

Peter Zeihan writes

Hong Kong is about to become an absolutely horrible place to be. The degree of Chinese… reconstruction of the island will be on par with the cultural genocide already being imposed upon the Uyghurs of China’s western Xinjiang region. It won’t last a week or a month or a year. We’re looking at something that will last at least a decade.

That will have deep implications for anyone doing business in the country.

At a minimum every ongoing reservation about operating in China is about to get a hard underline. Foreign business magnates like Tim Cook have so far been able to ignore the ethical implications of their firms’ China dependency. It is difficult to see that continuing in light of what’s about to occur.

And it isn’t simply about ethics. Many of the financiers that make Hong Kong work are Chinese citizens. Whether Bank of America or whoever is willing to stay in a place where their workers disappear is… questionable. But it doesn’t end there. It’s not just Chinese citizens; the extradition law also applies to foreigners. These companies are used to working in China, so it’s not that the Chinese system is so scary that they can’t stomach the country. It’s that none of these companies have tried to operate in China during an active crackdown.

https://us11.campaign-archive.com/?u=de2bc41f8324e6955ef65e0c9&id=49b9610ebe

Charts That Matter-4th July

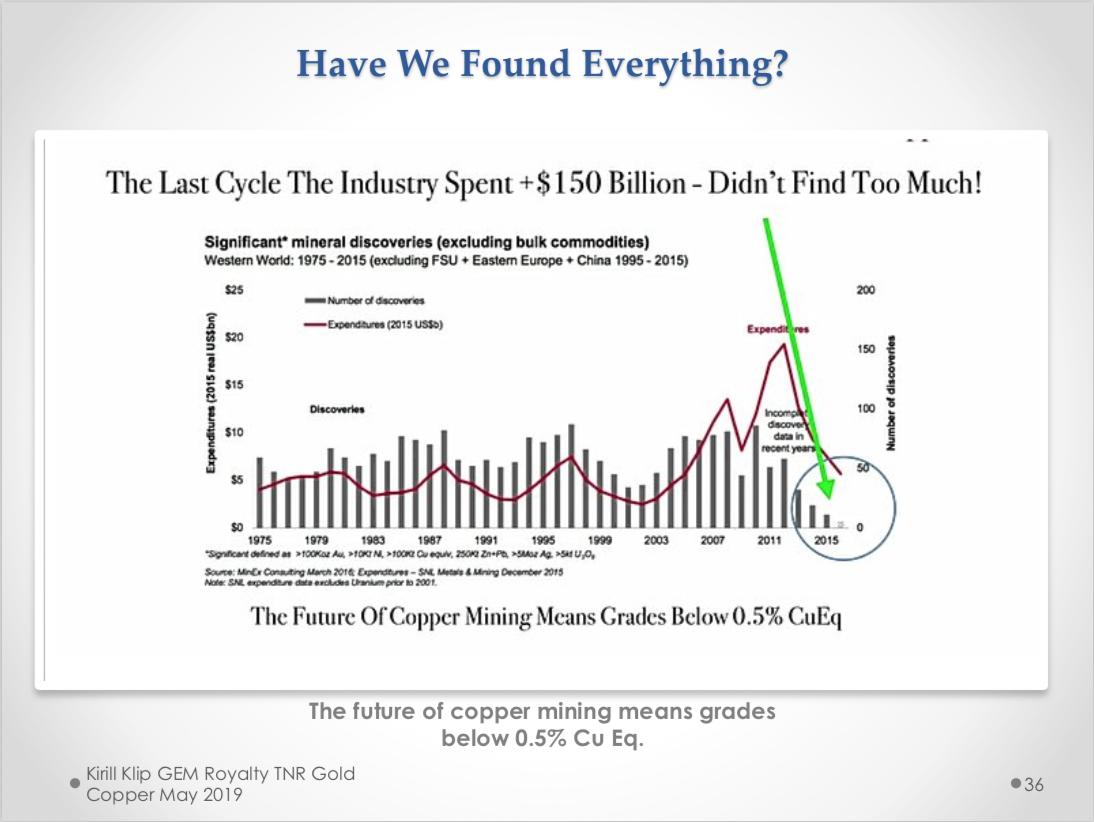
Copper Demand Set To Double In 20 years – The World’s Largest Operating Copper Mines Are More Than 75 Years Old.Conditions are ripe but wait for cycle to turn up for commodities.

Image

Anything left with a positive real yield in Europe is getting eaten up right now. Sovereigns don’t offer much and if you want to take on corporate credit risk? This is the yield you’re getting on the BBG Barclays Euro Aggregate Index.

Image

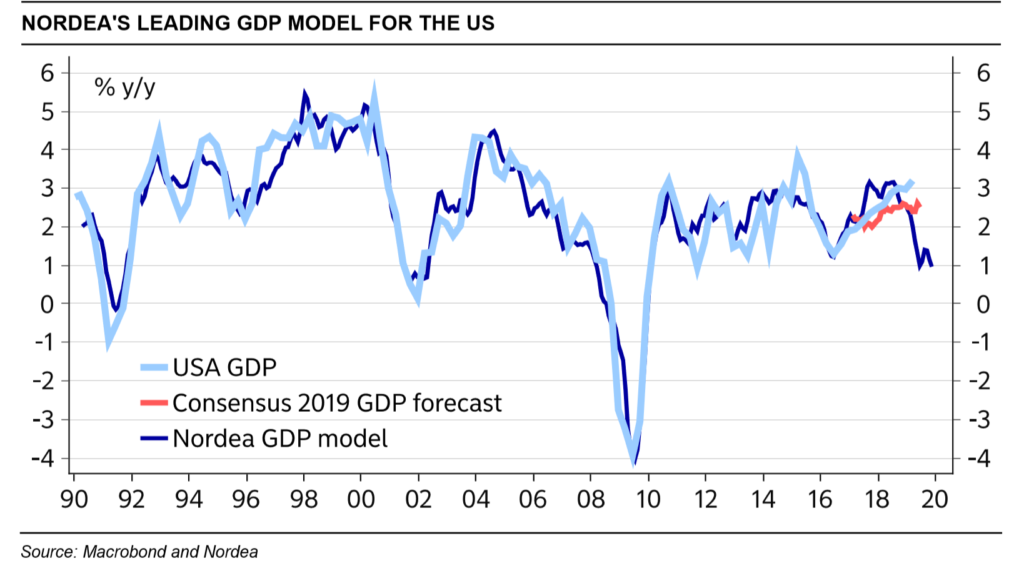
Nordea GDP model points to 1% GDP growth for US, which indicates that negative macro surprises should move to the US.

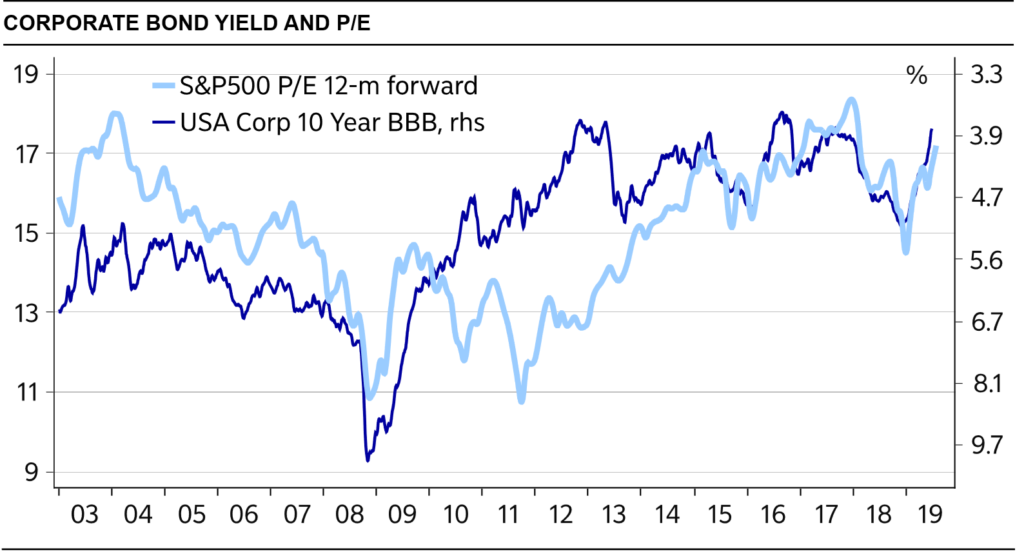
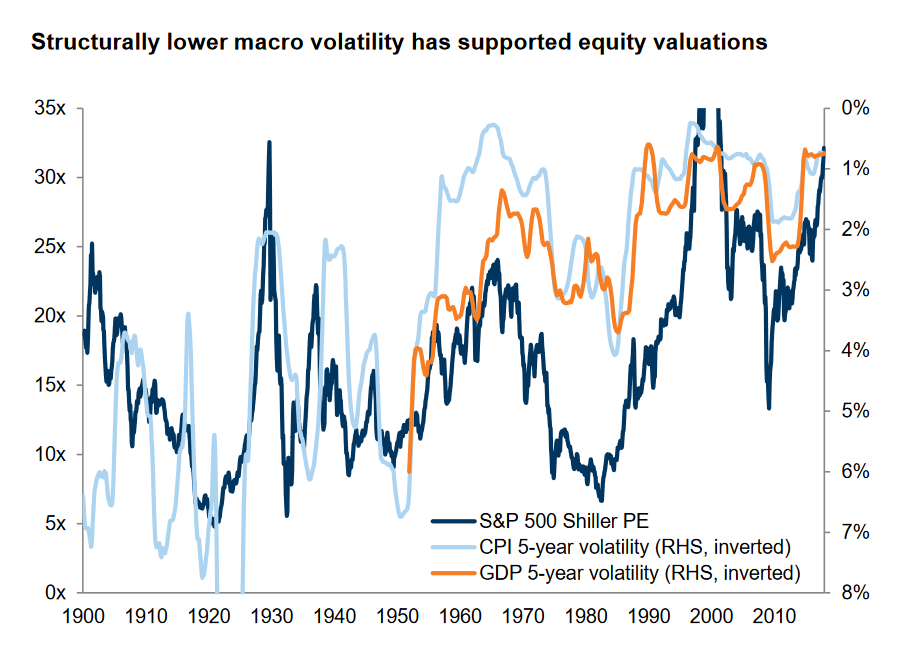
Why equities keep on rising ? Because Falling bond yields have triggered a renewed push higher for P/Es. Can the P/E continue to rise to infinity? The answer is NO…. look at German and Japan P/E levels, they are lower than US

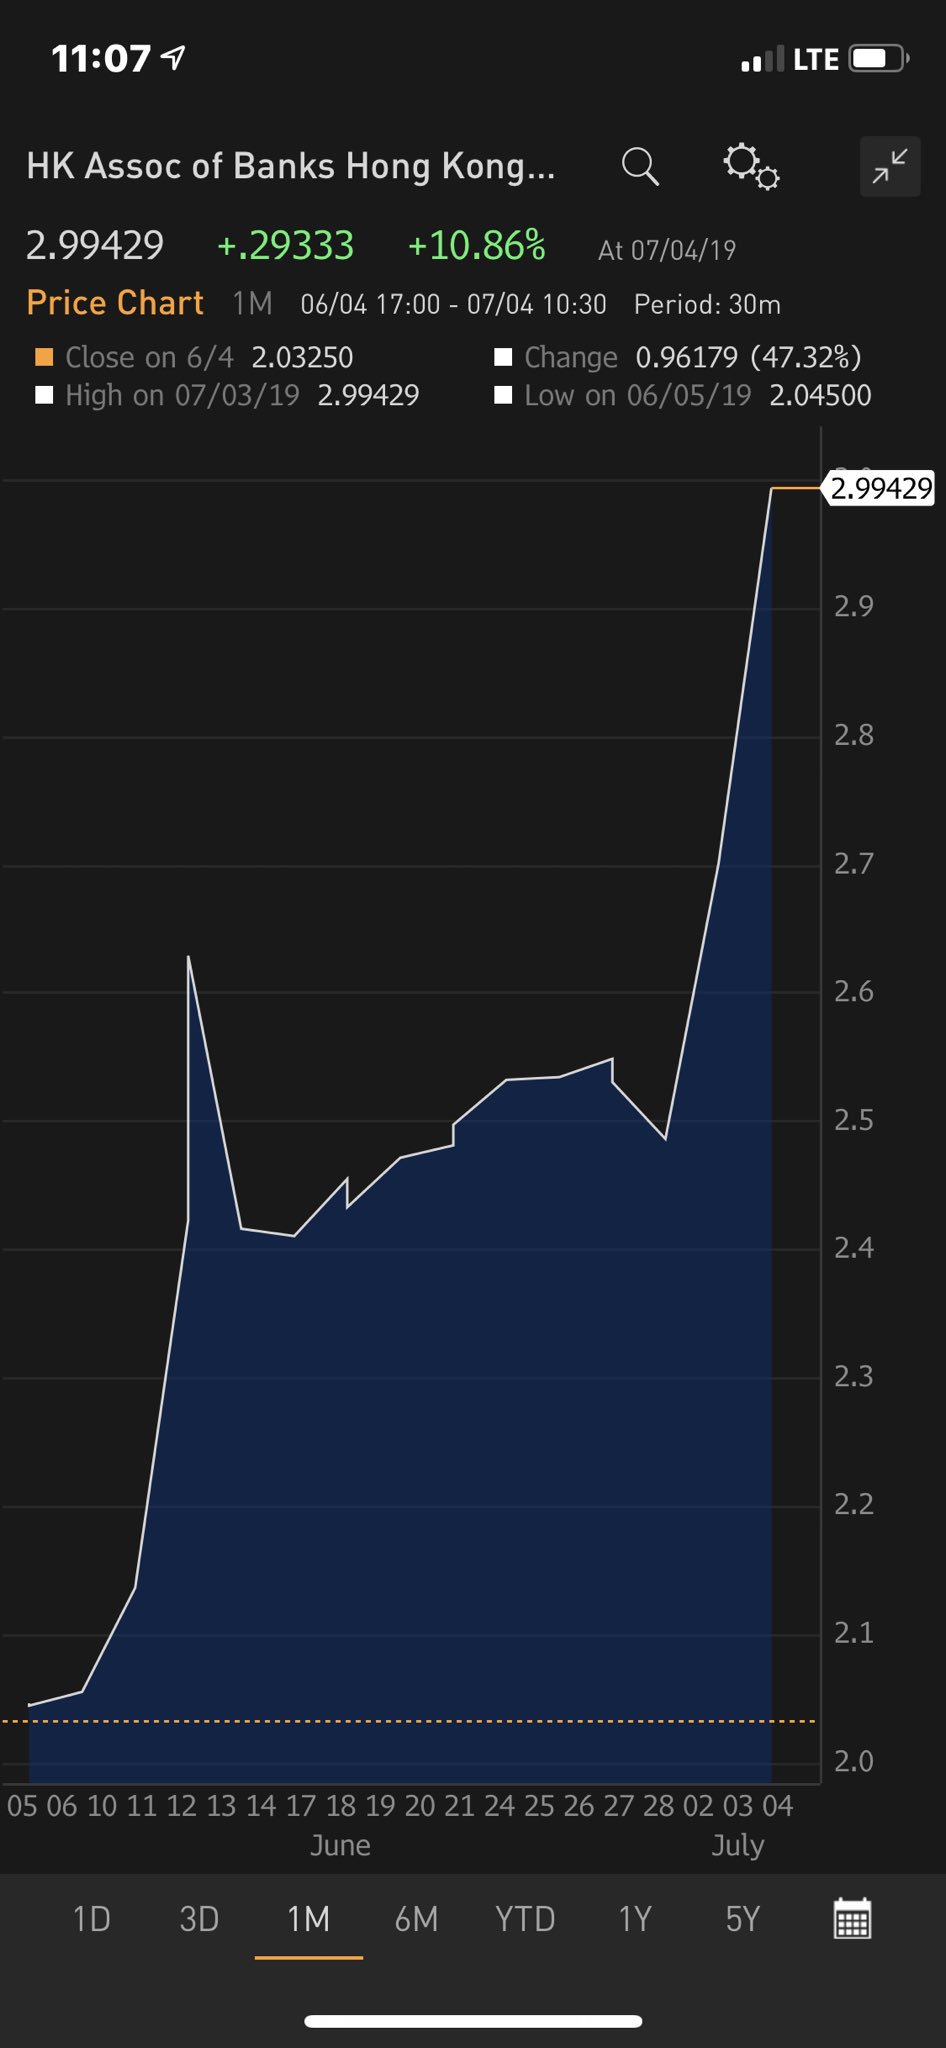
Hong Kong currency market coming unhinged. HK interbank lending rate skyrocketing (up 30bps tonight alone!) as money evacuates the system. M1 and M2 collapsing…happens every time before the system snaps. (Kyle Bass)

Image

Nordea View -July 2019: Summer update

Macro data surprises have remained negative compared to consensus estimates, in line with our longstanding scenario, but equity markets have disregarded this and seem to be driven by a blind trust in central bankers’ abilities to turn the trend around before a more severe earnings recession takes hold. Falling bond yields have also renewed the push for higher valuation multiples, hence profit neutral valuations are back at multi-year highs. Falling interest rates have challenged our value bias and triggered a further valuation divergence between the expensive and cheap ends of the equity market. We still believe there will be a marked earnings recession and view analysts‘ V-shaped earnings expectations into 2020 as very unlikely. There is a risk, however, that central bankers could manage to create a larger asset bubble before a more severe crash takes place in some distant future, but we see too many dark clouds on the horizon in the short term to dare play that scenario.
Macro strategy: Bubble or trouble? Our models, particularly for the US, point to much lower growth than consensus expects, as well as rising wage costs, which should trigger a marked earnings recession. How have previous Fed easing cycles played out for equities in such a scenario? In four of five cycles, equities have performed well from one month before the first cut up to one month after. In all easing cycles, the S&P 500 has at some point been higher within twelve months than the day before the first cut. In the medium term, two easing cycles have appeared hand in hand with bull markets and three have accompanied bear markets. The difference seems to depend on the presence of a marked earnings recession or not. It has not been enough that the Fed has eased to get an all-clear for equities. We still expect global manufacturing to improve in 2020, but the number of detrimental trends in the fundamentals still bothers us in risk/reward terms, and represent a warning signal in our view.

Equities: Valuation and estimate risks remain We see a clear risk that we will enter an earnings recession and that analysts have not moderated expectations enough on top lines and profitability estimates. Long-term tailwinds for profit margins are gradually disappearing and in some areas turning to headwinds. With valuation levels on profit-neutral multiples once again approaching new highs, we doubt that the market will withstand the estimate cuts that we foresee. Given that we remain confident in our macro outlook and that believe earnings estimates will need to come down for 2019-20, we find support for our defensive positioning. Where we could go wrong could be an underestimation of market participants’ willingness to push the expected return even lower (in other words, buoying valuations even higher). We are very reluctant, however, to recommend playing such a scenario.
Equity styles: Double down on value With interest rates falling and central banks turning more dovish, some wonder if we should abandon our value bias and accept that valuations do not matter in a low interest rate environment. We do not accept this view and advise doubling down on the value factor. First, the valuation discrepancy between the cheap and the expensive end of the market is unprecedented. Second, slower global growth in a low cost-of-capital environment should theoretically reduce valuation differences, not increase them. Third, we can demonstrate that expensive stocks tend to struggle as uncertainty rises (eg the VIX index). Finally, the cheap end of the equity market has become so much smaller given its abysmal relative performance of late that a much smaller capital allocation to the style is enough to turn the tide. For those not daring to take the full value plunge, we advise combining value with solid quality and cash-conversion traits

read full report below

https://e-markets.nordea.com/api/research/attachment/89430

Charts That Matter-3rd July

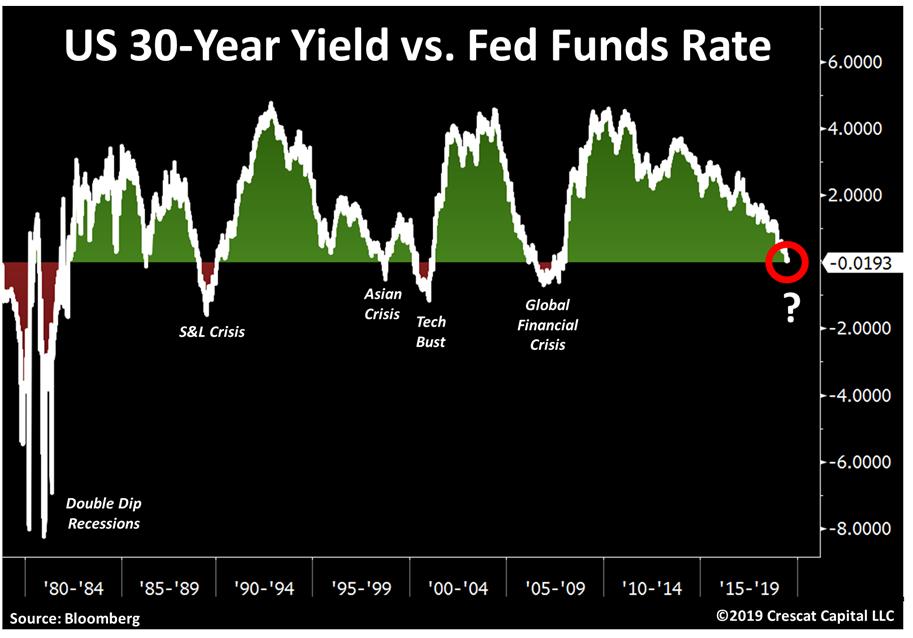
It’s official. US 30-year yield just inverted vs. the Fed funds rate! Same warning ahead of the GFC, tech bust, Asian crisis, S&L crisis, and 1980’s double dip recessions. The only false signal, 1986. (Tavi Costa)

We now have the entire US Treasury curve below the Fed overnight rate.

Image

As world trade goes, so goes EM…( Variant Perception)

Image


Challenger Job Cuts Add a Support Pillar to Gold Foundation — Steadily increasing Challenger job-cut announcements support expectations for Federal Reserve easing, pressuring the dollar and adding support to appreciating gold prices.

Image

Lowflation has given a boost to valuations across assets

Lowflation has given a boost to valuations across assets

Market overview- June 2019 and outlook

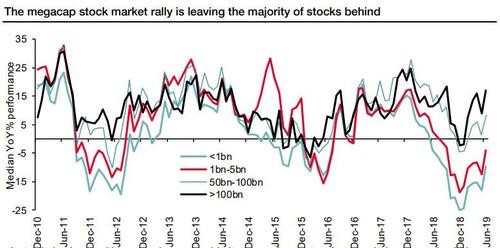
As trade wars threatened to derail global economic growth, major central banks suggested they were ready to provide support in the form of lower rates. Markets rallied early in June as the US Federal Reserve (Fed) President Jerome Powell, said he stood “ready to act” and the official Fed meeting later in the month showed he had plenty of support for that notion, with half of the Federal Open Market Committee (FOMC) members suggesting the most appropriate path forward was for lower US interest rates. Most equity markets closed higher in June, pushing them back into positive territory for 2Q19. Developed markets outperformed emerging markets for the fifth consecutive month. The chart below  shows that Mega caps have been a key driver of global markets for the last few years

but, during June, US regulators announced a plan to investigate anti-competitive conduct among large tech companies . Most of this Mega Cap grouping saw their share prices fall by high-single-digits on the news. I think that we need to take this development seriously and believe that we might be ending years of outperformance by FAANG.

It was strange to hear Dovish central bank talk especially from US which is seeing all time high equity markets, loose financial conditions and low Unemployment. Mario Draghi continues to believe in the monetary stimulus as the panacea for  stagnating European economy. US 10-year bond yields dropped further, briefly edging below 2% during the month, the first time 10-year rates have breached this level since before US President Donald Trump’s election in November 2016. Interest rate markets are now pricing in expectations for almost three US rate cuts by year-end.

Commodity markets generally were subdued, though falling interest rates helped drive the price of gold up 8% during the month (the highest level it has been since 2013) and agricultural commodities showing some signs of life. The US dollar was weaker against most currencies in June.

Market outlook

I believe that both Equities and Bonds markets globally are headed for a steep reversal but it will not happen unless one of the following conditions are met

  1. Rise in Junk bond spread
  2. Resurgence of Inflation

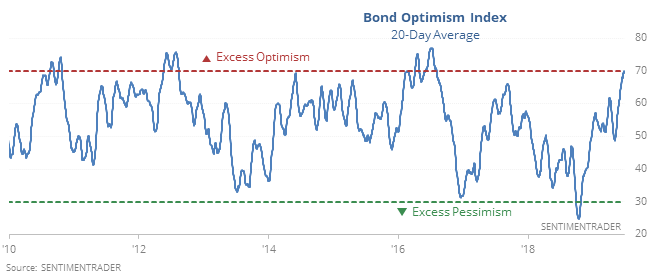
And if I were to pick one asset which is more overvalued between Equities and Bonds, then it is Bonds. USD 12 trillion of Global bonds are now negative yielding and the investor positioning is very optimistic. Infact the bond markets are so overstretched that a 1% rise on global bond yields could wipe out usd 2.4 trillion in market value (Barclays bond fund index).

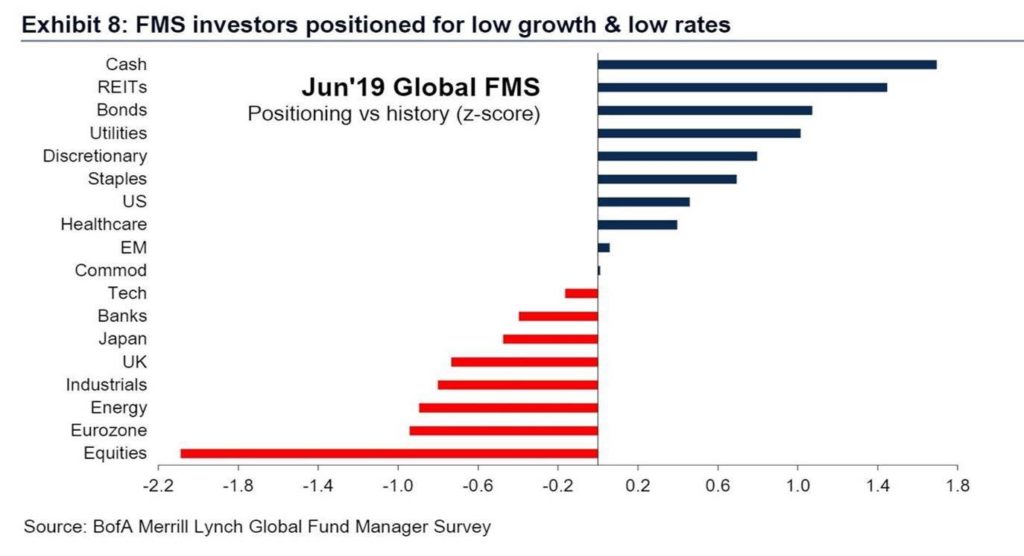
So, Bonds are the canary in the coal mine and I will watch out for volatility in bond markets rising due to any of the factors listed above. Although,We can easily see S&P rising above 3000 in short term as equity market is still defensively positioned as evidenced in this BOFA chart.

There is now more evidence that we are indeed headed for rise in soft commodities over next few months. Agri commodities have remained subdued for so long time that markets are taking their own time to price in the following planting data out of US and not to mention the continued crop infestation in china, Australia announcing the wheat import tender due to drought and the icing on the cake ” African swine flu” which is killing pig herds across China, Vietnam etc

Conclusion

We are in a feedback loop and with the way it has worked in positive way, it will also work in negative way and unfortunately till then both equities and Bonds are tied to the hip. In the very near term it is blue sky for both equities and fixed income possibly getting ready for another leg up with FED’s help. Beyond that, I think we are headed for STAGFLATIONARY scare over coming months as higher agri commodities prices and tariff increases starts passing through the supply chain. This will in turn create a negative feedback loop with Bond yields rising and then feeding through lower equity prices coupled with higher market volatility. In Nutshell

Euphoria followed by “Brace for Impact”

The unintended fallout of reforms

By Akash Prakash

Measures taken to strengthen the financial system are partially responsible for the debt crisis

The Indian financial system is going through an unprecedented clean-up. From auditors and rating agencies to the banks and funds, everyone is tightening standards. In the long term, this is a very healthy development, as it ensures that meritocracy will triumph. No longer can one get away with managing the system, rely on name-based lending or keep kicking the can down the road. Every type of market participant is running scared, and trying to be extra careful. There is accountability for action and, even more importantly, non-action.

This continues a process that began with the implementation of the Insolvency and Bankruptcy code(IBC), where post the first large resolution, promoters realised the old ways were over and they could actually lose control of their companies. Debt has consequences. Too much of it in the company and you can lose control of your company. Too much of it at the promoter level and you can lose control of all assets. Even assets with no underlying stress. Debt has always been, at least globally, a double-edged sword. In India in the past, there was little downside to being over-leveraged. You could always manage to muddle along and everyone was willing to let the charade continue. This has changed.

Too much debt and the inability to service it now have harsh consequences. It is, therefore, no surprise that we are going through a deleveraging across Indian companies and promoter group balance sheets. The definition of what is an acceptable level of debt has changed from both the borrower and the lender’s perspective. Every bank we speak to mentions that going forward, all new projects will require more equity. This deleveraging or balance sheet recession is one of the unintended consequences of the IBC. Debt-equity ratios in the system will structurally come down. This is why the government will have to continue to front-load investments. In the midst of a balance sheet recession, the private sector will not invest. It does not matter how low the rates go. If you are intent on deleveraging, to reduce your own risk, you will not take on new debt. Cash flows will not be used for new projects, but to correct the debt-equity mix today. A reduction in rates by 100-200 basis points will not change your mind. Across corporate India, if you look at the top 50 business houses, almost everyone is in deleveraging mode.

This clean-up is very much required. Even though deleveraging is hurting growth today, it will eventually lead to a much more robust financial system. Standards and operating procedures across all market participants will only improve. Disclosures, ratings, audit notes will all improve and give greater confidence to the markets. We are strengthening the foundations. Strong, well-run companies will keep getting financially stronger and the weak will fade away. It should help productivity of capital for the entire system.

For the foreseeable future, the government will have to continue to do the heavy lifting on fixed asset investments. We will see in the Budget where the resources to make these investments come from. Policy-makers will hopefully take a gamble, cut taxes and bet on growth. Or alternatively give themselves more fiscal room. I genuinely hope we do not go back to the old model of increasing taxes on the same people/ products to raise the required resources. That would totally kill whatever little animal spirits are left.

A second unintended consequence came out of demonetisation. Post demonetisation, we saw a surge of liquidity flowing into both banks and debt mutual funds. The surge of flows into debt funds, supercharged our corporate debt markets, in terms of both complexity and scale. Suddenly, Non-banking Finance Companies (NBFCs) and Housing Finance Companies (HFCs) could raise large chunks of money and for long tenures. This enhanced access to funds, and combined with the absence of the public sector banks raised the growth profile of all the NBFC/HFC players. With higher growth, their valuation multiples expanded, and the treadmill began. To maintain their multiples, they had to keep showing fast growth, and to show fast growth, they had to raise even larger sums of money from these same debt markets. To show profitability, compromises in ALM (asset liability matching) were made. Post the IL&FS default, flows into debt funds have slowed and risk aversion has increased. Many of the NBFC/HFC cannot sustain these levels of borrowings in a more risk-off environment. They need better matching of assets and liabilities. Their growth ambitions have to be reined in. Beyond a certain size, the conventional wisdom remains that NBFC/ HFC will need access to retail liabilities. This has not changed.

With so much money flowing into debt funds, and rates falling across the system, we also saw a reach for yield on the part of the funds. These funds are sold largely on peer group comparisons, hence being able to offer a higher yield, immediately leads to incremental flows. Many deployed capital into higher risk (structured obligation) paper, based on promoter comfort letters, or backed by shares. Even holding companies and unlisted entities were able to access significant funds. In the search for yield, more risk was taken. Keep in mind these debt funds, unlike the banks, do not have elaborate credit departments. They rely solely on the ratings. As long as it was rated investment grade, it could be bought. It did not matter if it was promoter funding, or the only security was a comfort letter, or the entity had no underlying cash flows, the rating was paramount. In today’s risk-averse environment, all this is changing. Debt funds are now far more cautious, their investors even more so. Most of these type of “special situations”paper will have no roll-over. No roll-over further accentuates the need for deleveraging among the promoter groups.

This again is normal behaviour as the market grows and matures. We will have a burst of growth, new instruments, innovative structures etc. A credit event happens, risk appetite dissipates and some of the more funky lending stops. This is normal in the maturity cycle of any asset class. Our corporate debt and structured credit markets are maturing. Eventually, all the participants will learn and make these markets more robust. In the interim, as these markets will get reined in, some of the more adventurous borrowers and lenders will suffer, but this is not a systemic risk.

Our debt markets are going through a much-needed pause. To catch their breath — so to speak. We ultimately need robust and innovative corporate debt and structured credit markets. It is important that policy-makers do not overreact to this inevitable shake-out of our debt markets. We should not overregulate them and kill all risk appetite and innovation.

There is tremendous fear and uncertainty today. Skeletons are coming out of the closet. This too will end. We will ultimately have a far healthier and more disciplined financial system. Stronger companies and more ethical business practices will prevail.

The writer is with Amansa Capital

The original article was published in Business standard

https://www.business-standard.com/article/opinion/the-unintended-fallout-of-reforms-119070200046_1.html

History Rhymes

June 25 – New York Times (Jeanna Smialek): “Jerome H. Powell, chairman of the Federal Reserve, said… that the central bank is weighing whether an interest-rate cut will be needed as trade risks stir economic uncertainty and inflation lags. But he made clear that the institution considers itself independent from the White House and President Trump, who continues to push publicly for a rate cut. Mr. Powell said the case for a rate cut has strengthened somewhat given that economic ‘crosscurrents have re-emerged, with apparent progress on trade turning to greater uncertainty and with incoming data raising renewed concerns about the strength of the global economy.’ But he stopped short of saying a cut was guaranteed, noting that the Fed would continue to watch economic events unfold and would avoid reacting to short-term issues.”

June 24 – Bloomberg (Christopher Condon and Rich Miller): “Federal Reserve Bank of Dallas President Robert Kaplan… sounded a note of caution about cutting interest rates. ‘I am concerned that adding monetary stimulus, at this juncture, would contribute to a build-up of excesses and imbalances in the economy which may ultimately prove to be difficult and painful to manage,’ Kaplan wrote in an essay released by the Dallas Fed.”

June 28 – Bloomberg (Craig Torres and Michael McKee): “It’s too early to know whether policy makers should cut interest rates and whether such a reduction should be a quarter or half percentage point, Federal Reserve Bank of San Francisco President Mary Daly said…”

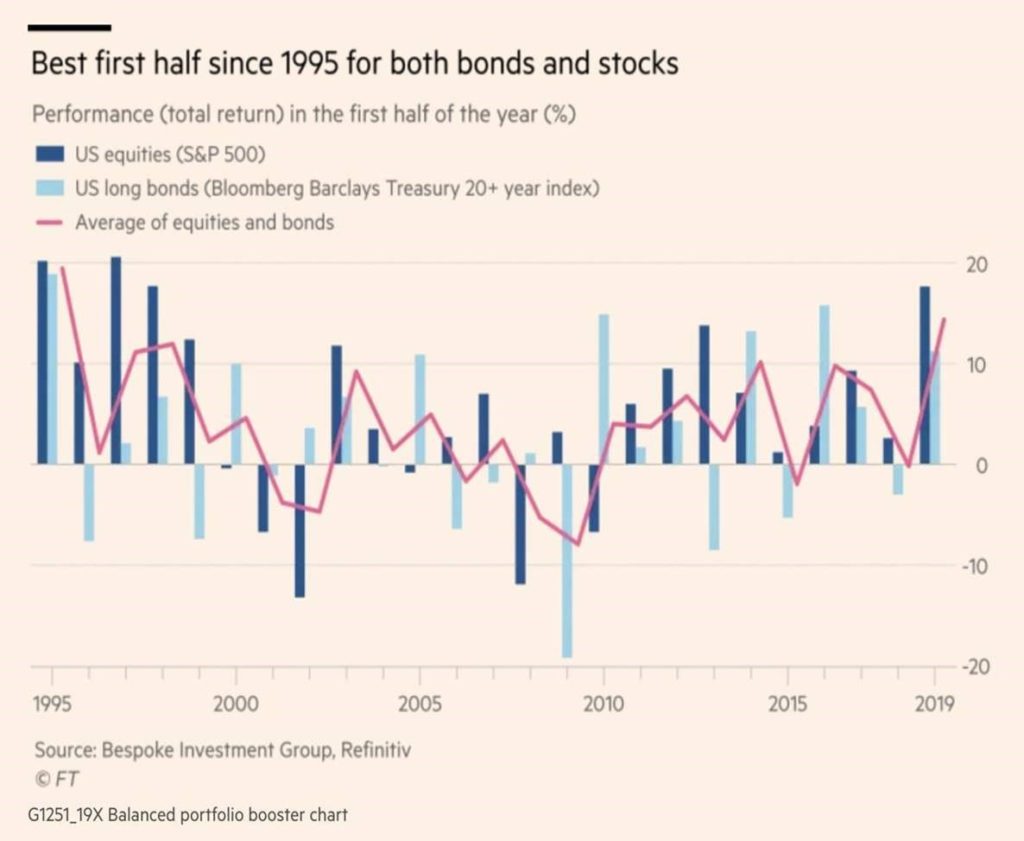
It would be one rather atypical backdrop for commencing monetary stimulus. Fox Business: “Dow Celebrates Best June in 81 years, S&P Best in 64 Years.” USAToday: “Stocks Post Best 1st Half Since 1997.” Newsmax: “Wall Street Soars 18%, Global Stocks Surge $18T in 1st Half.”

Bloomberg headline (Gowri Gurumurthy): “Junk Sales Hit 21-Month High as Issuers Lock in Lower Rates.” Junk issuance jumped to $28 billion in June, following May’s $26 billion. Year-to-date issuance of $130 billion is running 18% above comparable 2018.

June 28 – Bloomberg (Drew Singer and Vildana Hajric): “For anyone who was anxious that U.S. investors would be bowled over in 2019 by the biggest crush of new listings in more than a decade, some news. You were wrong. So far. Not only has one deal after another surged after pricing, but the market itself has shown no ill effects with billions of dollars of new equity sloshing around. In June alone, as the S&P 500 surged to records, 10 initial public offerings rose by 50% or more in their debut sessions, the most of any month since at least 2008. The average return of 37% is double gains earlier in the year. ‘We’re partying like it’s 1999,’ said Kim Forrest, chief investment officer at Bokeh Capital Management… ‘We’re bringing new companies to the public that we either use or we want to own.’”

According to Axios (using Baker McKenzie data): A total of 62 initial public offerings raised $25 billion during the second quarter, the strongest pace in five years. “Average IPO returns were 30% as Beyond Meat and the tech sector took flight.”

June 25 – Bloomberg (Vildana Hajric and Carolina Wilson): “As the risk of an economic slowdown lingers, exchange-traded fund investors are seeking shelter in bond funds. They’ve poured about $72 billion into fixed-income ETFs this year through June 24, with the funds on track for their biggest first-half inflows ever… Those bets have also fueled assets in the debt strategies to hit an all-time high of nearly $741 billion.”

It requires some creativity on the Fed’s part to justify additional monetary stimulus based on domestic conditions (I know, “inflation below target.”). Yet this is much more about global fragility than the U.S. economy. A positive outcome in Osaka would be constructive for sentiment from China to the U.S. Why then do global sovereign yields seem to look past the G20 (while equities can’t seem to shake the giddies)? Why would 10-year Treasury yields end the week down another five bps to (a near 30-month low) 2.00% – in the face of some Fed pushback on imminent rate cuts? How about German bund yields down four bps to a record low negative 0.33%. Swiss yields down to negative 0.58%, and Japanese 10-year yields at negative 0.16%? French 10-year yields turn negative (0.005%) for the first time, with Spanish yields down to only 0.40%.

Why do bond markets at home and abroad have about zero fear of a Trump/Xi agreement with positive ramifications for risk market sentiment and economic prospects (with, seemingly, receding central bank dovishness)? Because, I would posit, the collapse of bond yields is chiefly about unfolding global financial fragilities rather than trade disputes and slower growth. More specifically, faltering Chinese Bubbles significantly raise the likelihood of the type of global de-risking/deleveraging dynamic that would wreak havoc on securities and derivatives markets across the globe.

There are key elements of the current environment reminiscent of 2007. Recall that after the initial subprime scare that pushed the S&P500 down to 1,370 in mid-August, the index then rallied back to post a record high 1,576 on October 11th. After a weak November, the S&P500 ended 2007 at 1,475 (returning 5.6% for 2007). Meanwhile, the bond market was having none of it. After trading to 5.30% in mid-June, yields sank 127 bps by year-end (on the way to March’s 3.31% low) despite the widely held view the inconsequential subprime issue was to be quickly relegated to the dustbin of history.

These are two distinct Bubbles – the U.S. “mortgage finance Bubble” and the “global government finance Bubble.” Bond yields collapsed in 2007 in response to an unsustainable financial structure. There were Trillions of mispriced mortgage securities and derivative contracts that, because of egregious late-cycle excesses, were acutely vulnerable to any tightening of finance. Moreover, large quantities of mispriced securities were held on leverage.

“Crazy” end-of-cycle lending, risk intermediation, and speculative excesses became increasingly untenable. The more sophisticated market operators started to reduce exposure to the most suspect instruments. Subprime securities began to lose market value, and the marketplace turned increasingly illiquid. Credit conditions for the marginal (subprime) home buyer tightened significantly, which set in motion deflating home prices, pressure on higher-tier mortgage securities (i.e. “alt A”) and a more systemic tightening of mortgage Credit. What started at the “Periphery” gravitated to the “Core,” with Trillions of mispriced securities, speculative leverage, and ill-conceived derivatives coming under heightened pressure.

Even in the face of the subprime dislocation, the view held that “Washington will never allow a housing bust.” Indeed, the implicit government guarantee of GSE securities was more crucial than ever heading right into the crisis. Agency Securities actually increased a record $905 billion in 2007 (to $7.398 TN), perceived money-like Credit instrumental in sustaining “Terminal Phase” excess.

U.S. Non-Financial Debt expanded $2.478 TN in 2007, accelerating from 2006’s $2.432 TN and 2005’s $2.246 TN. The Credit Bubble was sustained by the combination of market confidence in the implicit federal guarantee of Agency Securities along with prospects for aggressive Federal Reserve stimulus (the Fed cut 50bps in September ’07 and another 25 bps in October and December), along with sinking market yields and lower prime mortgage borrowing costs.

This is where it gets interesting. Rapid Credit growth throughout 2007 underpinned stock prices, general consumer confidence and overall economic activity. Nominal GDP expanded at a 5% rate during 2007’s first half, 4.3% in Q3 and 4.1% during Q4.

Meanwhile, bond yields completely detached from equities and traditional fundamental factors. Why were yields collapsing in the face of booming Credit growth and inflating risk markets? Because the preservation of “Terminal Phase” excess was fomenting a late-cycle parabolic rise in systemic risk: inflating quantities of increasingly risky Credit instruments, dysfunctional risk intermediation, destabilizing market speculation, and extreme late-cycle imbalances/maladjustment. Stated somewhat differently: efforts to sustain the boom were exacerbating structural impairment. The bond market discerned an increasingly untenable situation.

History Rhymes. China’s Aggregate Financing (approx. non-government system Credit growth) jumped $1.60 TN during 2019’s first five months, 31% ahead of comparable 2018 Credit growth. So far this year, Aggregate Financing is expanding at better than 12% annualized. This is a rate of growth sufficient to sustain the economic Bubble (Beijing’s 6.5% growth target), apartment prices, corporate profits, stock prices and general market and economic confidence.

But extending the “Terminal Phase” has ensured a historic parabolic surge in systemic risk. Consumer (chiefly mortgage) borrowings have increased 17.2% over the past year (40% in two years!). Thousands of uneconomic businesses continue to pile on debt. Unprecedented over- and mal-investment runs unabated. Millions more apartments are constructed. The bloated Chinese banking system continues to inflate with loans of rapidly deteriorating quality.

Global risk markets have been conditioned for faith both in Beijing’s endless capacity to sustain the boom and global central bankers’ determination to maintain system liquidity and economic expansion. So long as Chinese Credit keeps flowing at double-digit rates, inflating perceived wealth ensures Chinese spending and finance continue to buoy vulnerable emerging market booms and the global economy more generally. Global risk markets remain more than content.

At this stage, however, global bonds have adopted an altogether different focus: China’s financial and economic structures are untenable. Sustaining rapid Credit growth is increasingly fraught with peril. With market players now questioning Beijing’s implicit guarantee for smaller and mid-sized banks and financial institutions, financial conditions are in the process of tightening at the financial system’s “Periphery.” And tightened Credit conditions have begun to reverberate in the real economy.

And what about the possible impact of a positive G20 and momentum toward a U.S./China trade deal? Stocks, no surprise, are readily excitable. For global safe haven bonds, however, it’s of little consequence. How can this be? Because even a trade deal would at this point have minimal impact on what has become deep and rapidly worsening structural impairment. Trade deal or not, Chinese exports to the U.S. will decline, right along with capital investment. Even with a deal, the Chinese financial system faces the consequences of years of rapid expansion, as economic prospects deteriorate. Sure, 6% growth as far as the eye can see. This implies a further surge in consumer debt and even more dangerous mortgage finance and apartment Bubbles. Unparalleled overcapacity and maladjustment.

Record U.S. stock prices in October 2007 made it easy to dismiss the momentous ramifications associated with subprime borrowers (the “Periphery”) losing access to cheap Credit – to disregard the blow-up of two Bear Stearns structured Credit funds, widening Credit spreads, pockets of market illiquidity, and waning confidence in some sophisticated derivative structures. Acute monetary instability (i.e. equities and $140 crude) was mistaken for resilient bull markets.

I would closely monitor unfolding developments in Chinese Credit – funding issues for small and mid-sized banks; ructions in the money markets; trust issues with repo collateral, inter-banking lending, and counterparties; vulnerabilities in local government financing vehicles (LGFV); heightened concerns for speculative leverage; and the overarching issue of the implicit Beijing guarantee for essentially the entire Chinese financial system. The overarching issue is one of prospective losses of monumental dimensions. These losses will have to be shared in the marketplace. As much as global markets bank on Beijing bankrolling China’s entire financial apparatus, the Chinese government will not welcome the prospect of bankrupting itself.

The solution, of course, is for China to simply inflate its way out of debt trouble – just like everyone else. What an incredibly dangerous myth the world fully bought into. Reflation – in the U.S., China, Europe, Japan and globally – has only inflated the size and scope of Bubbles. China could see $4 TN of new Credit this year – debt of increasingly suspect quality. Such reckless Credit excess is placing the Chinese currency at great risk. It took about 18 months from the initial U.S. subprime blowup to full-fledged financial crisis. While one could certainly argue for earlier (i.e. December), China’s crisis clock began ticking no later than with last month’s takeover of Baoshang Bank.

June 27 – Bloomberg: “Almost five weeks after Chinese officials shocked investors by taking over a regional bank, smaller lenders are still struggling with the consequences. Demand for their debt is tumbling. Debt issuance by small banks this month has tanked to a 16-month low. The cost of borrowing is surging. Lenders paid record high premiums on negotiable certificates of deposits — a type of short-term debt that they rely heavily on for funding — relative to bigger peers. While the central bank has injected a net 325 billion yuan ($47bn) into the nation’s financial system last week and lifted the short-term debt quota for big brokerages to ease the crunch affecting smaller banks, the measures have failed to shift investor concerns. The fact that some of Baoshang Bank Co.’s creditors may face losses has driven financial institutions to reassess counterparty risks and become more selective in whom to lend to… ‘Some institutions are mulling making white and black lists for small banks and that will affect credit expansion of those banks,’ said Lv Pin, an analyst with Citic Securities.”

June 24 – Bloomberg: “Liquidity conditions for China’s lenders and its non-banking financial institutions are heading in different directions following the surprise seizure of a bank last month. A measure of cash in the interbank system fell to its lowest close since 2009 on Monday, as the central bank has been providing liquidity to the market to ease concern over credit risks at small and medium-sized banks. That’s just as financial firms like insurers continue to face financing difficulties almost a month after the government takeover of Baoshang Bank Co. The People’s Bank of China injected a net 285 billion yuan ($41.5bn) of funds via open market operations last week, the most since late May. The problem is injections like these have not benefited non-banking firms that rely on corporate debt for funding because bond traders are still worried about counterparty risks. ‘Non-bank financial institutions have been having more difficulty in acquiring capital via negotiable certificates of deposit,’ said Ken Cheung, a senior Asian currency strategist at Mizuho Bank Ltd. ‘Large banks are less heavily affected.’ China’s overnight and seven-day pledged repurchase rates for the overall market rose to as high as 8% and 18.3% on Monday…Those prices indicate what non-bank financial institutions could be paying to get funding. The same rates for lenders were at 0.99% and 2.27%.”

June 26 – Bloomberg: “Investors in China’s local government financing vehicle bonds — the market’s hottest trade earlier this year — have a new risk to consider. At least that’s what yields are signaling, a month after the big jolt from the government’s Baoshang Bank Co. seizure. LGFV notes pay less than company debt because of the assumption that they carry an implied government guarantee, so they should have done relatively better in a risk-averse environment. Instead, borrowing costs for lower-rated LGFVs are rising while yields on corporate bonds are trending lower. It’s another example of the linkages between players in China’s financial system, not all of which are evident on the surface. As small banks struggle to access liquidity amid the Baoshang Bank fallout, that becomes a potential problem for their big borrowers — often weaker LGFVs. ‘As the risk appetite in the market has become quite low, lower rated LGFVs will have difficulties in refinancing and they will come under bigger pressure to repay debt,’ said Liu Yu, a fixed-income analyst with Guosheng Securities Co. ‘The risk of lower rated LGFVs is increasing and some may default on their borrowing through non-standard financing channels.’”

June 25 – Financial Times (Don Weinland and Sherry Fei Ju): “A rare public default at a Chinese trust company is drawing attention to cracks in the Rmb7.9tn ($1.13tn) market for the investment products in the country, where similar failures have been dealt with behind the scenes in the past. Anxin Trust, which missed payments on Rmb11.8bn for 25 trust products earlier this year, has been forced to publicly document its default because, unlike most trusts, it is listed on the Shanghai stock exchange. The situation has offered a rare glimpse into the factors leading up to failed trust products, which for Anxin include giving loans to an acquisitive property group that has since been delisted from a Chinese bourse. The trust company’s shares tumbled more than 9% on Tuesday after it said its parent company’s shares had been frozen by a court in Shanghai.”

June 24 – Bloomberg: “One of the most opaque areas of China’s credit markets involves the practice of companies buying their own bonds. That may soon get a lot tougher, contributing to financing difficulties that are already bedeviling the nation’s policy makers. At issue is a sharp increase in scrutiny by financial institutions of the collateral that their counterparties offer up in the repurchase market, a crucial channel for short-term funding. If the debt sold by issuers that indirectly purchased a portion of their own bonds — which could account for as much as 8% of China’s corporate bonds, according to Citic Securities Co. — is shunned, that will squeeze liquidity for a swathe of the nation’s businesses.”

June 26 – Financial Times (Don Weinland): “Chinese regulators are hitting the brakes on a record surge in US dollar bond sales by local government financing companies despite unprecedented demand for the debt. Local government financing vehicles, which have been used for years by Chinese cities and provinces to raise funds for local infrastructure projects, sold $12.4bn in US dollar bonds in the first half of the year, according to Dealogic, nearly doubling issuance from the same period last year. The boom in debt deals, however, is expected to come to an abrupt end on Friday, after which Chinese regulators are likely to impose stricter rules on the companies.”

http://creditbubblebulletin.blogspot.com/2019/06/weekly-commentary-history-rhymes.html
Dance of the living dead

Via Almost daily Grant

Globally, the stock of negative-yielding debt crossed a record $13 trillion on Thursday, according to data from Bloomberg. That represents 26% of global sovereign debt supply and 15.3% of nominal worldwide GDP for 2018. Stateside, the 10-year Treasury yield remains below 2%, down from 3.25% in November. 

In a New York Times opinion piece last Sunday, Ruchir Sharma, chief global strategist at Morgan Stanley, discussed the fallout from the incredible shrinking interest rates. Citing a report from the Bank for International Settlements, which found that 12% of publicly listed companies around the world can be described as zombie firms (meaning they don’t earn sufficient profits with which to cover their interest payments), Sharma concluded that simple policy miscalculations are on display:

Once the crisis hit, governments erected barriers to protect domestic companies. Central banks aggressively printed money to restore high growth. Instead, growth came back in a sluggish new form, as easy money propped up inefficient companies and gave big companies favorable access to cheap credit, encouraging them to grow even bigger.

Other academic studies lend credence to Sharma’s, and the BIS’s claims. On January 22, the National Bureau of Economic Research released a paper examining the effects of low interest rates on economic dynamism. Incumbents will like what they see:

A reduction in long-term interest rates tends to make market structure less competitive within an industry. The reason is that while both the leader and follower within an industry increase their investment in response to a reduction in interest rates, the increase in investment is always stronger for the leader. As a result, the gap between the leader and follower increases as interest rates decline, making an industry less competitive and more concentrated.

When interest rates are already low, this negative effect of lower industry competition tends to lower growth and overwhelms the traditional positive effect of lower rates on growth.  

In January 2017, the Organisation for Economic Co-operation and Development released Working Paper No. 1372, which reached a similar conclusion:

Evidence of a decline in productivity-enhancing reallocation is particularly significant in light of rising productivity dispersion, which would ordinarily imply stronger incentives for productive firms to aggressively expand and drive out less productive firms. 

Instead, the productivity gap between frontier and laggard firms has risen, even while the forces bringing dynamic adjustment are waning. This tension is a red flag that something is wrong with productivity, but also points to a potential deterioration of the exit margin [meaning fewer firms are going to corporate heaven].

E-Z money likewise helps bring the dead back to life. As noted by Marty Fridson, chief investment officer of Lehmann, Livian, Fridson Advisors, LLC, during the Spring 2014 Grant’s Conference, the 2008-2009 default cycle was anomalously brief: “We actually had the situation where the default rate went from a record level to below average the very next year. I would submit that is physically impossible, but it did actually happen.” 

Needless to say, the march lower in interest rates will help this encumbered group continue to walk the earth.  As compiled by Ben Breitholtz, data scientist at Arbor Research & Trading, LLC and noted in the March 8 edition of Grant’s, the proportion of zombie companies (defined here as those whose operating income fails to cover interest expense for three straight years) in the S&P 1500 Index rose to 13.6% at the end of January.  That’s up from 12.4% year-over-year and compared to less than 6% of that broad cohort in 1990. During that period, the yield on 10-year Treasury Inflation Protected Securities declined to less than 1% from more than 14%.  Breitholtz also spotted a key threshold for this undead cohort, telling Grant’s in March: “We noticed that the closer the 10-year real yield gets to 1%, there is a hypersensitivity for a lot of these overleveraged companies.” With the 10-year real yield now sitting below 20 basis points, the corporate undead continue to roam.

Charts That Matter-26th June

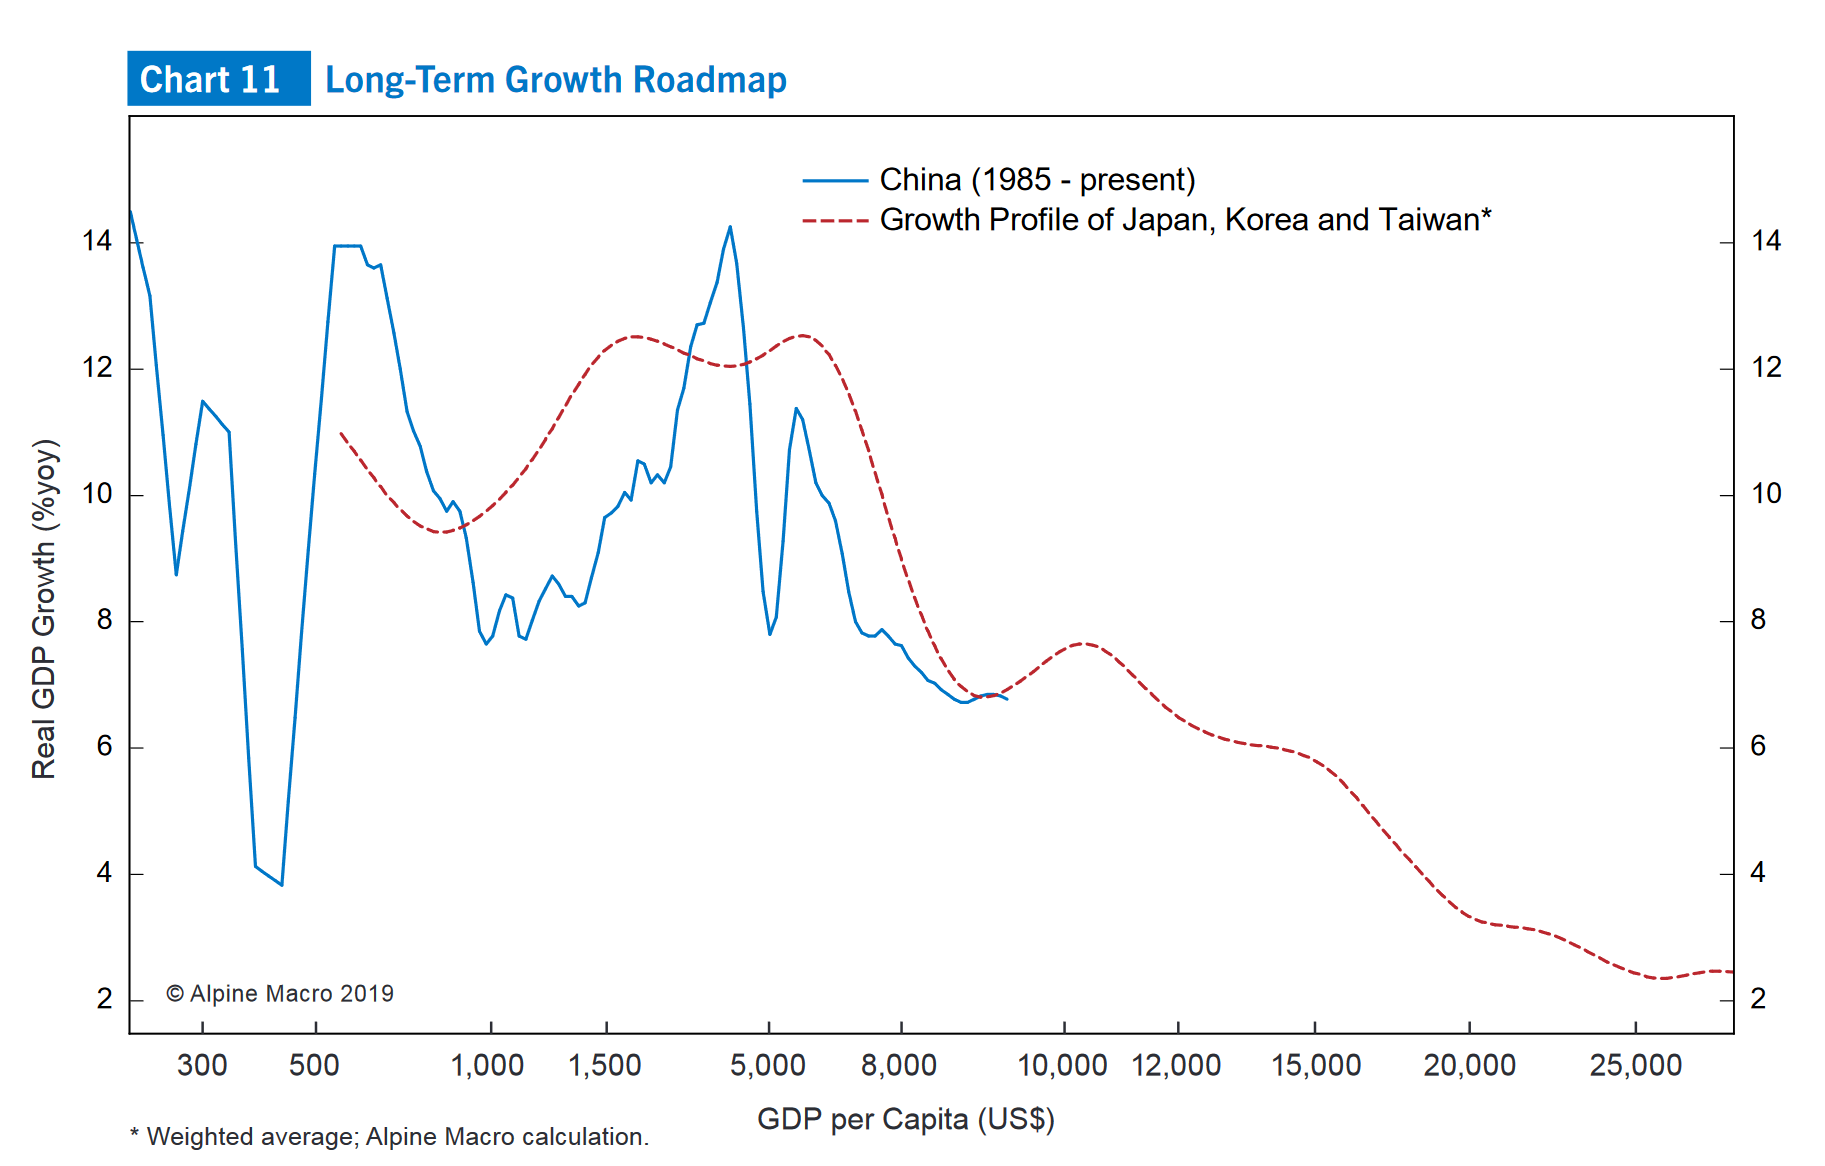
China long term growth path is following on footsteps of Japan and South Korea. Blow asset bubbles, take too much debt and there you have it….. the lost decade.

China Long Term Growth roadmap

US 2-year yield now on pace for dropping 8-weeks straight! Moves as such only happened 8 other times in history. All of them during bear markets or recessions. People tell me that it is different this time

There is a presumption that faster economic growth in emerging markets drive up corporate earnings as well. Look at the chart below and decide yourself.

Nathan Rothschild’s investment mantra was said to be “buy on the cannons, sell on the trumpets”. Apparently it works for EM investing. Buying during one of the periodic bad news frenzies yields outsized returns. @SteveJohnson000 https://www.ft.com/content/d6f18712-9365-11e9-aea1-2b1d33ac3271 …

The Kondrateiff seasons and India

By Rohit Srivastava

The idea to Measure and Map India’s economy along with the EW view was given to in 2003 but I decided that the time to do so would be a decade later. Rightly so I started the process in 2010 with the publication of the Economic Winter of India reports 3 completely detailed reports are online with the latest published in Dec 2018. i also write winter updates from time to time But let me get you up to speed quickly with what this is all about. The economic cycle was considered to have 4 seasons along an entire cycle from birth and back and then repeat. The use of seasons to describe a cycle is probably meant to highlight that the cycle goes on and on. The length was considered 50 years but it is not a fixed time it can be 70-80 years now based on the  life expectancy of mankind and other factors. It is therefore about the events that follow each other from one season to the next
Here is an analysis of India’s seasons and where we are within then.

The Kondrateiff seasons and India

Kf Spring – Spring represents the birth of an economy which for India would have started a little before or around Independence.
Spring is the bull market during which the economy grows on new found growth prospects to exploit all its resources. Interest rates start on a low base and trend higher as demand for money grows to fund growth. Prices of assets commodities and labor expand. For India the time up to 1990 would represent such a period. GDP compounded at 6% during this period.

Kf Summer – Summer is when the economy reaches full bloom. All resources are being exploited and the expansionary phase of the past
results in visible price inflation catching up with wages. To control it, interest rates move up substantially often slowing down the economy. By the end of Spring price inflation will eventually appear to have been controlled and interest rates can go lower again. 1994- 2001 represents such a period in India. 1966-1981 represents the same for the US. For those who have been following the market for the last decade you will remember how analysts were often comparing the 70’s Dow chart with the 90’s India chart to predict how the Dow then took off later and went up 10 fold over the next 20 years [during the Kf Autumn]. Well India went up 8 times since 2001 in 7 years. What I want to highlight is that in terms of the Kf cycle they were comparing the same state of markets [Kf summer]. The outcomes
therefore were also similar, but time wise one lasted much longer. There is a belief therefore that India’s bull market that started in 2001 is going to last for decades and we are seeing a temporary halt right now, however the size of the bull market is often ignored. Time was smaller in India because we quickly went from a closed to open economy and are doing a very fast catch up job with lost time. In terms of wave structure too if you see the chart above wave 3 was the longest however wave 1 was a small bull market relatively, and therefore wave 5 equals wave 1 in size and that is good enough. India’s debt to GDP was just over 50% by the end of the Summer].

Kf Autumn – The myth that inflation is under control is what kicks off the Autumn. This feeling of control allows for monetary action to start again. Note that this is the only time when lower interest rates are associated with rising asset prices. During spring interest rates start on a small base and expand slowly as the economy expands, demand for finance leads interest rates. During Autumn rates are lowered to kick start economic activity and the belief that prices can be kept under control allows for credit based bubbles to reach full scope. Falling rates push all asset prices up from equities bonds and real estate to possibly commodities and wages. As credit levels expand exponential nurturing debt with cheap finance is the essence of keeping the Autumn bubbles alive. But as discussed above they will eventually burst. 2001-2010 is the Autumn for India. In terms of credit 2010 appears like the right time of the cycle to end, though from a stock market perspective it can be debated whether the 5th wave based on Elliott waves ended in 2008 or 2010. It differs between Sensex and Nifty. India’s debt to GDP had crossed 135% and is now close to 140% This excludes items like NBFCs, non banking FDs, non banking corporate debt, derivatives markets and other lenders and borrowers. Bank credit and Govt debt along add up to close to 140%. If we put everything together it could shoot past 150%

Kf Winter – As always winter will come. The most painful period as bubbles burst causing economic upheavals and hardship. Fear and distrust force reduced lending activity despite lower interest rates. Quality debt is back in vogue. The process of unwinding of debt before another cycle starts can take from a few years to decades depending on the degree. The U.S. deflation from 1929-1949 took 15 years for debt, but stock markets bottomed in 1934, i.e. in 4 years. However a grand super cycle occurs when a 5 wave rally of one larger degree occurs. This means after 3 consecutive Kf waves in a country it completes a larger degree 5 wave rise lasting 210 years and will correct/consolidate for a longer period. In the U.S. 1720-1784 is shown as the Grand-Supercycle degree wave 2 by Robert Prechter in his book “Prechter’s Perspective”. That was 50-60 years of depression/consolidation. Since then US has been in a Grand supercycle degree wave 3 till year 2000. Wave 4 could potentially be as large in time. But for countries like India that are in their first Kf cycle since independence and things are not so bad. Yes I think India will see its own Kf winter, i.e. deflation or depression, however after 2-3 years once it completes a supercycle degree wave 2 correction, a larger degree supercycle wave 3 bull market lasting 70 years can emerge. This is when decoupling will happen for India and maybe China. The recent 2010 Indian budget has started talking about reducing the fiscal deficit and that is a deflationary trend signal. How debt gets reduced may vary from cycle to cycle. Bubbles can be pricked internally through tightening or externally through events not in our control.

Now that I have given enough perspective to the Kf cycle and where India is placed within it lets discuss the impact on India and the stock market. it is my belief that India will find it hard to escape the Kf winter that is likely to follow. As India was late to enter the Global Kf-Autumn, it will has taken time to enter the Kf winter. One of the reasons that India’s cycles are years apart from the west is that we were a closed economy but since the 80’s we started the process of opening up. In 1991 we jump started the process with reforms and have been catching up very fast with the world cycle. So while the Indian Summer occurred 10 years after the US summer ended, our winter is now starting 3 years later. 2010 shall mark the beginning of India’s Kf winter of deflation and depression as the external
environment starts to worsen. Attempts to finance its own fiscal deficit internally might stress the economy and attempts at price inflation will lead to dumping of goods by other nations or social revolt. Raising interest rates will lead to reduced lending and if we try diverting savings to finance the government the corporate sector will starve. So we are walking a tight rope which will break more due to external factors than domestic ones. Non financial problems like the one with our neighbors can also be a hidden trigger. Basically our high fiscal deficit and 160% debt/GDP is now exposed to various external risks that can stall further monetary expansion and thus force a period of deflation before we can start growth all over again.

India’s biggest strength that will eventually bring us out of this mess is our demographics. A young population is willing to take hard steps and suffer the pain needed to quickly move ahead. Ageing populations in the west and Japan prefer not to suffer pain and postpone it as far as possible which will make them take much longer.