Charts That Matter-30th Mar

The share of US adults reporting no SEX in the past year reached all time high in 2018.

‘Positioning is super short in VIX. A worrisome signal of (too) uniform market thinking… Short positioning in VIX is now more extreme than prior to Feb-18 and Oct-18 sell-offs in equities” . Nordea Markets

Mad world. While Stocks have gained $9tn in mkt cap, global bonds have gained a whopping $1.8tn in value in Q1 2019 as cheap money from the central banks have inflated all assets. Part of this crazy world is that bonds in a volume of $11tn have negative yields.

Commodities had their best quarter in 3yrs, driven by supply concerns and optimism over demand. In Q1, Bloomberg Commodity Index rose 6%, most since Q3 2016. Crude oil paced the advance, while nickel led gains in industrial metals. Soft commodities like coffee & wheat fared worst..Holger

Good Bad or Ugly?

Bespoke writes….Stocks have basically held the line this week despite huge moves in interest rates and an ongoing rough run for global economic data. The curve inversion has many forecasting a recession, and we’ve seen a number of recent data releases that make us much more nervous about that outcome than we have been in almost a decade. On the other hand, the pivot to dovishness from global central banks, the relatively modest size and scale of yield curve inversion, some nascent signs of bottoming in global growth, and the nature of the plunge in interest rates are all reasons to not panic. Besides, despite all of the negativity, US stocks have held up admirably well, and markets that trend higher on bad news are generally regarded as strong, rather than weak. In short, the outlook could be Good, Bad, or Ugly…depending how you read the tea leaves!

Everything Rally

Doug Noland writes……From the global Bubble perspective, it was one extraordinary quarter worthy of chronicling in some detail. The “Everything Rally,” indeed. Markets turned even more highly synchronized – across the globe and across asset classes. As the quarter progressed, it seemingly regressed into a contest of speculative excess between so-called “safe haven” sovereign debt and the Bubbling risk markets. It didn’t really matter – just buy (and lever) whatever central bankers want the marketplace to buy (and lever): financial assets.

March 29 – Bloomberg (Cameron Crise): “While the total return of the S&P 500 is going to end this month roughly 2% below its closing level in September, a 60/40 portfolio of equities and Treasuries is ending March at all-time highs. Even a broader multi-asset portfolio using an aggregate bond index rather than simply govvies is closer to its high watermark than stocks. Similar to equities, balanced portfolios have enjoyed a stunning quarterly return. The broad balanced portfolio mentioned above returned nearly 8%, its best since 2011.”

According to Bloomberg (Decile Gutscher and Eddie van der Walt), it was the best FIRST quarter for the S&P500 since 1998 (strongest individual quarter since Q3 2009); for WTI crude since 2002; for U.S. high-yield Credit since 2003; for emerging market dollar bonds since 2012; and for U.S. investment-grade Credit since 1995. According to the Wall Street Journal (Akane Otani), it was the first quarter that all 11 S&P500 sectors posted gains since 2014.

March 29 – Financial Times (Peter Wells, Michael Hunter and Alice Woodhouse): “Driven mostly by Wall Street, global stocks ruled off on their largest quarterly advance since 2010. The climb over the past three months was sealed on Friday on hopes for progress in US-China trade talks that resumed in Beijing, while a rally in sovereign bonds eased. The FTSE All World index has risen 11.4% so far in 2019, its biggest quarterly increase since the September quarter of 2010.”

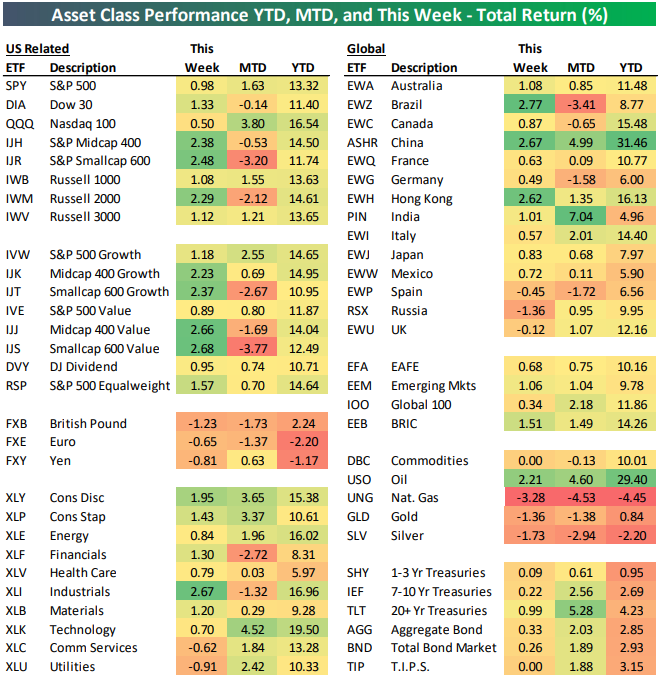
The S&P500 returned 13.6% for the quarter, a stunning reversal from Q4 – yet almost blasé compared to gains in “high beta”. The Nasdaq100 returned 16.6%. The Nasdaq Industrials rose 15.8%, the Nasdaq Computer Index 18.7%, and the Nasdaq Telecom Index 18.3%. The Semiconductors jumped 20.8%, and the Biotechs rose 21.5%. And let’s not forget Unicorn Fever. Money-losing Lyft now with a market-cap of $22.5 billion. Up north in Canada, equities were up 12.4% for the “best first quarter in 19 years.”

The broader U.S. market gave back some early-period outperformance but posted a big quarter all the same. The S&P400 Midcaps jumped 14.0% and the small cap Russell 2000 rose 14.2%. The average stock (Value Line Arithmetic) gained 14.3% during the quarter. The Bloomberg REITs index rose 15.8%, and the Philadelphia Oil Services Sector Index jumped 17.5%. The Goldman Sachs Most Short Index gained 18.5%.

What conventional analysts fancy as “Goldilocks,” I view as acute Monetary Disorder and resulting distorted and dysfunctional markets. For a decade now, coordinated rate and QE policy has nurtured a globalized liquidity and speculation market dynamic. Securities markets have come to be dominated by an unprecedented global pool of speculative, trend-following and performance-chasing finance. The extraordinary central bank-orchestrated market backdrop has over years incentivized the disregard of risk, in the process spurring the move to ETF and passive management – along with a proliferation of leverage and derivatives strategies.

The end of the quarter witnessed the first inverted Treasury yield curve (10-year vs. 3-month) since 2007. Ten-year Treasury yields sank 28 bps to close the quarter at 2.40% vs. three-month T-bills ending March at 2.34% (down 7bps y-t-d). The quarter saw two-year Treasury yields drop 23 bps (2.26%), five-year yields 28 bps (2.23%), and 30-year yields 20 bps (2.81%). Five-year Treasury yields dropped an amazing 28 bps in March alone (10-year down 31bps). German 10-year bund yields dropped 31 bps during the quarter to negative 0.07% – the low since September 2016. Japan’s 10-year government yields fell another eight bps to negative 0.08%. Swiss 10-year yields dropped 13 bps to negative 44 bps.

March 28 – Financial Times (Robert Smith): “The amount of government debt with negative yields rose back above the $10tn mark this week, as central banks abandoned plans to tighten monetary policy. The idea of investing in bonds where you are guaranteed to lose money — if you hold them to maturity — has always seemed paradoxical. But it begins to make sense in a world where you are sure to lose even more money if you stick the cash in a bank. Parking your money in German government bonds, for example, is also safer than trying to stuff millions of euros under your mattress. More puzzling, however, is the negative-yielding corporate bond, a phenomenon that turns the idea of credit risk on its head. Here investors, in effect, pay for the privilege of lending to companies.”

Economic concerns supposedly pressuring sovereign yields much lower apparently didn’t trouble the corporate Credit sector. After starting the year at 88 bps, investment-grade CDS ended March at a six-month low 56 bps. The LQD investment-grade corporate ETF returned 6.18% for the quarter, closing March at a 14-month high. According to Bloomberg, BBB’s (lowest-rated investment-grade) 5.82% gain was the strongest quarterly return since Q3 2009. U.S. high-yield returned 7.04%, the strongest start to a year since 2003. The JNK high-yield EFT returned 8.11%, ending the quarter at a six-month high.

The quarter began with Chairman Powell’s dramatic January 4th dovish “U-Turn.” After raising rates and holding to cautious rate and balance sheet normalization at the December 19th FOMC meeting (in the face of market instability), such efforts were abruptly abandoned. The Fed will soon be winding down the reduction in its holdings, while markets now assume the next rate move(s) will be lower.

It was my view that Chairman Powell was hoping to distance his central bank from the marketplace preoccupation with the “Fed put” market backstop. The Fed’s about face delivered the exact opposite impact. Global markets have become thoroughly convinced that the Fed and global central banking community are as determined as ever to do whatever it takes to safeguard elevated international markets. Moreover, markets have become emboldened by the view that December instability impressed upon central bankers that a prompt wielding of all available powers will be necessary to avert market dislocation and panic.

As such, if markets lead economies and central bankers are to respond immediately to market instability, doesn’t that mean safe haven bonds should rally on the prospect of additional monetary stimulus while risk assets can be bought on the likelihood of ongoing loose “money” and meager economic risk? The Central Bank Everything Rally.

The Draghi ECB, fresh from the December conclusion of its latest QE program, also reversed course – indefinitely postponing any movement away from negative policy rates while reinstituting stimulus measures (Targeted LTRO/long-term refinancing operation). Even the Bank of Japan, permanently cemented to zero rates and balance sheet expansion ($5TN and counting!), suggested it was willing to further ratchet up stimulus. Putting an exclamation mark on the extraordinary global shift, the FOMC came out of their March 20th meeting ready to exceed dovish market expectations – booming markets notwithstanding. Message Received.

The dovish turn from the Fed, ECB and BOJ flung the gates of dovishness wide open: The Bank of England, the Reserve Bank of New Zealand, the Swiss National Bank, etc. The tightening cycle in Asia came to rapid conclusion, with central banks in Taiwan, Philippines, and Indonesia (at the minimum) postponing rate increases.

But it wasn’t only central bankers hard at work. Posting an all-time shortfall in February, the fiscal 2019 U.S. federal deficit after five months ($544bn) ran 40% above the year ago level. But this is surely small potatoes compared to the shift in China, where Beijing has largely abandoned its deleveraging efforts in favor of fiscal and monetary stimulus. After an all-time record January, it will most likely be a record quarter for Chinese Credit growth – monetary stimulus that spurred stock market gains while nursing sickly Chinese financial and economic Bubbles.

The Stimulus Arms Race accompanied intense Chinese/U.S. trade negotiations, in the process emboldening the bullish market view of a Chinese and U.S.-led global recovery. My market gains are bigger than yours. With both sides needing a deal, markets had no qualms with stretched out negotiations.

The Shanghai Composite surged 23.9%. China’s CSI Midcap 200 jumped 33.5%, with the CSI Smallcap 500 up 33.1%. The growth stock ChiNext index surged 35.4%. Underperforming the broader market rally (as financial stocks did globally), the Hang Seng China Financial Index rose 14.2%. Up 33.7%, the Shenzhen Composite Index led global market returns.

Gains for major Asian equities indices included India’s 7.2%, Philippines’ 6.1%, South Korea’s 4.9%, Thailand’s 4.8%, Singapore’s 4.7% and Indonesia’s 4.4%.

Losing 1.9% during the final week of the quarter, Japan’s Nikkei posted a 6.0% Q1 gain. Hong Kong’s Hang Seng index jumped 12.4%, and Taiwan’s TAIEX rose 9.4%. Stocks jumped 9.5% in Australia and 11.7% in New Zealand.

The MSCI Emerging Markets ETF (EEM) gained 9.9%, more than reversing Q4’s 7.6% loss. Gains for Latin American equities indices included Colombia’s 19.8%, Argentina’s 10.5%, Brazil’s 8.6%, Peru’s 9.0% and Mexico’s 3.9%. Eastern Europe equities somewhat lagged other regions. Major indices were up 12.1% in Russia, 9.0% in Romania, 8.9% in Czech Republic, 6.5% in Hungary, 5.4% in Russia and 3.4% in Poland.

It was a big quarter for European equities, with the Euro Stoxx 50 jumping 11.7%. Italy’s MIB gained 16.2% (Italian banks up 12.9%), France’s CAC40 13.1%, Switzerland’s MKT 12.4%, Sweden’s Stockholm 30 10.3%, Portugal’s PSI 11.2%, Germany’s DAX 9.2% and Spain’s IBEX 35 8.2%. Major equities indices were up 17.6% in Greece, 14.1% in Denmark, 12.8% in Belgium, 12.5% in Netherlands, 12.0% in Ireland, 10.8% in Iceland, 10.5% in Austria, 8.5% in Finland and 7.3% in Norway. UK’s FTSE100 rose 8.0%.

Especially as the quarter was coming to an end, the divergent messages being delivered by the safe havens and risk markets somewhat began to weigh on market sentiment. Increasingly, collapsing sovereign yields were raising concerns. U.S. bank stocks were hammered 8.2% in three sessions only two weeks before quarter-end, reducing Q1 gains to 9.1%. Portending a global economy in some serious trouble?

I view the yield backdrop as confirmation of underlying fragilities in global finance – in the acute vulnerability of global Bubbles – stocks, bonds, EM, China Credit, European banks, derivatives, the ETF complex, and global speculative finance more generally. While risk market participants fixate on capturing unbridled short-terms speculative returns, the safe havens see the inevitability of market dislocation, bursting Bubbles and ever more central bank monetary stimulus.

And it wasn’t as if global fragilities receded completely during Q1. The Turkish lira sank almost 6.0% in two late-quarter sessions (March 21/22), with dislocation seeing overnight swap rates spike to 1,000%. Ten-year Turkish government bond yields surged about 300 bps in a week to 18.5%. Turkey CDS jumped 150 bps to 480 bps, heading back towards last summer’s panic highs (560bps). With rapidly dissipating international reserves and huge dollar debt obligations, Turkey is extremely vulnerable. Municipal elections Sunday.

A surge in EM flows gave Turkey’s (and others’) Bubble(s) a new lease on life. But as Turkey sinks so swiftly back into crisis mode, worries begin to seep into some quarters of the marketplace that fragilities and contagion risk may be Lying in Wait just beneath the surface of booming markets. The sovereign rally gathered further momentum, while the risk markets saw lower yields and eager central bankers as ensuring favorable conditions. Yet the more egregious the Everything Rally’s speculative run, the more problematic the inevitable reversal. It should be an interesting second quarter and rest of the year.

Read More

http://creditbubblebulletin.blogspot.com/

Indian Bond Yields Likely To Remain Elevated, INR Relatively Benign

Nirmal Bang writes in a note…

The government announced the borrowing programme for FY20 which suggests clear front loading of borrowing which is unlikely to bode well for yields. The government will borrow 62.3% of budgeted gross borrowing or Rs 4420 bn in H1FY20. This is significantly higher than Rs 2880 bn (47.6% of budgeted  gross borrowing) in FY19, and also slightly higher than the historical average of 60%. With redemptions amounting to Rs 1018.7 bn, the net borrowing in H1FY20 amounts Rs 3401.2 bn, up from Rs 2004.3 bn in FY19, and at the highest level in the past  seven years.  With total budgeted gross borrowing of Rs 7100 bn, the  gross borrowing in H2FY20 will be Rs 2680 bn. With redemptions of around Rs 1350 bn, net borrowing in H2FY20 will be Rs 1330 bn, a  seven year low.

In their view, benign inflation and seasonally weaker credit demand in the first half of the financial year only partially justifies  a heavy front loading of the government borrowing programme.  Liquidity conditions are likely to remain tight given elections,  while redemptions are back ended. With the front loading of government borrowing, all hopes of a rally in bond yields can be laid to rest, despite expectations of easing by the Reserve Bank of India or RBI. Meanwhile the fiscal deficit  for April – February 2019 stood at 134.2% of revised estimates,  compared to 120.3%  a year ago. Divestment  receipts  witnessed a spurt in March, exceeding the target of Rs 800 bn, but tax revenues are falling short. In our view, only a cut in expenditure will allow the government to meet the fiscal deficit target of 3.4% of GDP.  On a year to date basis, capital expenditure is down by around 8%, while revenue expenditure is up 12.5% YoY, but lower than the budgeted 13.9%.The current account deficit  or CAD for Q3FY19 stood at US$16.9 bn or 2.5% of GDP, down from  US$19.1 bn or 2.9% of GDP in the previous quarter. It was however slightly above our estimate of Us$15.1 bn or 2.3% of GDP. It was also higher than US$13.7 bn or 2.1% of GDP in Q3FY18.  For the period  April- December FY19, the CAD stood at 2.6% of GDP. Consequently, we have revised up our CAD estimate for FY19 marginally to 2.4% of GDP, from 2.3% earlier. The balance  of payments recorded a deficit of US$4.3 bn in Q3FY19 primarily on account of portfolio outflows. Nevertheless, the sequential moderation in the CAD, and the recent return of FPI flows suggests a  relatively benign outlook for the INR in the near term, although we continue to expect it to trade with a depreciation bias.

License to Thrill No More

By Murray Gunn

The luxury British car maker Aston Martin has learned a hard lesson; namely, diamonds may be forever, but the market for $400,000 cars is not. A February 28 Guardian article confirms that since going public on the London Stock Exchange last October, Aston Martin’s shares have plummeted 40% amidst billions of dollars in losses. To be fair, some of the loss can be attributed to the company’s IPO costs, but we believe that where there’s smoke, there’s fire. The IPO, in and of itself, is a splendid signal that the credit cycle, and the positive social mood which fueled a massive expansion of credit and rising stock values, is undergoing a bearish shift. A fall in Aston Martin’s fortunes equally represents a fall out of favor of one of the most recognizable bull market icons — Bond, James Bond.

Since Ian Fleming wrote the caddish secret agent into being in 1952 amidst the postwar bull market, Bond’s popularity has risen and fallen with the Dow. (See chapter 10 of Socionomic Studies of Society and Culture here.) And since Bond drove onto the big screen in 1964’s “Goldfinger” in his epochal Silver Birch DB5, the character has been synonymous with the luxury car brand.

In 2005, during the great stock market boom and one year before the 2006 blockbuster hit “Casino Royale,” Aston Martin experienced its best year on record and turned a profit for the first time in its 90-year history. Optimism was so high that a June 26, 2007 Motortrend piece affirmed that the company’s new owners, who just bought it for $1 billion, planned to “recover a good chunk of their investment through an initial public offering in the London Stock Exchanges within five years.” Those plans were soon derailed by the 2007 stock market peak and ensuing global financial crisis. Aston’s IPO hopes went up in smoke, as a December 1, 2008 Telegraph article revealed, the car maker’s drastic cut of “one-third of its workforce amidst the extraordinary market condition we all now face.”

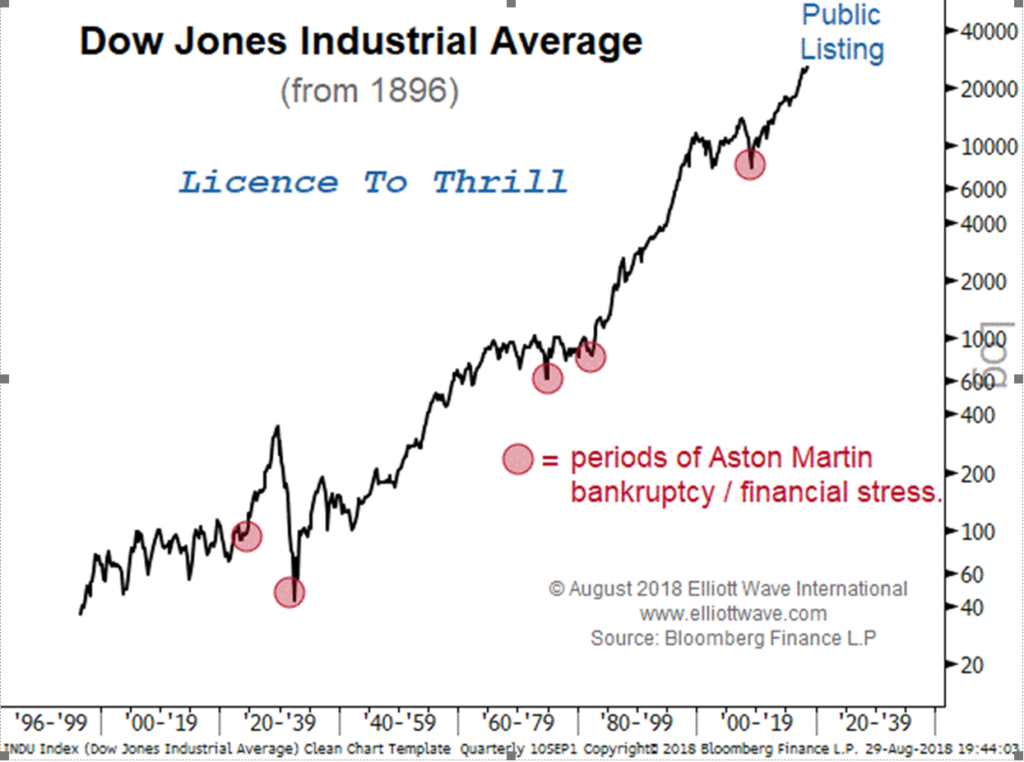
Flash ahead to 2018, the 2007-9 Great Recession firmly in the rearview amidst a record-shattering bull market, and Aston Martin decides to “remake the Classic James Bond DB5” at a sky-high price of $3.5 million (Put it on “M’s” tab!). Coincidentally, the car maker announced take two of its plans for an IPO. In an August 29 report titled “Live and Let Die,” I published the following long-term chart of the Dow Jones Industrial Average which showed five instances when Aston Martin’s insolvency or deep financial stress coincided with troughs in the global economy and wrote:

Aston Martin Lagonda’s first day of trading as a public company was on October 3, 2018 the exact day of the top in the Dow. Fittingly, global James Bond Day was October 5. The Dow then declined by 19% into December, while Aston’s stock plunged 40%, no doubt making investors feel like Goldfinger did when Bond took away his gold.

The 25th installment of the James Bond franchise, “Bond 25,” is slated to hit theaters in 2020. Meanwhile, Aston Martin hinted of a partnership with “aerospace experts to develop a new model with takeoff and landing capabilities.” (September 20 USA Today). I can envision no better symbol of soaring optimism than a flying Aston in the next Bond film. But should the villain of a bear climb into the passenger side of the market as it is whisking through the clouds, investors are going to wish for a Q-worthy ejector button to cast it out.

Discover how the popularity of James Bond films has fluctuated with the Dow Jones Industrial Average in this free chapter from Socionomic Studies of Society and Culture. Read the chapter now.

Songs of Experience

‘Historically’, it’s a big 12 letter word. It is used so often that it has become a string of empty platitude. History tells us figures and those figures tell us what would happen on a large scale and not vice versa. In recent times, ‘historically’ is used as a prefix comfortably to not the past events, but one’s experience of past events. Often in such representation does one forget and link theory to numbers, one interpret in a manner which feed to their thinking. Not denying one’s right to have an opinion but when there exists a big bag of mixed conflicting opinions, then you should sit, breathe and think, it is then when a ‘World out of Whack’ is born. This blog explores connection between multiple opinions and outliers which skew public’s ‘opinion’.  This in part is addition to the belief underlining the previous blog ‘Capital Flow and Inverted Yield Curve’ that the frightening recession indication may be a false positive or a danger lurking in the shadow.

 As Stan Druckenmiller say, “Looking at U.S. Treasury yield curve inversion – in isolation – relative to recession risk is a fool’s errand.” Alone, any asset is guest to multiple conjecture however, when a cross asset examination is made, figures alone tell a beautiful story. A story which many lived through but were wilfully blind to it as they were pretty occupied searching in numbers a story which they wanted to believe to be true.

To begin, commonly 10 year Treasury yield (TNX) is most quoted as this is tied to a variety of assets, indexes and indicators in financial markets including 30 year fixed rate mortgage. Since 1990, 3 month/ 10 year yield curve has inverted thrice, 1998, 2000-2002 and 2006-2008. The first inversion lasted only for a few days (Greenspan Put) and is a classic example of a false positive. In response to inversion, S&P rallied rapidly and only a few were left to take advantage from it. In 2019, March GDP forecasts plunged lower to just above 1.5%. Treasuries have been pricing in GDP slowdown for a month now. The percent of S&P 500 stocks flashing a MACD sell signal in past 10 days hit about 52% on March 7, it is on this date that the 3 year treasury yield first inverted by dropping below 1 month Treasury yield .

Source: Investopedia

On March 22, the 10 year treasury yield (TNX) dropped below 1 month treasury yield. 20 year and 30 year treasury yields are still above 1 month treasury yield. On average, it takes equities eight months to peak and drop lower once the yield curve inverts.

A conflicting opinion on the inversion is expressed by three individuals. A ‘perma-bear’ Albert Edward who has been underweight U.S. equities since 1999 says, “We currently have a dreaded yield curve inversion with 3 month rate exceeding 10 year treasury. This is a classic signal of coming recession. But recession does not start until the curve starts to steepen again with short term rates falling.”

Bloomberg’s John Arthur points out that the steepening is underway and that the spread between 10 year and 30 year yields is rising fast. On Thursday, 10 year treasury yield rebounded from 15 month low.

This for-recession opinion stands tall with opposing false-recession opinion by Goldman and Morgan Stanley strategists. Goldman strategists led by Alessio Rizzi and Christian Muller – Glissman say, “The proportion of yield curve that’s inverted isn’t as high as in past recessions and part of slump can be attributed to dynamics outside U.S. American credit spreads also aren’t telegraphing stress.” At Morgan  Stanley strategist Matthew Hornbach thinks “The 3 month 10 year inversion would need to continue at least until June Federal Reserve Policy meeting before policy makers get uncomfortable.”

A moot point.

As Investopedia explains, when investors get nervous about economic outlook, they tend to buy long term treasuries to protect their capital which basic economics tells us increases demand for long term treasuries, causing higher prices and lower yields. They may even buy longer term treasuries with lower yields than short term to lock in the yield anticipating that Federal Reserve would be forced to lower short term rates to prevent economic slowdown. Panic buying pressure had pushed 10 year yield (15 month low) and 3 month T – bill yield to 2.40%.

Even though short end of the yield curve is currently higher than the belly of the curve, traders have already priced in the Federal fund rate cut by FOMC in 2019 by rising the prices of futures contracts up.

Now let’s see how S&P 500 is performing. On Thursday, Bloomberg cited that S&P 500 index remained on its track for its best quarter since 2009 with the beaten down, commodity and financial shares leading the charge. In order to not miss the apparent last leg of rally before the fall, investors are lifting S&P higher which is clouding the voice of the market. Investors are so confident about its movement that they continue buying on margin.

Margin debt which reached an all-time high in May’18 with hitting bottom in Dec’18 have rebounded substantially and few inches away from meeting its 2018 high. The economically sensitive sectors such as banks, fell sharply along with bond yields. Banking shares fall when curve is inverted as the there is a squeeze in interest margin for borrowing short and lending long.

Let’s narrow into the equities and look at sectors. When the yield curve made its inversion, financials, banks, energy, oil, semiconductors and FANGs fell. However, there were two sectors which gave a positive return despite market dip, utilities (XLU) and staples (XLP). We now zero in further and analyse two sectors in particular: Staples (XLP) – defensive sector and consumer discretionary (XLY) – cyclical sector. This is an insight provided by Bear Traps Report in its public blog.

For five years before June 2018, XLY outperformed XLP by 82.6% vs. 47.90%. Since June 2018, XLP has outperformed XLY. This trend of before and after June 2018 repeated itself transparently in past 30 years whenever U.S. saw recession. XLP apparently is a recession proof sector!

Source:https://www.thebeartrapsreport.com/blog/2019/03/22/classic-signals-fixed-income-and-equities/

When XLP is compared with S&P 500, XLP did outperform SPY by 24.53% in 2000 – 2002 and by 27.60% in 2006 – 2008. However, we earlier noted that equities take 8 months to drop upon yield curve inversion. XLP outperformance also started after 12 months in the yield curve inversion.

Source:https://www.thebeartrapsreport.com/blog/2019/03/22/classic-signals-fixed-income-and-equities/

Such confirmations are evident in close dissections and hide behind numbers in plain sight signalling when to be overweight or underweight and in which sector. It is on such occasions when one should read the numbers rather than reading theory and fitting them with numbers. Like in regression, even the best fitted line leave residuals.

It would be too soon to draw conclusions where the economy is headed as a lot depends on Federal Reserve but you can always be prepared for either occurrence if you choose to invest time in independent unbiased research without following the crowd and allocating your money wisely so that when the crowd grasps the trend in a sector and rush to get in, then you can get out and reap fruits of your selection.

(with inputs from Apra Sharma)


Charts That Matter- 28th March edition II

The Fragile 5 under pressure again. Argentina Peso world’s worst currency with -14.2% ytd, Turkey Lira down 5%, Rand down 2.1%.

US repatriating foreign asset holdings has kept USD strong

Market Value of Global Negative Yielding Bonds up +$518 Billion today to $10.42 Trillion…just $1.75 Trillion away from record high


Harvard has the largest endowment at $39.2 billion, with Yale at $29.4 billion. But in the latest fiscal year ending in June 2018, Yale posted a 12.3% return, beating Harvard’s 10% return, Here’s an article making the case that you can basically copy the Yale endowment using these 12 ETFs: https://www.moneyshow.com/articles/guru-51180/12-etfs-to-beat-harvard-and-yale/ …

China (Partly) Answers For Why Markets Are Forecasting Even More Powell Rate Cuts

Jeffrey snider writes…

On February 7, the 3-month LIBOR rate (US$) fell sharply. Traders were, as various media outlets reported, stunned. All sorts of excuses were issued, the goal of them cumulatively to deny your lying eyes. Falling LIBOR couldn’t have been the market, especially eurodollar futures, anticipating a rate cut because these same people had been saying (and betting) for nearly two years how awesome the (global) economy was becoming.

Globally synchronized growth doesn’t lead to falling LIBOR, let alone rapidly falling.

Read Full post below

https://www.alhambrapartners.com/2019/03/27/china-partly-answers-for-why-markets-are-forecasting-even-more-powell-rate-cuts/

Capital flow and Inverted yield curve

Historically inversion in yield curve is a predictor of a recession and when somebody writes “This time it is different” I would normally not take that “different view” into account. Martin Armstrong looks at it from Capital flow point and after reading his blog I must admit that this time it might not be predicting a US recession but something else. He writes

Last week, the yield on the 10-year U.S. Treasury bill fell below that of the 3-month note for the first time since 2007. This is what everyone calls an Inverted Yield Curve, and is seen as an early indicator of a recession. In that regard, it is conforming to the Economic Confidence Model (ECM) which has been warning that this last leg should be a hard landing economically for most of the world. Nonetheless, while the yield curve has inverted, it has done so in a rather unusual manner. This is NOT suggesting a major recession in the United States. Instead, it is a reflection of global uncertainty outside the USA.

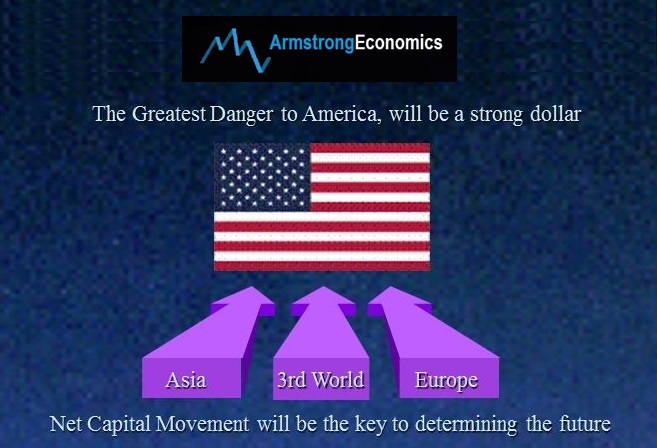
This Inverted Yield Curve is confirming that as the political chaos emerges around the world, the more foreign capital is parking in the dollar. With the May elections on the horizon in Europe, and the October elections in Canada, April elections in Israel … etc. etc., the capital flows are still pointing ever stronger into the dollar right now. The foreign capital has been buying the 10-year notes driving the spread lower. Just look at the daily chart of the Euro and you will see it has taken a nose-dive from the March 20th high.

My two cents

Looking at strictly from capital flow point of view…. Capital always flows from periphery (rest of the world) to its Core (US.. being a reserve currency)in times of trouble. Hence this inversion could simply be the global money hiding into US treasuries and it will also lead to stronger Dollar in coming years.

Charts That Matter-28th March

Japanification completed: 10y German Bund yields drop below Japan’s 10y for 1st time since 2016.(holger)

If foreign Central Banks won’t grow UST holdings, then over time we can have strong equity markets or we can have strong UST auctions, but we likely cannot have both.

When SILVER fails to follow GOLD most times its a warning of a move lower IN GOLD and GOLD miners

Turkey’s offshore borrowing rate hits 1,326% Finally, interest rates you can observe.