Global bond and equity markets shrink $5tn in 2018

There are  Rare parallel declines in capital markets could result in biggest contraction post financial crisis

Rising US interest rates have tripped up the global bond market this year, with almost every corner of the fixed income universe losing money in 2018. While issuance has continued to be robust, that has meant that the Bloomberg Barclays Multiverse — the biggest, broadest bond market benchmark — has lost $1.34tn of its market capitalisation this year.

At the same time, stock market momentum initially triggered by a robust global growth spurt and corporate earnings-enhancing tax cuts in the US has faded lately. Rising bond yields, the spluttering global economy and investors starting to factor in less ebullient corporate profits next year triggered a drop in the US stock market last month, which added to the malaise in Europe and Asia. As a result, the FTSE-All World stock market index has lost 5 per cent this year, shaving off more than $3.6tn of market capitalisation, which in nominal terms is the biggest dollar loss since 2011.

Of the international equity index’s 3,208 members, more than 500 are down by at least 30 per cent this year, over 1,000 have fallen by at least 20 per cent and less than a third are up for the year.

Canary in the Credit Market’s Coal Mine

Doug Noland writes…What ever happened to “Six Sigma”? GE was one of the most beloved and hyped S&P500 stocks during the late-nineties Bubble Era. With “visionary” Jack Welch at the helm, GE was being transformed into a New Age industrial powerhouse – epitomizing the greater revolution of the U.S. economy into a technology and services juggernaut.

GE evolved into a major financial services conglomerate, riding the multi-decade wave of easy high-powered contemporary finance and central bank backstops. GE Capital assets came to surpass $630 billion, providing the majority of GE earnings. Wall Street was ecstatic – and loath to question anything. GE certainly had few rivals when it came to robust and reliable earnings growth. Street analysts could easily model quarterly EPS (earnings per share) growth, and GE would predictably beat estimates – like clockwork. Bull markets create genius.

It’s only fitting. With a multi-decade Credit Bubble having passed a momentous inflection point, there is now mounting concern for GE’s future. Welch’s successor, Jeffrey Immelt, announced in 2015 that GE would largely divest GE Capital assets. These kinds of things rarely work well in reverse. Easy “money” spurs rapid expansions (and regrettable acquisitions), while liquidation phases invariably unfold in much less hospitable backdrops. Immelt’s reputation lies in tatters, and GE today struggles to generate positive earnings and cash-flow.

When markets are booming and cheap Credit remains readily available, Wall Street is content to overlook operating cash flow and balance sheet/capital structure issues. Heck, a ton of money is made lending to, brokering loans for and providing investment banking services to big borrowers. That has been the case for the better part of the past decade (or three). No longer, it appears, as rather suddenly balance sheets and debt matter.

After ending 1994 with Total Liabilities (TL) of $158 billion (total equity $28bn), GE TL closed the nineties at $357 billion. Over the subsequent five boom years, TL increased to $382 billion, $425 billion, $507 billion, $563 billion and then 2004’s $627 billion. TL peaked in Q2 2008 at $720 billion (total equity $127bn). A slimmed down GE ended Q3 2018 with TL of $263 billion supported by $48 billion of Total Equity. GE finished the quarter with Short-Term Debt of $15.2 billion and Long-Term Debt of $100 billion.

GE CDS (Credit default swap) prices surged 24 bps Friday and 86 bps for the week, to 259 bps. This was after beginning 2018 at 41 bps. It’s worth noting that GE CDS closed this week at the highest level since the Fed “exit strategy” mini-panic back in 2011. But rather than commencing an exit from its bloated crisis-era balance sheet, the Fed proceeded over the next three years to double holdings again, to $4.5 TN. This extended GE’s lease on life, along with the fortunes of scores of aggressive borrowers. Perhaps a $9.0 TN Fed balance sheet could save GE.

Most of GE’s long-term debt is rated BBB+, “investment grade” but only a couple notches from high-yield (BB+). The worry is that downgrades will push GE bonds to junk, forcing liquidation by funds and holders restricted to investment-grade holdings. “Moneyness of Risk Assets” has been a key analytical construct throughout this reflationary cycle (an evolution of “Moneyness of Credit” from the mortgage finance Bubble period). Fed (and global central bank) rate, QE, and market backstop policies incentivized (coerced) savers into the risk markets, especially in perceived lower-risk equities and fixed-income. With market yields way below investment return bogeys, many (pensions managers) were compelled to boost returns with leverage. Literally Trillions flowed into perceived safe and liquid “money-like” ETF shares. The flood of “money” into (higher yielding vs. CDs and Treasuries) investment-grade ETF products ensured the easiest Credit Availability imaginable for companies to borrower for capital investment or, more often, stock buybacks and M&A.

Read More

http://creditbubblebulletin.blogspot.com/2018/11/weekly-commentary-canary-in-credit.html

Upside Earnings Surprises Have a Downside

Jason Writes “Companies that beat estimates are often punished by investors as quality of quarterly performance, forward guidance hold more sway“Investors are saying, ‘Forget about whether you beat earnings expectations last quarter,’” says James Bianco, president of Bianco Research LLC in Chicago. “‘What’s your outlook for next quarter, next year? What’s your guidance? That’s all we care about now.’”

Companies reporting higher earnings than expected have generated stock returns lower than the historical average over the preceding five years.

“The forward look is more dour than we’ve had in the recent past. “The underlying fundamentals are a little slower, and the market is adjusting by putting a lower multiple on late-cycle earnings”—in plain English, marking stock prices down.
Professional investors are also becoming less reliant on the earnings forecasts of the “sell-side” analysts who work for Wall Street’s banks and brokerage firms.
Hedge funds and other asset managers have been tapping into massive data sets—shipping statistics, website traffic, measures of how many shoppers visit stores, credit-card volumes and the like—that open real-time windows into business activity.

Read Full article below

https://www.wsj.com/articles/upside-earnings-surprises-have-a-downside-1542387601?emailToken=fcc1c548e8884db2eb1ed5af708488baIy8JqzYs4OrhG6d38aSeemYj+h+cVvofCQO3MUAD+pcn14+ybBcNsAqbFtGGu3JtFbcVicj5oczrLUo/s1UUxBjFZ8X0XFgyNT//jQizN5M%3D&reflink=article_email_share

Can Central Banks Go Broke? A Question for India

Patel was barely two months into his job when he was pushed to execute the note ban. He couldn’t resist then. But now he should, with all the arguments at his disposal, including those of Buiter

Read the arguments below from an article by Andy Mukherjee

https://www.bloombergquint.com/global-economics/india-s-central-bank-dilemma-can-it-go-broke#gs.CapHVdg

Crescat nails it

Crescat’s flagship global macro fund was up 17.1% net in October and rose to 28.2% net year to date.

Today, their three highest conviction macro ideas and portfolio exposures continue to be:
US Equities: The market is damaged and finally breaking down from truly record valuations while US profit growth has peaked. Crescat’s hedge funds remain tactically net short.
China: China’s economy is in the early stages of a collapse which will be globally contagious. The trade war with the United States is just one catalyst, not the primary cause of China’s economic downfall. We expect China’s currency to soon enter a full-blown crisis and have shifted our global macro hedge fund short exposure slightly less towards Chinese stocks and slightly more towards the currency.
Precious Metals: Left for dead. Precious metals are an extremely undervalued alternative to cash today as a haven trade that can also help us capitalize on financial turmoil and beat inevitable future inflation.
US Equities and High Yield Corporate Credit
It was just two months ago that the US stock market hit all-time high valuation multiples across eight different measures that we have been featuring in our quarterly letters. Our macro model is signaling that a cyclical bear market in US stocks remains in the early stages of developing with much further to play out over the next one to two years. We remain fundamental bears on US equity and high-yield credit markets. Corporate leverage is at record levels while credit spreads are near all-time lows. It is late in the economic cycle with the Fed continuing to remove liquidity from markets by raising interest rates and unwinding its balance sheet. With many global stock markets already in bear territory, US markets are finally showing signs of cracking. Now is a great time to be short overvalued US stocks such as those identified by Crescat’s fundamental equity model. That is how Crescat’s hedge funds remain positioned currently. Our global macro fund also continues to be short high yield bonds through put options on select ETFs.
China
A global macroeconomic downturn is already in motion with the unwinding of record debt-to-GDP bubbles globally. China, the largest credit bubble ever based on our analysis, is already in a full-scale credit bust with the median Chinese-listed equity recently down almost 40% from its 12-month high. We believe China is already in a serious recession despite popular fiction regarding its positive reported GDP numbers that omit losses on bad debt. Chinese stocks have already lost over $5 trillion of market value since January of this year, about 26% of GDP. Yet, no commensurate value of bad debt has been marked down yet. By comparison, in 2008 when US stocks had lost a similar proportion of GDP in market value, the US economy was already in deep recession. China is almost certainly in recession now.
As we have been writing about for several years now, China’s GDP has been vastly overstated due to the lack of write-downs of its non-performing loans. By our estimates, bad loans today still on the books of Chinese banks could be as much as $8 trillion, 60% of its GDP and about four times the book value of equity in its banking system. These are insanely large numbers that portend systemic bank runs and social unrest. The Chinese economy has been a failed experiment in Ponzi finance. China can no longer fool the world regarding its GDP growth. The result is an historic credit bubble that is finally bursting under its own weight. The Trump trade war has been just one of the many catalysts for the burst, but it is not the root cause of it. The cause was excessive bank credit expansion along with the continued rolling over of bad debt. That playbook is now coming to an end with a dramatic slowdown in China’s M1 and M2 growth proving that its credit expansion is unsustainable. China is now experiencing its time of economic reckoning, its Minsky Moment. The Chinese banking imbalances are so large that it is too late to undo the bursting of the credit bubble regardless of the direction impending trade negotiations with the U.S. take. China is careening towards the inevitable: its central bank will soon have no choice but to print record new levels of yuan (M0) to bail out its banks and attempt to quell social unrest. Like other economic collapses of centrally-planned, totalitarian communist countries, we continue to expect that the Chinese currency will plunge as money printing and capital flight accelerates.
In our global macro fund, we remain short the Chinese yuan through put options laddered out in different durations. The yuan short has contributed to the fund’s strong performance year to date, but we haven’t seen anything yet in terms of our expected return from a coming yuan plunge. We also have significant short exposure to “the other Chinese currency”, the Hong Kong dollar, structured similarly through laddered put options to play a likely de-pegging of that currency. HKD presents an extreme asymmetric risk/reward investment opportunity to profit from yet another huge credit imbalance in the world today. Hong Kong has the largest credit-to-GDP gap and debt service ratio of all countries tracked by the Bank for International Settlements. The BIS considers each of these important early-warning indicators for banking and currency crises. Hong Kong is part of China, and therefore part of China’s credit bubble. It is China’s financial hub with the rest of the world and has its own housing and banking bubbles. Its financial markets are already being swept up in China’s economic crisis. We expect the Hong Kong dollar to de-peg and devalue as China’s credit bust continues to play out and Hong Kong is further absorbed politically and economically by China.
Precious Metals and Global Fiat Debasement
With a decade of money printing and interest rate suppression in the wake of the global financial crisis, central banks have created truly record global debt and financial asset bubbles. At the same time, they have created a corresponding record low valuation of global above-ground gold holdings relative to fiat money. The depressed gold price relative to the of high cost of finding and extracting it has wreaked havoc on the mining stock fundamentals. It’s been a seven-year free cash flow and stock price drought. Declining industry-wide capital investment over this period has created a steady decline in new gold discoveries leading to “peak gold” production fears that have large miners scrambling to acquire new in-the-ground reserves. Gold and silver miners represent historic deep value today according to Crescat’s fundamental equity model at a time when the broad competing stock market is at record fundamental valuations. Already activist hedge funds are taking note and industry consolidation is underway which has been benefiting several of Crescat’s gold and silver mining holdings. We strongly believe it is poised to be one of strongest performers in the coming months and quarters.
Why? Because we expect gold and silver to soar at the first hint of the end of Fed rate hikes which we believe is just around the corner and much sooner than priced into the Fed Funds futures curve today. The Fed has already been raising interest rates for three years now trying to lead the world out of global central bank life support, but it is hamstrung. Its tight monetary policy has already served as a key catalyst to burst global debt and financial asset bubbles in China and other emerging markets. Meanwhile, the Fed’s tightening has likely not been enough to fight rising real-world inflationary pressures at home. As record over-valued financial asset bubbles burst, it is likely that the Fed will stop raising rates soon. Next, it would likely end its balance sheet reduction, reduce rates, and re-engage in QE. The end to rate hikes will come first and the signal to watch for that will be a drop in the Fed Funds futures curve. It’s already been slipping in recent weeks.
Yield Curve Inversion… Conclusion
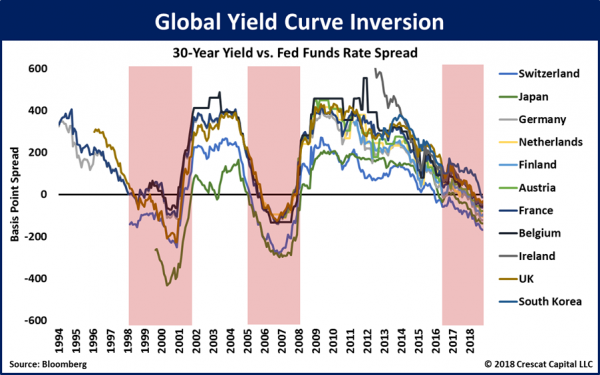
We take issue with the economists and market prognosticators who say we shouldn’t be concerned about a coming recession anytime soon because the Fed hasn’t inverted the Treasury yield curve yet. For those who obsess over the need for an inverted yield curve to signal a coming financial collapse and recession, be advised that the Fed has already inverted the global yield curve today, just as it did ahead of the last two U.S. stock market crashes and recessions. 

BRIFFITS & SQUEANS, BLURGITS & PLEWDS

BRIFFITS & SQUEANS, BLURGITS & PLEWDS
By Grant Williams
In 1980, Addison Morton ‘Mort’ Walker, a man best known for creating the newspaper comic strips Beetle Bailey in 1950 and Hi and Lois in 1954, published a book entitled The Lexicon of Comicana which has subsequently become something of a bible for cartoonists.
In his book, Walker gave names to the shorthand symbols which, without our realising it, had, for decades, brought flat, two-dimensional images to life in the most extraordinary way.
Until The Lexicon of Comicana’s publication, nobody had given much thought to what the clouds of dust that trail behind fast-moving characters or linger in a spot where a character had suddenly dashed out of frame were called. They simply ‘were’.
Walker decided that needed to change and so he filed them under ‘B’, for ‘briffits’.
While he was at it, he decided the bubbles and open asterisks representing popped bubbles that appear over a drunk or sick character’s head should be christened ‘squeans’ and the drops of sweat emanating from a character’s head to indicate nervousness, stress, or working hard should henceforth be referred to as ‘plewds’.
‘Blurgits’ (in case you are wondering) are the parenthesis-shaped symbols used to indicate less intense movement, such as a nudge, shoulders shrugging, or slow walking and, while we’re at it, allow me to offer you a few more extracts from The Lexicon of Comicana so you can astound and amaze your friends.
The squiggly lines placed over an object to indicate radiant heat? Those, my friend, are ‘indotherms’.
‘Agitrons’ are the longer wiggly lines around something that is shaking or vibrating and ‘wafterons’ are both the squiggly solid shapes that taper to a point on both ends, used to indicate strong odors, either positive or negative (the former typically filled with white, the latter with a sickly green) or, in their smaller form, when drawn above warm food items (like a pie cooling on the windowsill) will typically indicate both heat and odour.
There. Tell me you can’t win a bet or two in the pub armed with that information.
The Lexicon of Comicana does a wonderful job of corralling a bunch of nonsense into a handy compendium so it seemed like the perfect way to introduce this week’s Things That Make You Go Hmmm… because, as is always the case when I take one of my rare publishing hiatuses, there has been a whole bunch of nonsense bubble up since my last edition – any single thread of which could form the basis for an entire edition of Things That Make You Go Hmmm…, so I thought we’d spend this week catching up on a couple of them.
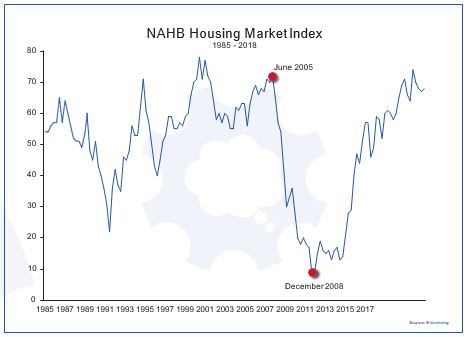
We begin with the stealth deterioration of the U.S. housing market.
The collapse of the housing market just a decade ago was the epicentre of the most turbulent period in the global economy since The Great Depression.
It’s extraordinary that we seem to need reminding of the depths to which our collective despair sank in the dark days of 2007-2009, but all that lovely printed money courtesy of the world’s central banks has clearly dulled the senses (just as it was intended to do).
By way of a reminder, the U.S. housing sector was, at the time, ‘systemically important’ – important enough that its decline brought the entire world to the brink of catastrophe and, though I hate to be the bearer of bad tidings, I have to tell you that nothing has changed.
OK, so maybe some things have changed in the financial circus that surrounds the U.S. housing market, but its importance remains undiminished.
As you can see from the chart below, the NAHB Unbridled Optimism Index Housing Market Index has turned down in the last few months after a series of wobbles. This index measures the views of respondents to the question of whether the market for new homes is good or not.https://blog.evergreengavekal.com/briffits-squeans-blurgits-plewds/

The coming monetary CRISIS

Martin Armstrong writes…”The entire problem with this Quantitative Easing has been the plain fact that the government is the biggest debtor. This is the same model around the world. Lowering interest rates to encourage people to borrow is absurd when the greatest impact will be upon the government. Europe is now on life support thanks to the ECB. Even if we look at the United States, every 1% rise in interest rates adds $220 billion annually to America’s deficit. Since we have exceeded the Bullish Reversal on Fed Rates on an annual basis ( martin’s proprietary model) , reaching the 5% level means the annual interest expenditures will be rise by about $1 trillion per year! This is just not a system that has much life expectancy before we enter a major Monetary Crisis that is off the charts”.

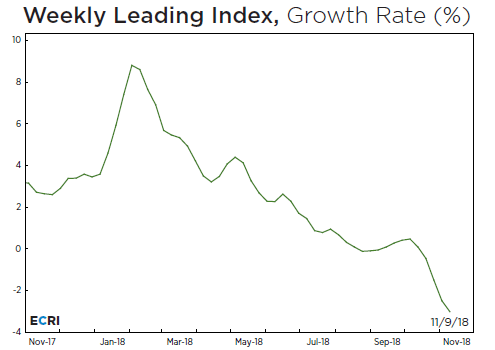
ECRI has also come out with its weekly leading index and it shows, growth is sharply cooling off which will ultimately lead to lower corporate profitability along with lower tax collection exactly at the time US will be running a trillion dollar budget deficit

.

I wanted to conclude this article with the stupidity of politicians from Illinois, the city which is so broke economically that, they want to now impose an EXIT tax for anyone who dares to think about leaving the state . Such a tax may make others decide NOT to move to the state and then watch property values also crash.

Across the West powerful firms are becoming even more powerful

ONEBRIGHT morning earlier this year your correspondent travelled from New York to the University of Chicago to attend a conference on the threat to prosperity posed by monopolies. The journey began with an alarm beeping on a handset made by Apple (which has a 62% market share in America), then a bumpy taxi ride to the airport paid for using a piece of plastic issued by one of the three firms, American Express, MasterCard and Visa, that control 95% of the credit-card market. In the terminal, breakfast was scoffed from a supersized fast-food chain, while emails were checked using Google, which has 60% of the browser market.
The mobile signal was transmitted on one of the three networks that control 78% of the telecoms market. The flight was with one of the four airlines that control 69% of journeys within America. In Chicago your correspondent checked into the LondonHouse hotel, which looks like a boutique but turns out to be part of Hilton, which controls 12% of all rooms in America, and 25% of the new rooms being built. The booking was made on Expedia, which has 27% of the North American online travel market.

Read More

https://amp.economist.com/special-report/2018/11/15/across-the-west-powerful-firms-are-becoming-even-more-powerful?__twitter_impression=true

Data is Data and it can be inconvenient at TIMES

Samuel Rines write in a Macro Note:
If the Fed is looking for excuses to tighten monetary policy further, this is not the CPI report it wanted to see,but the internals point toward further deceleration in both the headline and core. •

The fundamental story is rather simple: core commodities were less deflationary, and core services less inflationary and that is not the dynamic the Fed wants to see at this point. Services prices are sticky, less volatile, and less cyclical.

The data points toward inflation weakening through the end of 2018 and into 2019.

The underlying inflation dynamics do not point to further strength. It is worth noting that any acceleration in core goods inflation is easily overwhelmed by a deterioration in core services. Core
goods represent only roughly 25% of the core inflation weight. Core services prices are sticky, less volatile, and less cyclical – better for making policy decisions.

There are a few reasons this inflation report will matter for markets and the Fed. It will be difficult for the Fed to back-off its hiking plans in December. But it should cause the Fed to rethink its 2019 plans. The composition of the Fed’s FOMC voters changes yearly, and it already appears to be slightly more dovish in 2019. With inflation pressures tepid and likely waning, the Fed will be hardpressed to justify tightening significantly further. The Fed will be loath to back away from its current posture. But the data is the data, and it can be inconvenient at times.

20181115_OMS_inflation_Rines

The technical analyst is back and he is suggesting you temper your enthusiasm

Neppolian is back and he is suggesting that you temper your enthusiasm. On of my widely read post  http://worldoutofwhack.com/2018/10/24/conversation-with-a-technical-analyst/  was a conversation with him on technical positioning of markets where he insisted, market has put a short term bottom and is headed for a rally.

Well that played out really well and now he writes

Apropos our 5th October 2018 market update where in we had proposed markets bottoming out in the subsequent 2-3% range of 10400 and rallying to a Nifty level of 11000-11200 and Bank Nifty level of 26000-26500, here is our further thoughts.

The markets did bottom within 2-3% range of 10400 by basing a low at 10000 Nifty. Bankex  has reached the mid point of the 26000-26500 range suggested with today’s high printed at 26300. The rally measures 9% off the bottom from 24250.

Nifty: has underperformed Bankex by rallying just 7% to 10700 from a bottom of 10000. This is concerning as broad sectoral participation still remains elusive.

Breadth: one of our principle arugement for a rally was basis the sentiment indicators (breadth indicators) trading at historical oversold levels on 5th October. Currently the oversold condition no longer exist now and in fact the
present readings are close to historical pullback metrics.

Market Breadth now:
% >20DMA = 68% (4%)
% >50DMA = 44% (8%)
% > 200DMA = 40% (28%)
50DMA>200DMA=42% (56%)

The numbers in brackets above represent the figures on 5th October.

We are concerned by the deterioration in the 50>200DMA gauge moving down from 56% to 42% (this is interesting) This is suggestive of crumbling medium term market strength even as Nifty is playing out the expected rally. Such deterioration is symptomatic of corrective rallies which would eventually resolve to further downsides.

Nymex crude: the second principle argument for a rally was based on crude trading at an important rally high/resistance at 78 on 5th Oct and the expected correction in crude helping Indian equity rally. This has played out as expected with crude falling from a high of 78 to 55 now. The sentiment for crude has turned 360 degrees
from peak bullish to max bearish now. We feel the sentiment reversal is symbolic of near term bottom in crude and we are open to the possibility of crude starting a pullback rally from 55 to 65-68 levels. This should be equity decretive.

INR: The third argument for a bull case then was INR staying under 74 and a possibility of appreciating. Since then INR has been involved in a shallow appreciation from 74.5 to sub 72 now. We do not expect INR to appreciate past 71 in near term putting a cap to further equity rally.

Basis the above changed circumstances and the medium term breadth deterioration we shall be open to mark down the Nifty pullback targets from the earlier 11000-11200 to the more likely 10700-10900. We can retain Bankex ending its pullback in the range of 26300-26500.

Conclusion

This calls for taking profits in the earlier tactical buys if any done at the recent bottom and also recalibrate portfolios in the names in which you may be wanting to trim/exit.