If You Think Trump and Powell Aren’t Getting Along…you should see what’s going on in India

Jeffrey Snider writes….If you think President Trump is upset with Federal Reserve Chairman Jay Powell, you should see what’s going on in India. Central bankers had been every government’s close friend for years; a decade even. The relationships were beyond chummy, particularly as many governments celebrated their central bank heroes for heroically heroic actions saving the world from something like a repeat of 1929.
While conventional perceptions were shaped by things like QE and low rates, reality, of course, has been much different. Former Treasury Secretary Henry Paulson recently said people like Ben Bernanke saved us all from that other disastrous fate. Except the US economy is about to complete an entire decade where it has underperformed the Great Depression.

https://www.alhambrapartners.com/2018/11/02/if-you-think-trump-and-powell-arent-getting-along/


US midterm election impact on Capital markets : Probable outcomes and Market reaction

Washington has helped shape global markets over the past 12 months, whether it is the US corporate tax cut or Donald Trump’s trade war. Tuesday’s midterm elections have 3 possible outcomes.

(1) Republicans retain the senate and lose majority in the house : The mostly likely outcome by pundits is probably the most boring because it keeps fiscal policy, regulation and trade policy constant. If the consensus expectation for the election result unfolds,the market reaction is likely to be neutral to mildly positive on US markets, US Dollar with more steepness in US Bond yield curve. If one looks at betting models, there is a 60-65 % chance that Democrats take the House and Republicans keep the Senate.

(2) Democrats win both Senate and House : Should Democrats outperform expectations and take both houses, some investors worry that the risk of impeachment rises. It is also likely to eliminate the possibility of further tax cuts and may embolden efforts to roll back some reductions already made. US Markets should go lower with lower risk appetite, US Dollar should also fall along with fall in long dated bond yields ( flattening of the curve)

(3) Republicans keep both Senate and House : Conversely, if Republicans surprisingly keep both House then US equity markets are coiled for a run on upside with possible new high (magic figure of 3000 on S&P) in US stocks, helped by hopes of an easier path to further stimulus. US Risk assets will rally at the expense of Emerging Markets and US trading partners as markets will perceive investors have voted in favor of Trump policy and he will most likely continue on that path .

Whatever is the result ,brace for high volatility going into the election results as most global portfolio managers have underperformed their benchmarks this year  and they would be happy to jump into the bandwagon to eek out that missing alpha.

STOP paying the Bills, ALPHA is dead

Siddharth Rastogi at Ambit Asset Management writes an interesting take on why passive management is the future for Indian Markets

“Lot of Intelligent fund managers & advisors believe active fund management is here to stay & clients will keep paying fee for their skill, judgement & biases(pun intended) in hope to generate Alpha.

Unfortunately hope & trend both seem to be fading away atleast in the West. India will follow this investment mania sooner than later, as Investors are becoming smarter & sharp witted.
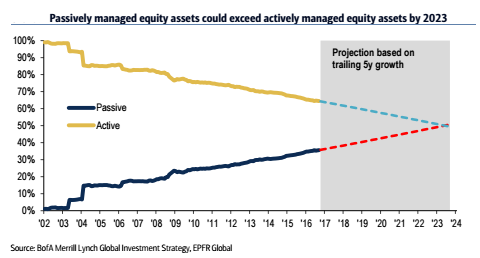
Passively managed funds/ Index funds/ ETFs found their way in financial system less than 30 years (1989) ago yet this format of investing is revolutionizing the fund management industry World wide.

According to a BlackRock survey 2018, ETFs are just two years away from hitting a landmark milestone, where half of all U.S. investors have a position in at least one ETF. As per Blackrock team currently, one in three U.S. investors own at least one ETF. Last year, one in four investors owned one.

Most fund managers in the west have been performing poorly as compared to the benchmark for long periods of time and hence the shift from Active to Passive is Swift & visible. (See the chart for US Equities)
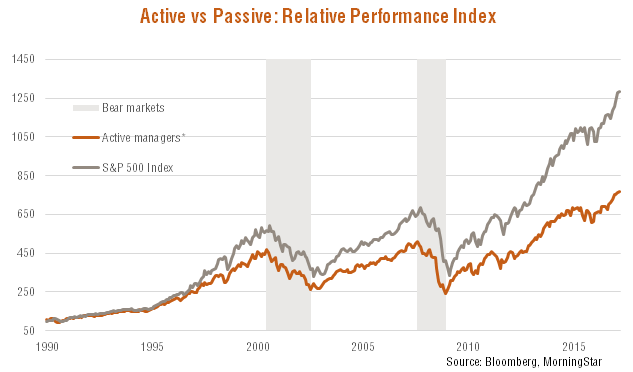
However till recently (less than half a decade ago) Emerging market fund managers including India were generating Alpha through Active management.

Question arises, When West is not able to generate Alpha, how Indian fund managers were beating the benchmarks till very recently?

Information asymmetry – Connects with Promoters / management of the company, Advance information of the private & confidential data, market inefficiencies, leakage of details through various channels & intermediaries etc.

Different Categorization, different name, different stock pick – Some fund manager in large cap oriented schemes used to have large significant allocation towards Small & mid cap stocks and those funds during bull phases of the market outperformed the market. With SEBI’s new regulation, that skill of Alpha generation is no more asset for the fund manager or for the Investment company.

Excessive Churn, Hit & Trial – Keep predicting daily trends and keep churning the portfolio incessantly to perform better.

Few experts believe that Quantitative Easing(QE) by US post 2008 financial meltdown led to death of Alpha and it’s all set to come back. QE did increase money flow in system which led to jump in US equities and inturn higher appetite for risky assets including emerging market equities. Benefit accrued to both Active as well as passive funds. Study of large cap funds vs Index in India shows some contrasting results.

US Fed’s first round of QE started in Nov 2008, with purchase of 800 billion USD in bank debt & mortgage backed securities(MBS). This continued till about June 2010. Next round of QE was from Nov 2010 till about June 2011 with a monthly buying program of 75 billion USD.

Last one came in from Sept 2012 till Oct 2014 with monthly buyout of 40 billion USD of MBS. Interestingly from 2009 till 2011(peak of US fed’s bond purchase program), Active funds outperformed the Index by an average of ~7.50%, whilst post QE from 2015 -2017, active funds could barely outperform index by ~1.75%.

For 2017 and 2018, Active funds have under performed the indices by ~4%.

So called perception that Liquidity supports or works against the ACTIVE fund managers is nothing but a Sham.

There is no secret sauce for Wealth Creation, it’s simply driven by discipline, Patience & Quality (filters for revenue, PAT, ROCE), rest all is NOISE.”

My two cents

Democratization of information and efficiencies will lead to less asymmetry in information and hence lower outperformance of actively managed fund returns from benchmark. The future lies in combination of Product innovation along with asset allocation done through low cost passively managed strategies.


US govt borrowing will crowd out other borrowers

The US federal government is projected to borrow a total of $1.3 trillion this year, which is extraordinary by historical standards because it has never happened outside the recession or recessionary conditions when Govt expanded the fiscal to support the economy.
The increased borrowing is also notable for coming at a time of rising interest rates. That makes each dollar borrowed more costly than dollars borrowed in previous years when interest rates were lower.
The increase in projected spending is necessary, in large part, to finance the $1.5 trillion in tax cuts passed late last year Republicans in Congress and signed by President Trump.

https://www.washingtonpost.com/business/2018/10/30/us-borrowing-pace-top-trillion-this-year-highest-since/?mod=djemDailyShot&mod=djemDailyShot&noredirect=on&utm_term=.bcb7e3ae6ff9

Into The “Red Zone” We go

Adam writes…We have long discussed the extremely positive demand trends taking place globally. The number of people around the world that are currently going through their period of accelerated oil demand growth (their “S-Curve” tipping point) has gone from a relatively stable 700 mm since 1960 to over 2.5 billion as India now enters its tipping point alongside China. We have never had so many people going through their period of intensive commodity demand growth at the same time and the impact cannot be overstated.
We first wrote about the rise of Indian commodity demand back in 2016 and we followed this up last year with a more in-depth analysis (please see our 4Q2017 letter). In February 2018, we traveled to India (our fifth trip in 10 years) and our visit confirmed our bullish outlook. After having long been dismissed as an immaterial source of resource demand, analysts are now finally coming around to the fact that Indian demand will accelerate materially from here. OPEC now predicts Indian oil demand will grow by 6 mm b/d over the next 22 years and our models suggest this could actually be too conservative. In August, oil consultants Wood Mackenzie predicted that India will overtake China as the world’s largest oil demand growth center by 2024. In order to meet future gasoline and diesel demand, Saudi Aramco has announced its decision to invest $44 bn in the Ratnagiri refining complex in India. When commissioned in 2022, it is expected to process 1.2 million barrels per day, making it as large as Reliance’s Jamnagar refinery (currently the world’s largest).

Read Full letter below

https://cdn2.hubspot.net/hubfs/4043042/Commentaries/2018.Q3%20Commentary/2018.09%20Goehring%20&%20Rozencwajg%20Market%20Commentary.pdf?t=1541095723037

Rhyming History

Lewis Johnson writes “Financial markets look ahead. Wait for the news and you may fall behind the biggest moves. It appears we are now very deep into one of the longest cycles of post-World War II financial history. Markets are seemingly falling “for no reason.” Is such a cyclical turn underway now? We continue to believe that more defensive portfolios are called for in this aging cycle. Today we review the lessons of prior cycles to study what may lie ahead.”

“When you feel like bragging, its probably time to sell.” – John Neff
The stocks of some of the most interest rate sensitive investments in the U.S. have fallen dramatically, on little news. Below we show the performance of such sectors in 2018. We highlight them because historic trading patterns suggest that they are among the most sensitive to higher interest rates: autos, housing, and banks.

Early Cycle Stocks in Interest Rate Sensitive Groups Get Crushed

https://blog.capitalwealthadvisors.com/trends-tail-risks/rhyming-history?utm_campaign=Trends%20%26%20Tail%20Risks&utm_source=hs_email&utm_medium=email&utm_content=67172930&_hsenc=p2ANqtz–qXYd-mGFcpGNKNvl8b9vJ5eRyVihuSbksKsbEnUtQT9Zu5Q3xraar6BLz_nYKvFZwM3M4fIWeVCHDHM4DSxlPGnqoUw&_hsmi=67172930

How politicians are creating worst economic crash in History

Martin Armstrong writes

Politicians have totally and completely misunderstood the trends within the global economy and as a result, they are actually creating one of the worst economic debacles in history. I have explained several times that the bulk of investment capital is tied up in two primary sectors – (1) government bonds and (2) real estate. Because of income taxes, real estate has offered a way to make money in capital gains without having to pay income taxes.
Money has looked to park in real estate around the world for many various different reasons as in Italy it was the escape from inheritance taxes as well as banks or in Vancouver to gain a foothold for residency fleeing Hong Kong. In Australia, there was the Super Annuation Fund which allowed people to use retirement funds for real estate. In New Zealand, the new government wanted to declare foreign investment just illegal and in Australia, they made it a criminal act for a foreigner to own property and not inform the government they were foreigners. Over in London, they imposed taxes on property which created a crash.

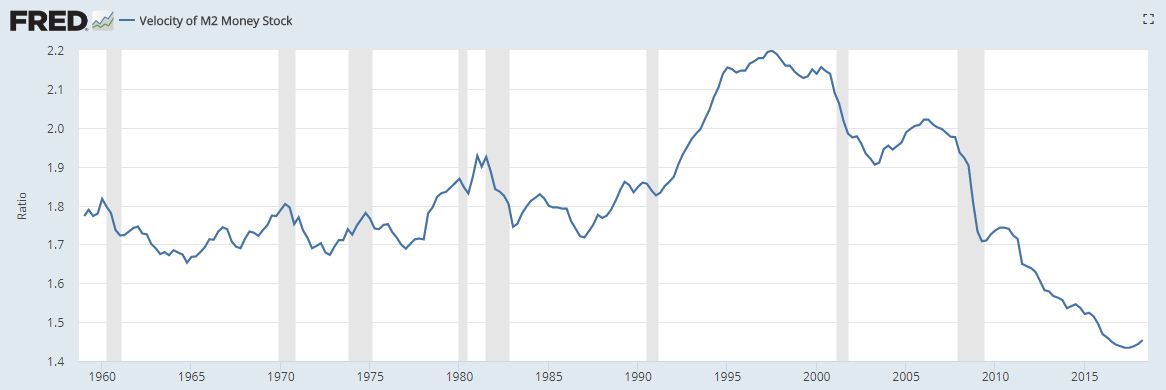
People spend more when they believe that they have big profits in their home. The recession of 2007-2010 was so bad recording the worst of all declines since the Great Depression all BECAUSE it undermined the real estate values. People then spent less because they viewed their home declined in value. As taxes have been rising and the average home value collapsed, the velocity of money kept declining. Especially as real estate values declined and interest on savings accounts vanished hurting the elderly who saved money for retirement and discovered their savings were producing less income, the velocity of money just plummeted. The velocity of money began to turn up finally in the USA ONLY when interest rates began to rise. The retired could suddenly begin to make something on the savings for once in a very long time. This is something the ECB still has not figured out in Europe as it has wiped out both the elderly savings along with pension funds.
The politicians are actually creating the worse possible scenario for the economy going forward. Welcome to the new face of stupidity. They are so out there that it is like they are sitting on a branch of a tree and cutting the branch expecting the tree to fall. This is what they have done to real estate which makes even what Goldman Sachs did in 2007 child’s play.
Now add government borrowing which competes against the private sector and it only gets even more stupid. Then we have brain-dead investors who actually think government debt is “quality” issued by idiots who have ZERO intentions of ever paying off their debt at any point in the future. Governments borrow year after year with no understanding what they are doing to the entire economy and how they are causing unemployment to rise with ever more taxes and more borrowing completing with the private sector on every level

https://www.armstrongeconomics.com/armstrongeconomics101/economics/how-politicians-are-creating-the-worst-economic-crash-in-history/

Social Mood and the Tallest statue in the world

Rohit Srivastava at Indiacharts explains brilliantly the correlation in society mood, Tallest statue and fate of markets

“Yesterday – the Indian Newspapers were splashed with advertisements of the Inauguration of the tallest Statue in the World constructed in the State of Gujarat. A big feat and it was undertaken by this regime in the midst of booming stock market. What can it tell us about the state of the mood in India and what lies ahead for the Indian stock market? At 182 meters this is now the Tallest Statue in the world

statue

This was accompanied by a list of all the previous Statues that held this claim providing an interesting ground for R&D into the importance of these events.

This brought to my mind memories of the multiple articles on social mood written by Robert Prechter on the relationship between stock market peaks and construction of the words tallest buildings. He noted it was not the date of construction alone but the period when it was constructed that was important to know where we are in the long term. Without putting words in his mouth here is what he said in his Elliott Wave Theorist publication.

tallest

An interesting chart of the history of buildings near peaks is also below.

With that, let us see where we are with respect to the largest Statues in the World. It is my belief based on the work already done by the Socioeconomics Institute on the subject that the decision to construct the largest Statue in the world by Shri Narendra Modi, marks the strong social mood of the times in India. The confidence that all is well based on what has been a 15 year advance in stock prices. It also marks the final bubble phase of the Indian stock market, and based on my long term chart of the Nifty the 5th wave, in the form of an ending diagonal at the end of a Supercycle degree bull market. That it was completed yesterday is less important than that is was in construction for the past 56 months. The bids started in Oct 2013 and awarded in Oct 2014.

nifty500

So now the big question is when was the second biggest statue constructed? Right into the peak of 2008 and completed by Sept 2008. The Spring Temple of Buddha though took 10 years to complete. But here is the big catch 3 of the tallest statues were completed in 2008 in months of each other and are all Buddha statues. A lot of tall buildings were getting constructed at the same time as mood was reaching a peak. We seem to have seen that with the statues in 2008.

st1

The Ushiku Daibutsu in japan was completed in 1993 after 10 years of work and within that occurred the Supercycle degree peak in mood and the Nikkei stock index. So work started on it in the midst of the Japanese bubble that popped in 1989 but was completed only years later.

st2

Now the Russian statue The Motherland Calls put up in 1967 a time when there was no RTSI index so it is hard to point to the stock market there. But the Statue of Liberty 1887, USA started construction in the early 1870s. It was a gift from France. That said the stock market rallied into the 1870s and then went into a long consolidation phase. What makes 1870 important is not the US stock market performance alone but that it was at the end of a global boom in railroads. So while US stocks peaked after the 1870s and consolidated for many years it was the UK charts that might be more compelling. As that period was marked by overinvestment in railroads and then banking failures. So here is a chart of the UK market cap performance from 1825-1870. Not the clearest view of the period but a zoom into what happened after 1873 for US stocks.

The next and final chart shows the US from 1950 to date

st3

Lastly what did the railroad boom look like? The pre 1970 UK market boom was put together in one paper by Graeme G Acheson, probably written for Cambridge University but I found it online listed on many websites and am picking the chart from there so you know what it was like before the Statue was gifted to the US.

st4

Now you may consider the evidence here coincidental and you can also think that the start dates of building are way before the bubble peaks. However, the moment I laid my eyes on an advertisement that spawned across the newspapers it appeared as a reflection of the positive mood of the times and it was worth the effort digging into it this morning. I am especially taken up by it because it comes at the end of India’s Supercycle degree bull market that is ending with an ending diagonal in my opinion. And if this tallest statue is a red flag then we have held it up wide and loud for the world to see and note. While most would see it as a sign of confidence socionomic studies see it as the point of maximum confidence just as the tide is about to turn

My two cents

I spend a lot of time understanding society mood and Pessimism leads to skepticism. Skepticism leads to optimism. Optimism leads to euphoria and the cycle repeat itself. The statue is a sign of late Euphoria

Indians keeping more cash reserves at home now than they did before demonetisation

An interesting interview with Rajiv Kaul executive vice-chairman and CEO of CMS Info Systems, a cash management company , talks about the future of cash in India.

Some important snippets

Consumers are less confident about when an ATM will work and dispense cash. So, people have started withdrawing more cash per ATM transaction (18-20% growth). It has also been observed that people are keeping more cash reserves at home for emergencies than they did before.

Japan has 18% cash to GDP compared to 12% in India. Germany has 75-80% retail cash transactions compared to 85-90% in India. The stock of currency grew in a developed economy like the US by 7% in the last five years (11-12% in India, pre-demonetisation). So, there is a need for cash as a preferred medium of transaction. Digital and cash will co-exist as they do everywhere in the world

Management of cash is still very inefficient and time-consuming. However, the cost of a cash transaction is the lowest, at about 0.25% versus the 1.5-2% credit cards charge.

Cash plays a critical role in enabling commerce and economic growth in India. Withdrawals through the ATM channel are up 22% from last year, at ₹2.65 trillion a month in April 2018. Consumers are withdrawing more money per transaction. Of the channels available for cash withdrawals—ATMs and bank branches—our analysis suggests that the cost of cash transaction at a branch can be as high as ₹40-45 per transaction versus ₹12-15 at ATMs.

https://www.livemint.com/Money/MZaXTzE9aWgx48ikucqfPN/Indians-keeping-more-cash-reserves-at-home-now-than-they-did.html