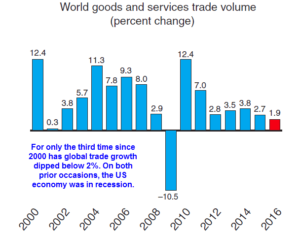
Only the third time since 2000 has global trade growth dipped below 2%. On both prior occasions, the US economy was in recession.


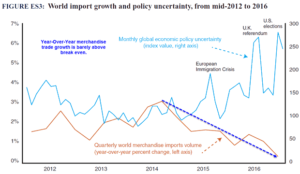
There is a correlation between policy uncertainty and trade growth. Higher the policy uncertainty lower is the Trade growth. Guess what, 2017 started with highest ever policy uncertainty.


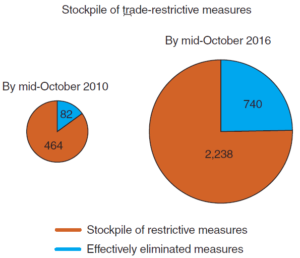
In 2010 there were 464 trade-restrictive measures on deck.
In 2016 there were 2238 trade trade-restrictive measures on deck.
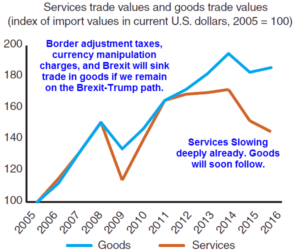
World trade was already slowing before Trump became president http://documents.worldbank.org/curated/en/228941487594148537/pdf/112930-REVISED-PUBLIC.pdf. The new wave of policy uncertainty and trade protectionism does not bode well for Global trade.
Still the US and our markets are scaling new height. How long liquidity can run over fundamental? Can we co-relate when the market crashed in the previous two occasion?
Trump election and trouble in europe led to two things. one market perceived that trump policies are good for inflation hence money moved from bonds to equities and secondly fund managers who were sitting on cash started deploying that cash on top of that accelerating trouble in eurozone led to capital flight from europe and this created a cycle of more money chasing markets. in India post demonetisation savings destined for real estate got diverted into equity markets and sharply lower deposit rates also led to some of this money taking higher risk via equity markets. this is an asset allocation move. i think a correction is coming but no crash simply because retail public whether is US or India is underinvested in equities.