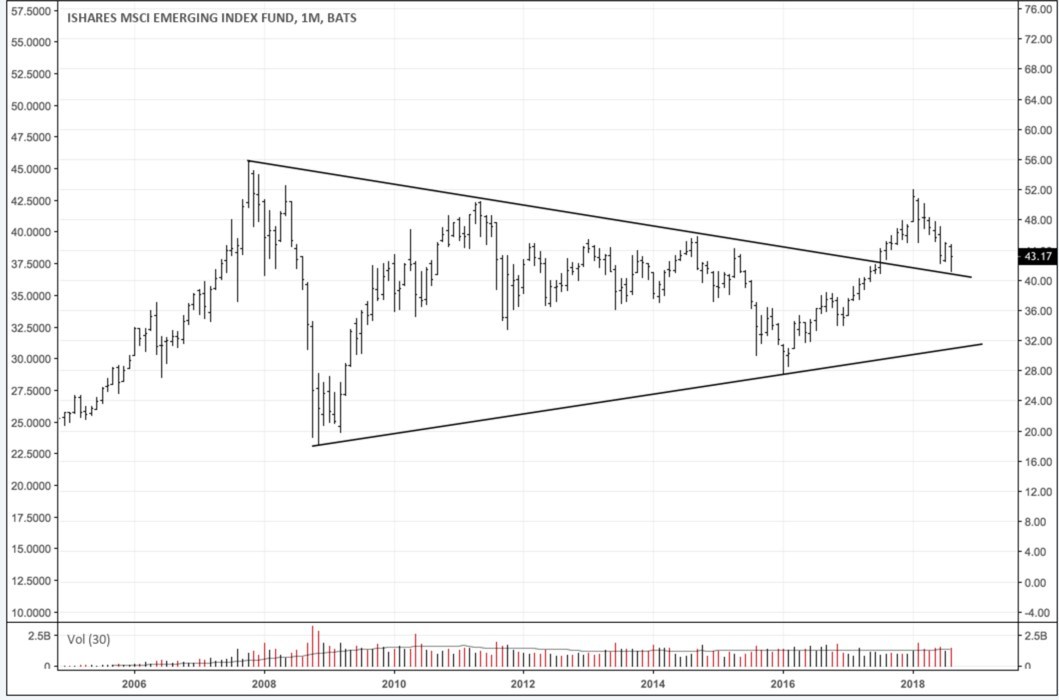
Alex writes….I think this is one of the more interesting charts in markets right now. It’s a monthly of the MSCI Emerging Market Index (EEM). The chart shows EEM breaking out to the upside of a 10-year wedge last year before reversing back down and testing the upper line of support. It’s down approximately 12% on the year.

https://macro-ops.com/one-thing-chinas-slowdown-rough-road-ahead-em/
