Author: Ritesh Jain
₹ 3.4 trillion bank recap since Great Recession but no end in sight
RBI is firm on bottling the inflation genie, but there seems to be no end to the rise of bad loans—₹ 10.3 trillion in June 2018—in the Indian banking system
https://www.livemint.com/Opinion/tWaA6S0QJoqJXFsfwvveNP/-34-trillion-bank-recap-since-Great-Recession-but-no-end-i.html
Across the Aisle: Black to white magic
RBI had done no study or preparatory work; yet the Central Board of RBI hurriedly met on November 8, without an agenda and without a background note, and dutifully “recommended” that the notes may be declared no longer legal tender.https://indianexpress.com/article/opinion/columns/across-the-aisle-black-to-white-magic-demonetisation-notes-ban-rbi-5346695/
Charts That Matter- Vol 23
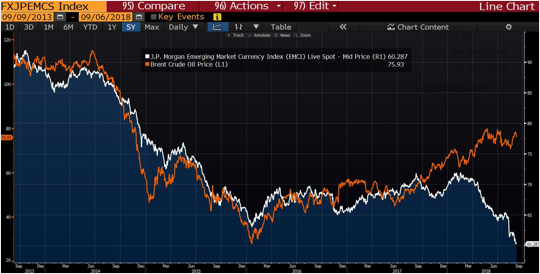
1.Emerging Markets including India are facing a double whammy of falling domestic currency and stable or rising crude oil prices in US Dollar. This is the simple reason that prices at Pump keep rising on daily basis.
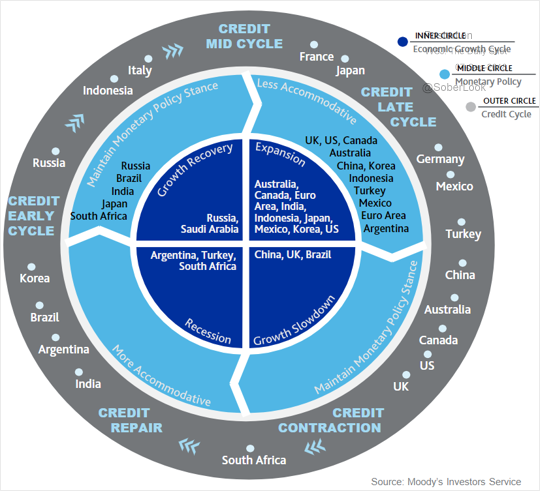
2.The chart by Moody….. according to them India is expanding but also that balance sheet repair is underway. The global liquidity is shrinking fast, which means India might not have enough time left to clean Banking system. The result could be slowing of Indian economy by early next year.
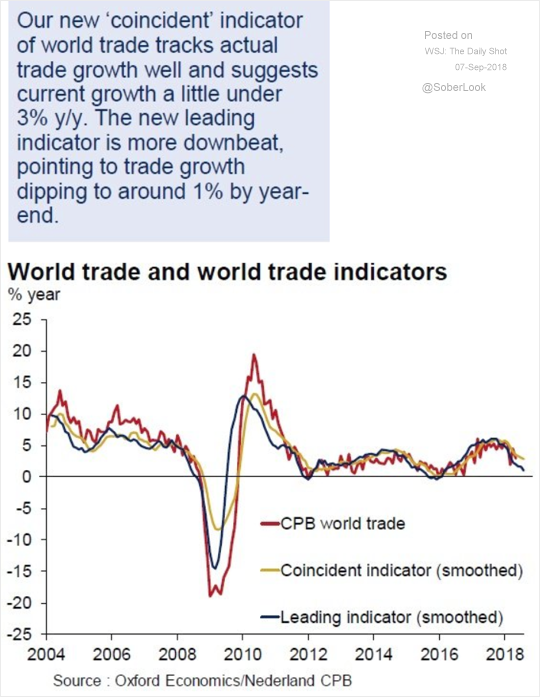
3.It was a matter of time. Global trade activity is finally slowing down. This is Bad for India because our exports are more sensitive to global trade growth than our imports.
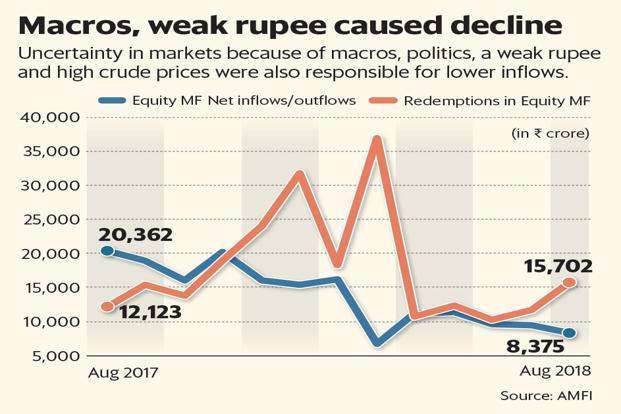
4.Net inflows into domestic mutual funds slowed down to a five-month low in August because of uncertainty in the markets.Data from the Association of Mutual Funds of India (AMFI) showed that net equity inflows saw a steady decline, slipping 11.39% to ₹8,375 crore in August. Equity mutual fund schemes saw an infusion of ₹9,452 crore in July.
However, redemption pressures from mutual funds’ equity schemes also increased in August, jumping 35% as investors opted for profit booking with the markets scaling record highs.
Current Account Deficit at 2.4% of GDP
Key Points
The shortfall represented 2.4 percent of gross domestic product, worse than January-March’s 1.9 percent of GDP, the Reserve Bank of India said in a statement in Mumbai on Friday. It was at $15 billion during the same period last year, or 2.5 percent of GDP
The widening of the CAD on a year-on-year basis was primarily on account of a higher trade deficit at $45.7 billion as compared with $41.9 billion a year ago, the RBI said
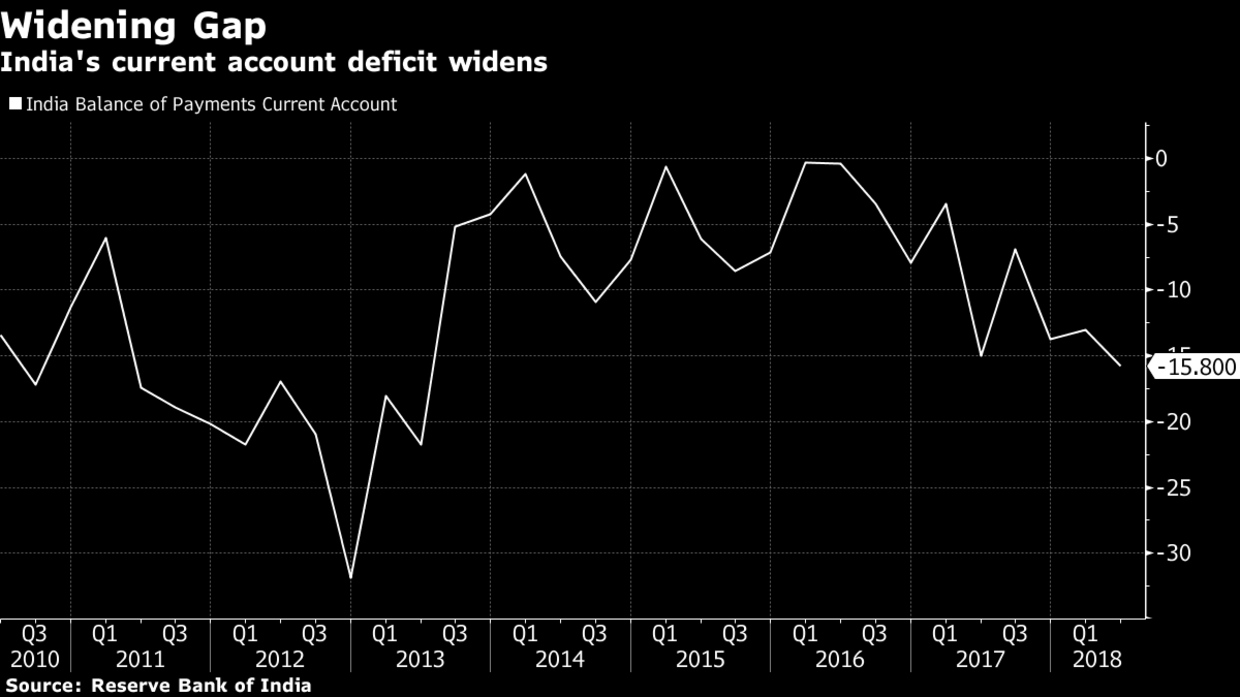
The better than expected reading was on account of higher remittances which grew 16.9%YoY and stood at US$18.8 bn. Higher remittances can be attributed to robust global growth and a pickup in crude oil prices. (remittances from Middle east will continue to be strong till oil prices remain high) Services receipts grew 2.1% YoY supported by software and financial services and stood at US$18.7 bn. Services receipts however declined from US$20.2 bn in the previous quarter.
The balance of payments deficit for Q1FY19 stood at US$11.3 bn largely on the back of FPI outflows of US$8.1 bn ( they are not going to return in a hurry unless US FED reverse course on balance sheet unwinding and stop raising rates) FDI stood at US$9.7 bn , up 36% YoY but still insufficient to offset portfolio outflows ( this is our weak spot and we realise the importance of FDI only when currency becomes volatile). Nirmal Bang expect the CAD for FY19 to be in the range of 2.6-3.0% of GDP, with a BoP deficit of over US$30 bn (too high in current global liquidity squeeze).
India’s twin deficits (fiscal and current account) are likely to keep the INR under pressure as EM contagion risks abound, in an era of quantitative tightening. Central bank might also have to raise the rates more than warranted at the current stage of economic cycle to slowdown the economy and curtail some imported demand
On My Radar: Valuations, Forward Returns and Sandpiles
The Tick Is Clocking For Social Media Giants
Everything you wanted to know about the YIELD curve
There are various interpretations out there of what an inverted yield curve could mean for markets.
There are also pundits out there who say things are different this time around. There is some validity to this, as things are never cut and dry in economics. Besides, this wouldn’t be the first time that global credit markets have acted in strange ways since the crisis.
That all said, the reason the inverted yield curve is a topic of conversation is simple: inverted yield curves have preceded every post-war U.S. recession.

So now you know what the fuss is about – and maybe, just maybe, you’re more inclined to dive deeper into the exciting world of yield curves.
The right side of History
Most investment guys in India would not agree but I strongly believe that what Lewis is writing is the future because we have lost sight of the one which we were supposed to serve in first place and that is INVESTOR
Lewis writes…Mutual fund managers may be on the wrong side of history. I understand that it’s painful for some fund managers to give up the scalable yet opaque mutual fund structure that made so many rich, but how can one fight the arc of the universe towards delivering a solution that is better/faster/cheaper/more transparent/more tax efficient? Do mutual fund managers really want to set themselves in opposition to the best interests of their ultimate clients, wealthy families?
For far too long, these ivory tower investment managers have blithely assumed that their wealthy clients could and would bear the dual costs of a financial advisory fee for the delivery of personalized financial advice and counsel, and the additional burden of a “product manufacturing fee” in the form of the management fees for a mutual fund or an ETF. You need only look at where interest rates are now to understand that those days may be over.
Macro-Economic Dashboard
Summary of observations- Green giving way to Amber and Red
1.August Nikkei Services PMI came at 51.5 vs 54.2 in the previous month, a 5% monthly drop.
2.Sovereign bond yields are at the highest level since 2014 and on top of that most of the borrowing is scheduled in second half .
3.Commercial paper issuances slowing down
4.Current account deficit concerns cropping up ( not in the data).
5. Depreciating currency leading to higher imported inflation
India’s economic data has shown steady improving up till now because of strong combination of consumer spending and govt spending. This is the first time I am having Amber and Red on my radar.


