Idea Vodafone merger explained and land of oligopolies

When Mukesh Ambali’s Jio entered the telecom market last year with free voice calls for life and free data for a limited period, it was clear that a shake-up was imminent in the market. At one point, India’s telecom market had close to a dozen players but competitive intensity had already whittled this number down to three large ones – Bharti Airtel, Vodafone India and Idea Cellular – and less than half a dozen fringe players. So when Jio trooped in with a promise of unlimited freebies and a known appetite to absorb losses, it was apparent that the telecom market pecking order had to change to survive.

If the Vodafone-Idea merger happens, then the merged entity and Bharti Airtel will together control over 70 per cent of India’s telecom market share by revenue.This obviously spells doom for remaining small players in Telecom.

We boast of high GDP growth in this country but a high nominal gdp invites more businesses to compete and reduces barrier to entry as allure of growth allows risk capital to chase and compete with behemoths. what is happening in India is completely opposite. Instead of new businesses starting and creating employment we are creating large oligopolies across sectors ( honestly in a country of 1.3 billion people can u name six paint companies?) and this process seems to be accelerating across sectors.

why everybody loves India

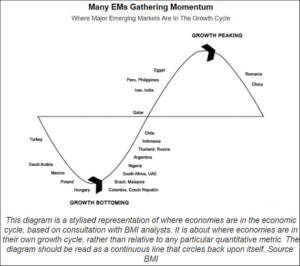
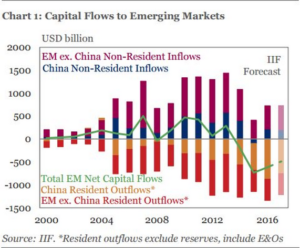
The charts which makes India a darling of emerging market investor

India is somewhere in the cycle where growth will probably be picking up along with host of other emerging economies like Iran,Peru,Egypt etc.Institutional investors like big and deep capital markets with diverse sectors to invest which only India can give. I would have added Iran to this but Trump administration is making investors nervous about investing in Iran

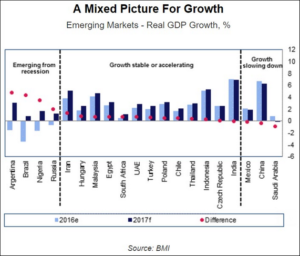
One more chart showing that china is slowing, mexico is out and saudi arabia does not know how to run an economy where budget is made with assumption that oil will remain at USD 80+ FOR ETERNITY. You get my point, why India stands out is that it might be taking time to get our act together but at least are not doing anything wrong.

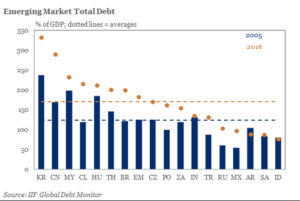
Boy o boy see the debt ( government+private) buildup in some of these emerging countries and they also have huge buildup of dollar denoinated debt. Rising dollar interest rates is not good for growth and in absence of growth some of these countries will face high inflation along with devaluation of their currencies. Again India has not done too badly and debt has remained constant although over last 10 years it is corporate India which has gone on borrowing binge and government borrowing has been controlled .

India is well placed among emerging market peer. A prudent central bank by not cutting interest rates has made India more attractive destination. I wish we could take their investment in real economy which creates real jobs than capital markets , a model championed by china.


A “2cr affordable home is affordable housing” what i read -Economic Times

Believe it or not,in his effort to boost low cost housing, the Finance minister has ended up putting a 2cr home in Parel in affordable housing. Some data on NRI’s investment in Indian real estate and Pakistan has lot of problem despite that Karachi stock exchange has delivered 46% return last year.

Do read and have a great weekend

Signs of desperation in China Town

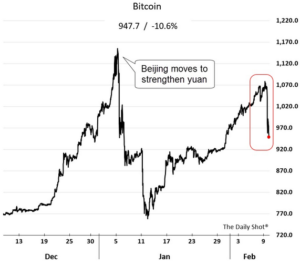
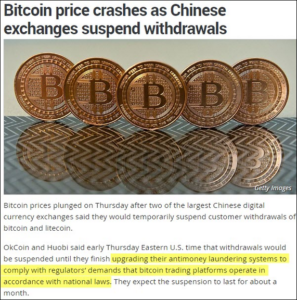
China is showing desperation and has called all Bitcoin exchanges to a closed door meeting looking to shut down the flight of capital from China ( honestly can you think of Indians buying bitcoin to get rid of rupee?)

and this is what happens to Bitcoin

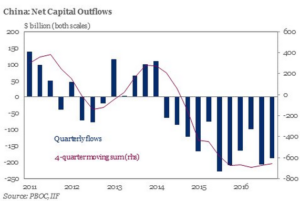
China is looking to deal with the expected trade confrontation with Trump and looking to shut down the flow of capital that has been putting a downward pressure on their currency.

China is heommeraging foreign exchange with its forex reserve down below psychological level of USD 3 trillion

Martin Armstrong writes that China is trying to curb the flight of capital which has contributed to the greenback’s rise for 35 months. However, with Europe tottering on the edge, the next country to withdraw from the EU may set off a collapse of the euro and that will only cause a surge higher yet in the dollar impacting China negatively with regard to trade disputes.

china is between rock and hard place. if they tighten the policy to prevent yuan depreciation domestic economy suffers, if they allow the currency to depreciate Trump will hit them with Trade protectionism.

I believe the next correction in markets will be a function of black swan related event and add this to the long list of potential plack swan created by our central planners


The most valuable brand in each country

Google is the world’s most valuable brand at $109.5 billion – and it is followed closely by other U.S. brands like Apple ($107.1B) or Amazon ($106.4B). However, there are only two non-U.S. brands in the top 10, which are South Korean conglomerate Samsung ($66.2B) and Chinese bank ICBC ($47.8B).

Tata at USD 12.9 billion continues to be the biggest brand in India although it has lost its global ranking from 82 in 2016 to 103 in 2017 .


Value outperformed Growth in 2016…. what does 2017 look like?

In US ,value strategies outperfomed growth in 2016 and so has it in India. The Last one year return of bse 200 is almost 20% and Indian fund managers who have value style beat growth style handsomely . Consider this , the return of an actively managed value strategy mutual fund was almost 30% and a pure growth strategy around 20%. so this is a variation of almost 10% in return of diversified mutual funds over last 1 year.

The golden period of value style fund manager was from 2002-2006. However since 2007 they have heavily underperomed GARP (good and clean balancesheets) strategy every  year except 2012 and 2016.

This article from Gavekal http://blog.gavekalcapital.com/?p=12752 makes a simple point. if the current inflation alarm seems to be a hoax then US bond yield will be headed down and lower inflation means buy growth strategy. if inflation is for real then buy stressed balancesheets and bet on value.fund managers are generally stock pickers and most dont give too much importance to macro enviroment. But what good is buying a company with clean balancesheet in a macro enviroment  which favours value ?

I think US interest rates are headed lower in next couple of months , but over next couple of years inflation and higher rates are baked into our future http://worldoutofwhack.com/2017/01/16/the-gathering-inflation-storm/. so bet on value …… sorry GARP your time is up


The Unintended and Deleterious Societal Consequences of Quantitative Easing

If Brexit was the Bears Stearns moment in the rise of populism,Trump is the Lehman Brothers.Jesse felder writes in this article https://www.thefelderreport.com/2017/01/27/the-unintended-and-deleterious-societal-consequences-of-quantitative-easing/

finally the rich are also suffering as much as poor with slump in high end home prices and Luxury retail stores sales down as much as departmental store

The fact is rapidly growing wealth inequality, rather than boosting the confidence of the wealthy, has had the opposite effect, making them increasingly concerned about its societal ramifications that is why one bull market which continues is in Doomsday Prep for super rich.


Why Indian IT is worried

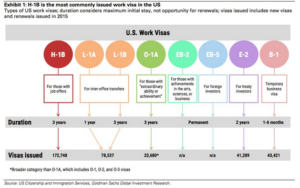
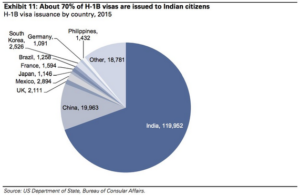
Most common visas issued by US

The breakdown by sector

The breakdown by country

In light of the 85,000 foreign tech workers allowed to be brought into the US annually under the H-1B visa program – a limit, tech companies have been clamoring to raise – here’s a stunning forecast by the Bureau of Labor Statistics:

Employment of computer and information technology occupations is projected to grow 12% from 2014 to 2024, faster than the average for all occupations. These occupations are expected to add about 488,500 new jobs, from about 3.9 million jobs to about 4.4 million jobs from 2014 to 2024, in part due to a greater emphasis on cloud computing, the collection and storage of big data, more everyday items becoming connected to the Internet in what is commonly referred to as the “Internet of things,” and the continued demand for mobile computing.

That’s exciting news. So 488,500 IT jobs requiring more skill, knowledge and education than an average techie will be created over ten years,  about 44,850 a year on average, which means over the same decade, 850,000 H-1B visa holders would come to the US to fill these 488,500 IT jobs…. You get the idea.


The Megacity Economy: How Seven Types of Global Cities Stack Up

Back in 1950, close to 30% of the global population lived in cities.

That since has shifted dramatically. By 2050, a whopping 70% of people will live in urban areas – some of which will be megacities housing tens of millions of people.

This trend of urbanization has been a boon to global growth and the economy. In fact, it is estimated today by McKinsey that the 600 top urban centers contribute a whopping 60% to the world’s total GDP.

SEVEN TYPES OF GLOBAL CITIES

With so many people moving to urban metropolitan areas, the complexion of cities and their economies change each day.

The Brookings Institute has a new way of classifying these megacities, using various economic indicators.

According to their analysis, here’s what differentiates the seven types of global cities:

1. Global Giants
These six cities are the world’s leading economic and financial centers. They are hubs for financial markets and are characterized by large populations and a high concentration of wealth and talent.

Examples: New York City, Tokyo, London

2. Asian Anchors
The six Asian Anchor cities are not as wealthy as the Global Giants, however they leverage attributes such as infrastructure connectivity and talented workforces to attract the most Foreign Direct Investment (FDI) out of any other metro grouping.

Examples: Hong Kong, Seoul, Singapore

3. Emerging Gateways
These 28 cities are large business and transportation hubs for major national and regional markets in Africa, Asia, Latin America, and the Middle East. While they have grown to reach middle-income status, they fall behind other global cities on many key competitiveness factors such as GDP and FDI.

Examples: Mumbai, Cape Town, Mexico City, Hangzhou

4. Factory China
There are 22 second and third-tier Chinese cities reliant on export manufacturing to power economic growth and international engagement. Although Factory China displays a GDP growth rate that is well above average, it fails to reach average levels of innovation, talent, and connectivity.

Examples: Shenyang, Changchun, Chengdu

5. Knowledge Capitals
These are 19 mid-sized cities in the U.S. and Europe that are considered centers of innovation, with elite research universities producing talented workforces.

Examples: San Francisco, Boston, Zurich

6. American Middleweights
These 16 mid-sized U.S. metro areas are relatively wealthy and house strong universities, as well as other anchor institutions.

Examples: Orlando, Sacramento, Phoenix

7. International Middleweights
These 26 cities span across several continents, internationally connected by human and investment capital flow. Like their American middleweight counterparts, growth has slowed for these cities since the 2008 recession.

Examples: Vancouver, Melbourne, Brussels, Tel Aviv

Schroders Economic and Strategy Viewpoint

Macro Summary Feb 2017
Global growth is expected to come in at 2.6% in 2016 as a result of a better than expected outturn for Q3 and continued momentum in Q4. The growth forecast for 2017 has been upgraded to 2.8%, led by a more optimistic view on the emerging markets, the UK (smaller Brexit effect than expected) and the US (boost from fiscal loosening). Inflation rises modestly due to higher oil prices. In 2018, global growth is expected to accelerate to 3% thanks to the full impact from fiscal loosening in the US, and falling inflation in Europe helping to boost demand.
The US Fed is expected to raise rates twice in 2017 taking fed funds to 1.25% by end year. With growth strengthening and inflation rising, the pace of tightening is expected to increase in 2018 with four rate hikes taking the policy rate to 2.25% by end year.
UK inflation is set to rise sharply due to the fall in the pound, which will reduce disposable income of households and encourage cuts in spending. Investment is already weak, and has started to impact employment. The BoE is expected to remain on hold, constrained by higher inflation. Growth remains below trend in 2018 causing unemployment to rise.
Eurozone growth is set to ease in 2017 as a temporary rise in inflation constrains household spending. Political uncertainty will also weigh on business investment, though we assume the establishment holds on to power. The outlook for 2018 is more promising as inflation falls back, and external performance is boosted by better growth elsewhere. The ECB should maintain low rates and QE beyond the end of 2017, but will come under pressure to tighten.
Japanese growth forecast at 1.4% in 2017 and inflation at 0.8% supported by looser fiscal policy and a weaker yen. No further rate cuts from the BoJ, but more QE is expected as the central bank targets a zero yield for the 10 year government bond.
Emerging economies benefit from modest advanced economy demand growth and firmer commodity prices, but tighter US monetary policy weighs on activity. Concerns over China’s growth to persist, further fiscal support and easing from the PBoC is expected. Risks • Risks skewed towards weaker growth on fears of secular stagnation, political risk in Europe and a US recession. Inflationary risks stem from more aggressive Trump policy on tax cuts and trade.
economic-strategy-viewpoint-schroders-february2017