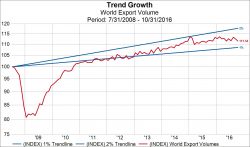
World Trade has Increased by Less Than 1% Annually Since 7/07

There are fears that the world is on the precipice of turning back the clock on globalization. In some ways, the case can be made globalization has been retreating since the financial crisis. One of the strongest supporting data points of that argument is world trade data. According to the CPB World Trade Monitor, the value of world exports (volume * price) has increased by less than 1% annually since making a high on 7/31/2007 compared to more than a 5% annualized growth rate since 1991.This is before the new wave of protectionism guaranteed by Trump administration.

Newgate Absolute return fund…. Why we like commodity companies

The letter, which is available on company website outlines eight reasons for investment in resources

Newgate finds clear evidence of a synchronised recovery in the global economy at a time when there is genuine supply side restraint creating a perfect storm of rising prices

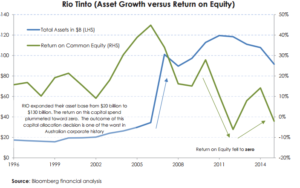
The current supply/demand environment is, a result of the commodity industry’s own mistakes. The resources boom, which took place between the early 2000s and 2014 was fuelled by China’s insatiable demand for commodities. However, commodity companies added new capacities at record high prices for industrial and bulk commodities pushing up input prices such as labor and materials to a point where capital costs of expansion were much greater than originally forecast. The world’s largest iron ore producer, Rio Tinto is a great example of this colossal value destruction. Newgate points out that between 2005 and 2015 Rio increased its asset base from $20 billion to $130 billion but over the same period return on equity collapsed from a high of 45% in 2005 to a low of -5% in 2012 and is currently around 0%.

“In very simple terms, one of the greatest resource booms in recorded economic history was squandered by the poor decisions made by the leadership of major global resource companies.  They outlaid too much to expand supply, and when the increased production entered the market major price falls saw dreadful project economics.”

As commodity prices plunged and costs remain elevated, many small highly leveraged commodity companies were pushed into bankruptcy, and some of the world’s largest commodity trading houses such as Glencore and Noble were forced to issue new capital and deny accusations they were close to running out of cash.

To make our argument for an investment in resource companies we detail eight related justifications. 1. Economic outcome of the resources boom 2. Existential crisis of the resources industry 3. Psychological impact on leadership 4. Recovery period: value over volume 5. China capacity closures to protect the environment 6. Chinese fixed asset investment 7. Global growth is recovering strong 8. Animal spirit yet to emerge

 Newgate points out that the commodity industry has now entered a new phase of capital preservation and risk aversion particularly in those companies which experienced a near death experience. It is the view of analysts at Newgate that resource company leadership are now a highly risk-averse group, and this will not change for the foreseeable future. They believe it could be up to a generation before resource companies embarked upon another round of value destroying capital expenditure, merger, and acquisitions.
 

 “History will tell us that eventually resource companies will react to sustainably high prices by increasing supply.  Nonetheless, because of the recent experience of resource company leadership we may be in a situation for many years where resource companies are content generating excessive cash flow and rewarding shareholders, rather than increasing supply.”

China is the wild card in resource markets. The country is a key producer of bulk commodities such as iron ore and coal, and many loss-making companies have been kept alive by cheap funding, allowing them to continue to produce even though traditional economics’ dictates they should collapse and take supply out the system. For the first time, China began to reform its commodity industry last year, closing excess supply to improve the overall health of the economy and reduce bad debts. Newgate expects this trend to continue over 2017 improving the supply-side picture. At the same time, the fund’s analysts believe the country’s consumption of bulk commodities will continue to grow at a steady rate for the foreseeable future.

Overall then, Newgate is highly optimistic about the outlook for commodity prices and commodity companies going forwards. Here is the concluding paragraph of Newgate’s January newsletter to sum up:

“Our conclusion is that the recent harsh lessons of the previous cycle means a supply response to high commodity prices may be very slow.  This in turn may mean commodity prices remain elevated for longer than expected, allowing resource companies to enjoy heavy cashflows that can be paid out to shareholders over 2018 and 2019 and beyond.

Despite the excellent performance from resource companies over calendar year 2016, we still assess that it is a mildly contrarian investment.  Many market participants are sceptical about current commodity pricing and are unwilling to invest in the sector, particularly after such strong performance over calendar year 2016.

We concede that some of our arguments may be wrong (in particularly Chinese demand and their fiscal position), and we will be tracking our thesis closely, but on the balance of probabilities, we believe it is time to be optimistic on global cyclical companies, particularly resources.”

I think if we add a mix of protectionism to Newgate’s arguments, it creates a potent mix of rising and volatile commodity prices which can have unintended consequence of rising inflation.
Cars may soon own themselves. And their numbers may drop 90%

Two emerging technologies that are rapidly becoming mainstream. The first which we all know,is the self-driving vehicle, guided to the quickest route by real-time traffic updates and to the next customer by real-time passenger requests.

The second is blockchain-enabled, secure peer-to-peer (P2P) transactions that eliminate or minimize the need for centralized authorities such as banks or ride-sharing services such as Uber and Lyft. The security of blockchain will allow owners to directly rent out their vehicles under terms and conditions they set themselves.

What does the tax data tell us about state of Indian economy

In a press release published on January 9, the central government reported the following increases in tax collections during April-December 2016, compared to the corresponding period of previous year:

  1. Central excise duty: 43 percent.
  2. Service tax: 23.9 percent.
  3. Customs duty: 4.1 percent.
  4. Corporation tax: 4.4 percent.
  5. Income tax: 24.6 percent.

These are large values. Holding other things constant, they suggest buoyant economic activity. But as Suyash Rai writes, when looking at tax data, we have to look at the extent to which other things are indeed constant. When analysing tax data, in order to read the state of the macroeconomy, we need to adjust for the part of the tax revenues which are on account of ‘Additional Revenue Mobilisation’ (ARM). Two kinds of ARM are:

  1. An increase in tax rate: additional revenues due to higher rate do not indicate robustness of the underlying activity.
  2. An administrative measure: additional revenues from one-time administrative measures (eg. a tax amnesty scheme) may not reflect the underlying economic activity.

Let us walk through the major taxes, and see what we can tell, and what we do not know.

Excise duty

The biggest increase in tax collection has come from excise duty. The collection during April-December 2016 was 43 percent higher than the corresponding period in 2015. Collection grew by 45 percent in April-October, 33.7 percent in November, and 34.8 percent in December, compared to the corresponding periods of previous year. Without ARM the numbers are flat as shown below.

Increase in excise duty collection (in percent) April-Oct Nov Dec
With ARM 45 33.7 34.8
Without ARM (estimate) 4.22 0 NA


Service tax

During April-December, 2016, service tax collections were up 23.9 percent compared to the corresponding period last year. During April-October, the increase was 27 percent, while it decelerated to 15.5 percent for November and 3.67 percent for December. This deceleration is significant, but we need to understand the increase without ARM.


Increase in service tax collection (in percent) April-Oct Nov Dec
With ARM 26.9 15.52 3.67
Without ARM (estimate) 17.1 10 0.22


Customs duty

During April-December 2016, customs duty collection has increased by 4.1 percent, compared to the same period in 2015. During the corresponding period in previous year, the growth in collection was 17 percent. For November 2016, collection increased by about 16 percentHowever, for the month of December, the customs collection was 7.6 percent lower than the same month in 2015

Corporation tax

Corporation tax collection during April-December was 4.4 percent higher than the corresponding period last year. Last year, during the same period, the growth in corporation tax collection was 11.74 percent. Collection in December 2016 was 4.7 percent lower than that in December 2015.

Income Tax

During April-December, income tax collection was 24.6 percent higher than that in the corresponding period of 2015. However, a key factor here is the income declaration scheme that ended on September 30, 2016, and had mandated payment of tax, surcharge and penalty by November 30, 2016. The expected tax inflow from the scheme was about Rs. 30,000 crore. This is a form of additional revenue mobilisation. Hence, unless we know the increase without this ARM, it is difficult to interpret the number. For instanceif Rs. 25,000 crore was collected under the scheme, the increase in income tax collection during April-December would be just over 8.3 percent.

Conclusion

The analysis presented by Suyash Rai here suggests that the reading of tax collection numbers as signifiers of robust economic activity may be too optimistic.

Read Full article

The Global War on Cash

The number of Digital transactions globally have doubled between 2010 and 2015 thanks to the convenience of new technologies like online banking ,smart phones, Intermediaries and cryptocurrencies.There is a global push by lawmakers to eliminate the physical cash around the world under the guise of fighting criminal activities or terrorism. I think the sole purpose of war on cash is to increase tax collection

The Long Dollar Trade reverses

The WSJ on Monday night ran a story where Mr. Trump said he was not at all pleased with the “too strong Dollar

The Dollar has way too many brand-new bulls, is at a serious resistance area, and needs to sell off first, to be able to get thru that serious resistance area. The sentiment in the Dollar and the stock market has been, “what can possibly go wrong”. And the sentiment in bonds and gold has been, “what can possibly go right”. So this selloff in the Dollar is exactly what it needed to do.

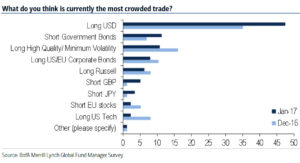
Bank of America Merrill Lynch released the results of its global fund manager survey for January which showed long US dollars was by far considered the most crowded trade. Almost half of the survey participants (47%) viewed long USD as crowded and the next most crowded trade was seen a short government bonds, see below:

I believe the trumflation will take breather for sometime and volatility will rise as this trade reverses.

India’s central bank must work fast to salvage reputation

Governor Urjit Patel’s job is to protect the RBI’s reputation, not the government’s. He’d be wise to start acting like it.Even Market volatility is all about confidence in central bank and Indian currency, bonds and equity markets have shown resilence and low volatility simply because of confidence in central bank and its previous governor . its high time Dr Patel gives that confidence to markets.


what lessons can we learn from first wave of AI

The one thing which is common in Health and life science, retail, manufacturing and financial services is history of generating and storing vast amounts of data – the essential building block for Artificial Intelligence. AI is drafting and reviewing legal documents with immaculate precision. It is even trading using indices derived from satellite imagery  (this is amazing). Sprinkle some AI dust on anything, it seems, and it is reborn.

How Google Tracks You – And What You Can Do About It

Ever get the feeling you’re being watched?

It’s because you are – and for a rough proxy of this, use the browser extension Ghostery to see how many tracking scripts are watching you on a typical media site. (It doesn’t work for everything, but a large media site like Vice.com has 50+ trackers, with 40 of them focused on advertising).

Capturing this user data helps sites sell their inventory to advertisers, but a select few companies operate in this capacity at a whole different level. Google and Facebook are the best of examples of this, as nearly $0.60 of every dollar spent on digital advertising goes to them. They both have the sophistication and ubiquity to capture incredible amounts of information about you.

GOOGLE IS EVERYWHERE