Hoisington Quarterly review

Lacy Hunt writes….The parallels to the past are remarkable, but there appears to be one fatal similarity – the Fed appears to have a high sensitivity to coincident or contemporaneous indicators of economic activity, however the economic variables (i.e. money and interest rates) over which they have influence are slow-moving and have enormous lags. In the most recent episode, in the last half of 2018, the Federal Reserve raised rates two times, by a total of 50 basis points, in reaction to the strong mid-year GDP numbers. These actions were done despite the fact that the results of their previous rate hikes and monetary deceleration were beginning to show their impact of actually slowing economic growth. The M2 (money) growth rate was half of what it was two years earlier, signs of diminished liquidity were appearing and there had been a multi-quarter deterioration in the interest rate sensitive sectors of autos, housing and capital spending. Presently, the Treasury market, by establishing its rate inversion, is suggesting that the Fed’s present interest rate policy is nearly 50 basis points too high and getting wider by the day. A quick reversal could reverse the slide in economic growth, but the lags are long. It appears that history is being repeated – too tight for too long, slower growth, lower rates.

Read Full report below

http://www.hoisingtonmgt.com/pdf/HIM2019Q1NP.pdf

Fear of Inflation and sterilisation

Martin Armstrong writes…..
There is a major confrontation where central banks have expanded the money supply to “stimulate” inflation. Governments are obsessed with enforcing laws against tax evasion and it is destroying the world economy and creating massive deflation.

Therefore, in the ’30s, Milton’s criticism of the Fed was justified because there was no massive hunt for taxes from the fiscal side. Today, we have the fiscal policies hunting capital resulting in a contraction economically (declining in investment) while you have QE just funding the government – not the private sector. It is a different set of circumstances today v 1930s.

read full post below

https://www.armstrongeconomics.com/armstrongeconomics101/economics/fear-of-inflation-sterlization/

A world set Adrift

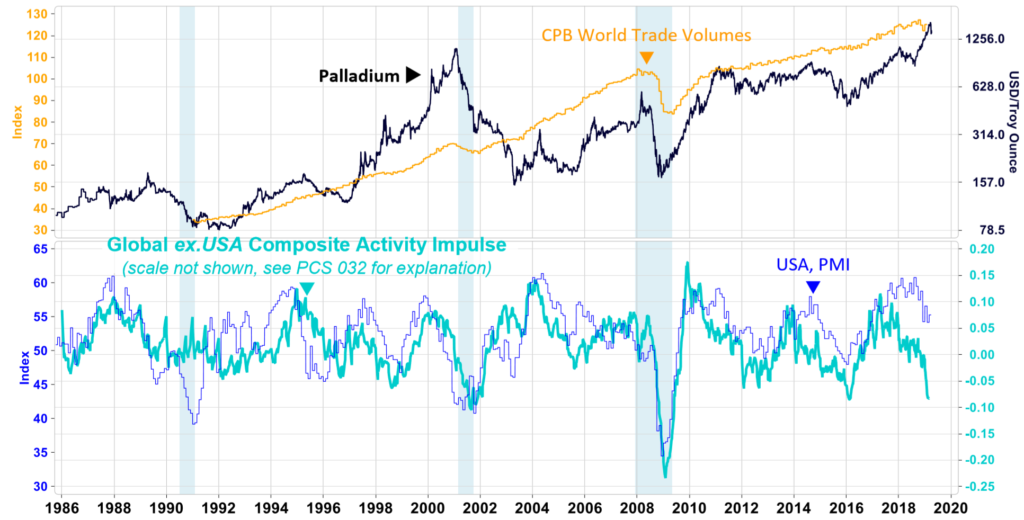
Prerequisite Capital writes….Palladium, although considered a precious metal, is used extensively in cars and electronic goods around the world… as such, its major tops tend to coincide with tops in the global economic cycle – and as compared to our leading indicator for global growth (featured in our previous Quarterly Letter) and also the US PMI, it seems it might be ringing the bell at the top of the growth cycle presently?

Read Full quarterly client briefing below

Click Here

Elliott Wave: Fed Follows Market Yet Again

By Steve Hochberg and Pete Kendall

Back in December, we wrote an article titled “Interest Rates Win Again as Fed Follows Market.”

In the piece, we noted that while most experts believe that central banks set interest rates, it’s actually the other way around—the market leads, and the Fed follows.

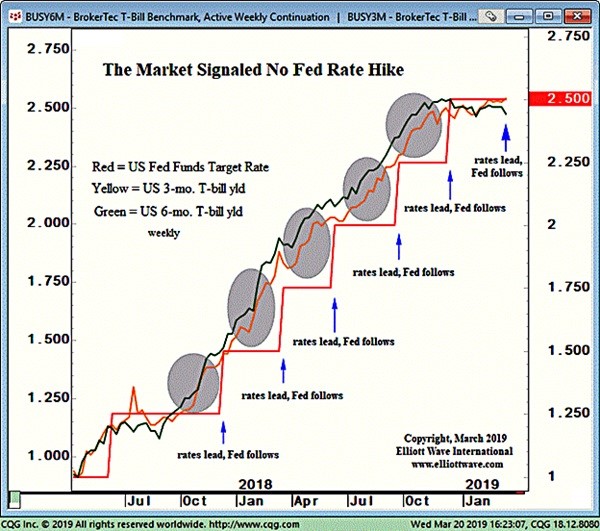
We pointed out that the December rate hike followed increases in the six-month and three-month U.S. Treasury bill yields set by the market. What happened with this week’s Fed announcement? Well, you guessed it—the Fed simply followed the market yet again

The chart above is an updated version of the one we showed in our last article. The red line is the U.S. Federal Funds rate, the yellow line is the rate on the 3-month U.S. T-bill and the green line is the rate on the 6-month U.S. T-bill. The latter two rates are freely-traded in the auction arena, while the former rate is set by the Fed.

Now observe the grey ellipses. Throughout 2017-2018, the rates on 3-and-6-month U.S. T-bills were rising steadily, pushing above the Fed Fund’s rate. During the period shown on the graph, the Fed raised its interest rate six times, each time to keep up with the rising T-bill rates. The interest-rate market is the dog wagging the central-bank tail.

Now note what T-bill rates have been doing since November of last year; they’ve stopped rising. Rates have moved net-sideways, which was the market’s way of signaling that the Fed would not raise the Fed Funds rate this week.

Too many investors and pundits obsess over whether the Fed will raise or lower the Fed Funds rate and what it all supposedly means. First, if you want to know what the Fed will or will not do, simply look at T-bills, as shown on the chart. Second, whatever their action, it doesn’t matter because the Fed’s interest-rate policy cannot force people to borrow.

See Chapter 3 of The Socionomic Theory of Finance for more evidence.

The Relationship Between Yellow Vests and Electric Vehicles

Geohring & Rozencwajg writes “There has never been an instance in the history of civilization where a new technology with inferior “energetics” has replaced an older technology with superior “energetics.”

While in southern France last year, my wife and I had multiple contacts with the “yellow vests” as we drove from the Spanish border to Perpignan and Carcassonne. We experienced first-hand the agitation generated by the French government’s decision to raise the tax on diesel fuel. At many of the motorway’s toll booths, the “yellow vests” had broken the toll barriers and blockaded the use of both entrance and exit ramps. As we tried to move through the broken toll barriers, we were forced by mobs that many times exceeded 50 demonstrators to pay bribes to both enter and exit from the motorways. Although the ensuing “yellow-vest” riots in Paris garnered significant media attention, we at Goehring & Rozencwajg are fascinated by the media’s contortions to avoid discussing the underlying reasons for the uprisings.

In past letters, we have laid out two possible scenarios for the widespread adoption of electric vehicles: either the governments would heavily subsidize EV purchases (as Norway does today) or tax (or outright outlaw) the purchase and use of internal combustions engines (ICEs). Our Q1 2018 letter discussed how unfavorably the “energetics” of the EV compare to those of the internal combustion engine. Because of an EV’s inferior energetics, it costs more to purchase and run an EV than an ICE passenger car—a situation we believe will continue even with anticipated advances in battery technology. We also pointed out that there has never been an instance in the history of civilization where a new technology with inferior “energetics” has replaced an older technology with superior “energetics.” As an example, we like to bring up the plight of the Concorde supersonic transport jet.

Developed for billions of dollars in the late 1960s by a consortium of European governments, the Concorde was a technological marvel that cut the flying time between Europe and the United States in half. The plane became a favorite of the Hollywood elite, rock stars, and investment bankers, but after 27 years of being heavily subsidized by British Airways and Air France, the Concorde disappeared. Why? The answer is simple: the Concorde tried to replace an older technology (in this case the subsonic jet) with a new technology with vastly inferior “energetics.” Although the Concorde cut flying time in half, it required 900 liters of fuel per passenger to fly between London and New York. The Boeing 747, flying the same route, required only 250 liters of fuel per passenger. Even with the benefit of a quicker flight, the inferior “energetics” of the Concorde raised the cost far above what the average transatlantic passenger could bear.

Although not completely comparable, we believe we are in a similar situation today with the EVs versus ICEs. On a strict purchase and operating cost basis, the average consumer would never buy an EV. But in one way, the Concorde and EV look the same. Buyers of EVs at present (using Teslas here in the US, for example) are rock stars, Hollywood elites, and investment bankers. Although it’s still early in the EV evolution, seeing Tesla buyers who look just like former Concorde users is something our study of “energetics” would strongly suggest would happen.

So now, unsurprisingly, a major problem has emerged in the French government’s push to force out and possibly outlaw the internal combustion engine. Huge segments of the population are starting to rebel as the true cost of EV ownership becomes more transparent. The cost to switch to EVs can be absorbed by rich people, but what of the cost to the average French citizen? We have repeatedly told our investors that the switch to electric vehicles could be potentially extremely painful. At some point, the true cost and resulting pain will become apparent. The working-class people of France are now beginning to feel and rebel against these costs, even though the introduction of high cost EVs into France hasn’t even started in earnest.

Next week, we will continue along this theme and discuss how the “yellow vests” and similar movements may result in heightened scrutiny on EVs and the true costs of undertaking these ventures. Further, we will examine how this could have a material impact on future oil demand growth.

This blog contains excerpts of our in-depth commentary “OIL BULL MARKETS PAST & PRESENT, AND YELLOW JACKETS”.  If you are interested in this subject, then you may

download the full commentary here   

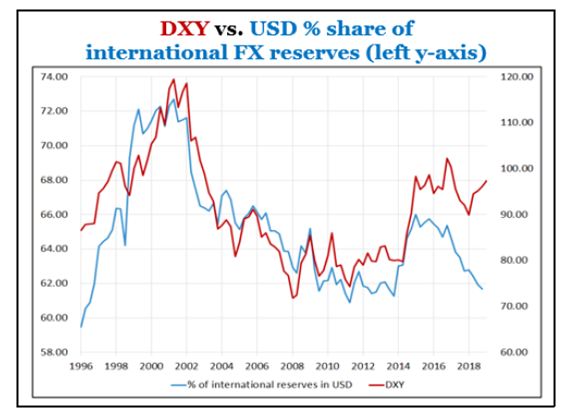
US$ rallies as central bankers sell Dollar

Martin Armstrong explains that the situation with USD is almost exactly the same as it was in 1927….He writes
The Fed lowered the rates in 1927. Then as the capital inflow really intensified and began pouring into the USA because of European politics, the Fed nearly doubled the interest rates into 1929 without succeeding in preventing the stock market rally. The Fed will most likely make the same mistake once again following Keynesianism. Expect them to chase the stock market raising rates and ignoring the rest of the world because the Democrats will blame the low rates of the Fed as benefiting the rich.

Read Full article below

https://www.armstrongeconomics.com/markets-by-sector/foreign-exchange/usd/us-rallies-as-central-banks-sell-dollars/

Best Puppet Show Ever

361 Capital Market Commentary | April 1, 2019

Bond investors liked it. Stock investors loved it. The President and White House pulled the strings perfectly so that it appeared that the Federal Reserve Board members were not acting out of their own accord. The magnificent performance began at the end of December and after a few missteps and crossed strings, the show ran perfectly. First, the Fed puppets conveyed that they would stop shrinking the balance sheet and then that they would stop raising the Fed Funds rate. Some even suggested that rate cuts were behind the curtain. Investors clapped and cheered like little kids at a Punch and Judy show and the financial markets roared to their best first quarter in years.

So what did we learn the last four months?
Rule #1: Don’t fight the Fed.
Rule #2: The POTUS wants to be re-elected.
Rule #3: This Fed is completely controlled by the POTUS.

Bottom line is that the Fed is being HEAVILY pressured to cut interest rates over the next two years. And if they don’t do it then their TV talking head replacements will do it for them. As short-term rates are cut, the economy will get more pumped, scaring longer term fixed income investors which should then steepen the yield curve. Even though the curve just inverted last month, that is probably the last we will see of it unless credit breaks. Economic data should start to improve through the summer, unless the trade wars and a closed Mexican border impede global commerce. The equity markets are trying to tell you that the economy is going to get better. The Treasury bond markets disagree, but the Credit markets choose the side of equities.

I didn’t foresee the White House calling all the shots at the Fed. I thought in November that an independent Fed would remain on track to build up reserves for the next credit crisis. When the Govt shutdown stopped the economy and the markets fell apart in December, I thought that it was prudent to be overly cautious. So the quick caving of the Fed in December caught me flat footed and under-invested in U.S. equities in the first quarter. I applaud any investor who was positive in both December and in the Q1.

From here, you have to have some risk on the books. I want my tallest stack of chips to be in the Emerging Markets which have a valuation advantage, a shot at more green shoots and a potential U.S./China trade deal. But with short-term rates falling and the curve steepening, you will have a tailwind to most equity sectors and geographies. Among U.S. sectors, plenty of great companies to own in the Technology and Consumer spaces. Be picky in Healthcare with all the moves and battles in Washington. And of course, I still want to own bonds, but maybe a bit shorter in maturity now. Also would stick to higher quality but still surprised by how well junk bonds have done. With inflation looking grim in Europe and now in the U.S., a big tailwind for Gold might be gone so I wouldn’t have many chips there. These are crazy times. This show has more twists than a Jordan Peele film so sit back and try to enjoy it

The White House absolutely owns the Fed right now…

https://361capital.com/weekly-briefing/best-puppet-show-ever/?utm_source=wrb&utm_medium=email&utm_campaign=04012019&utm_content=p

Buyback Hangover

The end of Q1 is almost here and gears are shifting to blend into the buyback blackout period that awaits for us. A slowdown is lurking in ambush and investors who were once dancing in the sparkling highs of S&P500 are now having cold feet. Markets have become so accustomed to Buybacks that a blackout period pose a threat to equity markets in general.

2018 has seen the highest record share repurchases and have rallied 20 percent from its December lows. However, for many investors now is the dreaded time when earnings are announced and companies 5 weeks prior to the reporting and 48 hours after cannot be involved in discrete buyback program punching the demand, as a result of which about 40% of the S&P500 companies will be hit.

The amounts of BBB rated credits is at all time high and those companies are jumping out of the frying pan and into the inferno if they choose to reduce their capex and increase their buybacks which in next recession can seriously challenge their credit ratings

Salt meets wound. To add to this wound, the downward market correction would be incited by the new proposals by senators regarding restricted buyback activity in the corner. Pension fund rebalancing instigating quarter end selling is also nudging investors to go underweight in their positions.

Good Bad or Ugly?

Bespoke writes….Stocks have basically held the line this week despite huge moves in interest rates and an ongoing rough run for global economic data. The curve inversion has many forecasting a recession, and we’ve seen a number of recent data releases that make us much more nervous about that outcome than we have been in almost a decade. On the other hand, the pivot to dovishness from global central banks, the relatively modest size and scale of yield curve inversion, some nascent signs of bottoming in global growth, and the nature of the plunge in interest rates are all reasons to not panic. Besides, despite all of the negativity, US stocks have held up admirably well, and markets that trend higher on bad news are generally regarded as strong, rather than weak. In short, the outlook could be Good, Bad, or Ugly…depending how you read the tea leaves!

Everything Rally

Doug Noland writes……From the global Bubble perspective, it was one extraordinary quarter worthy of chronicling in some detail. The “Everything Rally,” indeed. Markets turned even more highly synchronized – across the globe and across asset classes. As the quarter progressed, it seemingly regressed into a contest of speculative excess between so-called “safe haven” sovereign debt and the Bubbling risk markets. It didn’t really matter – just buy (and lever) whatever central bankers want the marketplace to buy (and lever): financial assets.

March 29 – Bloomberg (Cameron Crise): “While the total return of the S&P 500 is going to end this month roughly 2% below its closing level in September, a 60/40 portfolio of equities and Treasuries is ending March at all-time highs. Even a broader multi-asset portfolio using an aggregate bond index rather than simply govvies is closer to its high watermark than stocks. Similar to equities, balanced portfolios have enjoyed a stunning quarterly return. The broad balanced portfolio mentioned above returned nearly 8%, its best since 2011.”

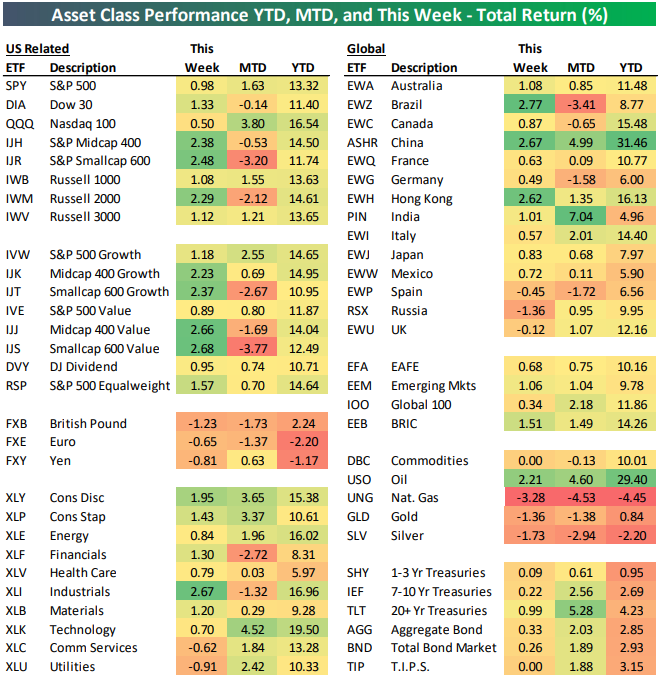
According to Bloomberg (Decile Gutscher and Eddie van der Walt), it was the best FIRST quarter for the S&P500 since 1998 (strongest individual quarter since Q3 2009); for WTI crude since 2002; for U.S. high-yield Credit since 2003; for emerging market dollar bonds since 2012; and for U.S. investment-grade Credit since 1995. According to the Wall Street Journal (Akane Otani), it was the first quarter that all 11 S&P500 sectors posted gains since 2014.

March 29 – Financial Times (Peter Wells, Michael Hunter and Alice Woodhouse): “Driven mostly by Wall Street, global stocks ruled off on their largest quarterly advance since 2010. The climb over the past three months was sealed on Friday on hopes for progress in US-China trade talks that resumed in Beijing, while a rally in sovereign bonds eased. The FTSE All World index has risen 11.4% so far in 2019, its biggest quarterly increase since the September quarter of 2010.”

The S&P500 returned 13.6% for the quarter, a stunning reversal from Q4 – yet almost blasé compared to gains in “high beta”. The Nasdaq100 returned 16.6%. The Nasdaq Industrials rose 15.8%, the Nasdaq Computer Index 18.7%, and the Nasdaq Telecom Index 18.3%. The Semiconductors jumped 20.8%, and the Biotechs rose 21.5%. And let’s not forget Unicorn Fever. Money-losing Lyft now with a market-cap of $22.5 billion. Up north in Canada, equities were up 12.4% for the “best first quarter in 19 years.”

The broader U.S. market gave back some early-period outperformance but posted a big quarter all the same. The S&P400 Midcaps jumped 14.0% and the small cap Russell 2000 rose 14.2%. The average stock (Value Line Arithmetic) gained 14.3% during the quarter. The Bloomberg REITs index rose 15.8%, and the Philadelphia Oil Services Sector Index jumped 17.5%. The Goldman Sachs Most Short Index gained 18.5%.

What conventional analysts fancy as “Goldilocks,” I view as acute Monetary Disorder and resulting distorted and dysfunctional markets. For a decade now, coordinated rate and QE policy has nurtured a globalized liquidity and speculation market dynamic. Securities markets have come to be dominated by an unprecedented global pool of speculative, trend-following and performance-chasing finance. The extraordinary central bank-orchestrated market backdrop has over years incentivized the disregard of risk, in the process spurring the move to ETF and passive management – along with a proliferation of leverage and derivatives strategies.

The end of the quarter witnessed the first inverted Treasury yield curve (10-year vs. 3-month) since 2007. Ten-year Treasury yields sank 28 bps to close the quarter at 2.40% vs. three-month T-bills ending March at 2.34% (down 7bps y-t-d). The quarter saw two-year Treasury yields drop 23 bps (2.26%), five-year yields 28 bps (2.23%), and 30-year yields 20 bps (2.81%). Five-year Treasury yields dropped an amazing 28 bps in March alone (10-year down 31bps). German 10-year bund yields dropped 31 bps during the quarter to negative 0.07% – the low since September 2016. Japan’s 10-year government yields fell another eight bps to negative 0.08%. Swiss 10-year yields dropped 13 bps to negative 44 bps.

March 28 – Financial Times (Robert Smith): “The amount of government debt with negative yields rose back above the $10tn mark this week, as central banks abandoned plans to tighten monetary policy. The idea of investing in bonds where you are guaranteed to lose money — if you hold them to maturity — has always seemed paradoxical. But it begins to make sense in a world where you are sure to lose even more money if you stick the cash in a bank. Parking your money in German government bonds, for example, is also safer than trying to stuff millions of euros under your mattress. More puzzling, however, is the negative-yielding corporate bond, a phenomenon that turns the idea of credit risk on its head. Here investors, in effect, pay for the privilege of lending to companies.”

Economic concerns supposedly pressuring sovereign yields much lower apparently didn’t trouble the corporate Credit sector. After starting the year at 88 bps, investment-grade CDS ended March at a six-month low 56 bps. The LQD investment-grade corporate ETF returned 6.18% for the quarter, closing March at a 14-month high. According to Bloomberg, BBB’s (lowest-rated investment-grade) 5.82% gain was the strongest quarterly return since Q3 2009. U.S. high-yield returned 7.04%, the strongest start to a year since 2003. The JNK high-yield EFT returned 8.11%, ending the quarter at a six-month high.

The quarter began with Chairman Powell’s dramatic January 4th dovish “U-Turn.” After raising rates and holding to cautious rate and balance sheet normalization at the December 19th FOMC meeting (in the face of market instability), such efforts were abruptly abandoned. The Fed will soon be winding down the reduction in its holdings, while markets now assume the next rate move(s) will be lower.

It was my view that Chairman Powell was hoping to distance his central bank from the marketplace preoccupation with the “Fed put” market backstop. The Fed’s about face delivered the exact opposite impact. Global markets have become thoroughly convinced that the Fed and global central banking community are as determined as ever to do whatever it takes to safeguard elevated international markets. Moreover, markets have become emboldened by the view that December instability impressed upon central bankers that a prompt wielding of all available powers will be necessary to avert market dislocation and panic.

As such, if markets lead economies and central bankers are to respond immediately to market instability, doesn’t that mean safe haven bonds should rally on the prospect of additional monetary stimulus while risk assets can be bought on the likelihood of ongoing loose “money” and meager economic risk? The Central Bank Everything Rally.

The Draghi ECB, fresh from the December conclusion of its latest QE program, also reversed course – indefinitely postponing any movement away from negative policy rates while reinstituting stimulus measures (Targeted LTRO/long-term refinancing operation). Even the Bank of Japan, permanently cemented to zero rates and balance sheet expansion ($5TN and counting!), suggested it was willing to further ratchet up stimulus. Putting an exclamation mark on the extraordinary global shift, the FOMC came out of their March 20th meeting ready to exceed dovish market expectations – booming markets notwithstanding. Message Received.

The dovish turn from the Fed, ECB and BOJ flung the gates of dovishness wide open: The Bank of England, the Reserve Bank of New Zealand, the Swiss National Bank, etc. The tightening cycle in Asia came to rapid conclusion, with central banks in Taiwan, Philippines, and Indonesia (at the minimum) postponing rate increases.

But it wasn’t only central bankers hard at work. Posting an all-time shortfall in February, the fiscal 2019 U.S. federal deficit after five months ($544bn) ran 40% above the year ago level. But this is surely small potatoes compared to the shift in China, where Beijing has largely abandoned its deleveraging efforts in favor of fiscal and monetary stimulus. After an all-time record January, it will most likely be a record quarter for Chinese Credit growth – monetary stimulus that spurred stock market gains while nursing sickly Chinese financial and economic Bubbles.

The Stimulus Arms Race accompanied intense Chinese/U.S. trade negotiations, in the process emboldening the bullish market view of a Chinese and U.S.-led global recovery. My market gains are bigger than yours. With both sides needing a deal, markets had no qualms with stretched out negotiations.

The Shanghai Composite surged 23.9%. China’s CSI Midcap 200 jumped 33.5%, with the CSI Smallcap 500 up 33.1%. The growth stock ChiNext index surged 35.4%. Underperforming the broader market rally (as financial stocks did globally), the Hang Seng China Financial Index rose 14.2%. Up 33.7%, the Shenzhen Composite Index led global market returns.

Gains for major Asian equities indices included India’s 7.2%, Philippines’ 6.1%, South Korea’s 4.9%, Thailand’s 4.8%, Singapore’s 4.7% and Indonesia’s 4.4%.

Losing 1.9% during the final week of the quarter, Japan’s Nikkei posted a 6.0% Q1 gain. Hong Kong’s Hang Seng index jumped 12.4%, and Taiwan’s TAIEX rose 9.4%. Stocks jumped 9.5% in Australia and 11.7% in New Zealand.

The MSCI Emerging Markets ETF (EEM) gained 9.9%, more than reversing Q4’s 7.6% loss. Gains for Latin American equities indices included Colombia’s 19.8%, Argentina’s 10.5%, Brazil’s 8.6%, Peru’s 9.0% and Mexico’s 3.9%. Eastern Europe equities somewhat lagged other regions. Major indices were up 12.1% in Russia, 9.0% in Romania, 8.9% in Czech Republic, 6.5% in Hungary, 5.4% in Russia and 3.4% in Poland.

It was a big quarter for European equities, with the Euro Stoxx 50 jumping 11.7%. Italy’s MIB gained 16.2% (Italian banks up 12.9%), France’s CAC40 13.1%, Switzerland’s MKT 12.4%, Sweden’s Stockholm 30 10.3%, Portugal’s PSI 11.2%, Germany’s DAX 9.2% and Spain’s IBEX 35 8.2%. Major equities indices were up 17.6% in Greece, 14.1% in Denmark, 12.8% in Belgium, 12.5% in Netherlands, 12.0% in Ireland, 10.8% in Iceland, 10.5% in Austria, 8.5% in Finland and 7.3% in Norway. UK’s FTSE100 rose 8.0%.

Especially as the quarter was coming to an end, the divergent messages being delivered by the safe havens and risk markets somewhat began to weigh on market sentiment. Increasingly, collapsing sovereign yields were raising concerns. U.S. bank stocks were hammered 8.2% in three sessions only two weeks before quarter-end, reducing Q1 gains to 9.1%. Portending a global economy in some serious trouble?

I view the yield backdrop as confirmation of underlying fragilities in global finance – in the acute vulnerability of global Bubbles – stocks, bonds, EM, China Credit, European banks, derivatives, the ETF complex, and global speculative finance more generally. While risk market participants fixate on capturing unbridled short-terms speculative returns, the safe havens see the inevitability of market dislocation, bursting Bubbles and ever more central bank monetary stimulus.

And it wasn’t as if global fragilities receded completely during Q1. The Turkish lira sank almost 6.0% in two late-quarter sessions (March 21/22), with dislocation seeing overnight swap rates spike to 1,000%. Ten-year Turkish government bond yields surged about 300 bps in a week to 18.5%. Turkey CDS jumped 150 bps to 480 bps, heading back towards last summer’s panic highs (560bps). With rapidly dissipating international reserves and huge dollar debt obligations, Turkey is extremely vulnerable. Municipal elections Sunday.

A surge in EM flows gave Turkey’s (and others’) Bubble(s) a new lease on life. But as Turkey sinks so swiftly back into crisis mode, worries begin to seep into some quarters of the marketplace that fragilities and contagion risk may be Lying in Wait just beneath the surface of booming markets. The sovereign rally gathered further momentum, while the risk markets saw lower yields and eager central bankers as ensuring favorable conditions. Yet the more egregious the Everything Rally’s speculative run, the more problematic the inevitable reversal. It should be an interesting second quarter and rest of the year.

Read More

http://creditbubblebulletin.blogspot.com/