Charts That Matter- 22nd Aug

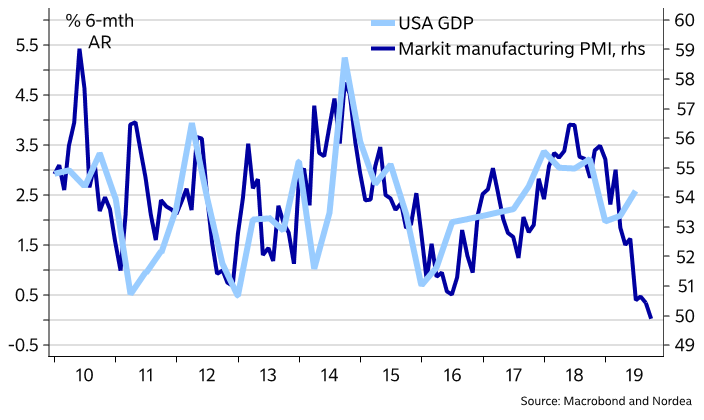
If Donald Trump’s aides and advisors are looking for signs that the US economy is about to roll over ahead of an election year, they can take a gander at the flash read on IHS Markit’s factory gauge.

Unfortunately, it sank into contraction territory for the first time in nearly a decade, printing 49.9, down from 50.4 in July and 54.7 a year ago.

It was the lowest read since September 2009.
Image

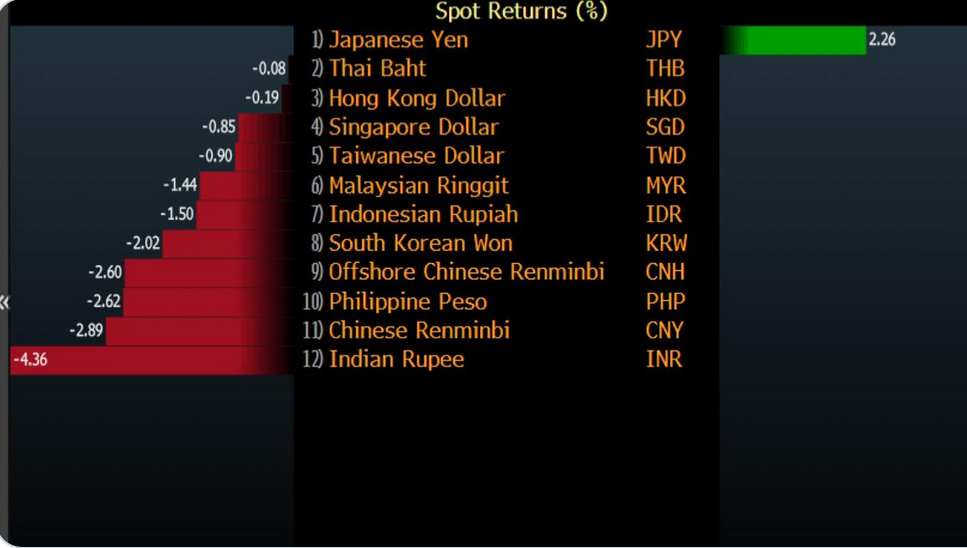
Move on CNY…..Rupee is the worst performer MTD

Asian Month to date FX spot
Rupee

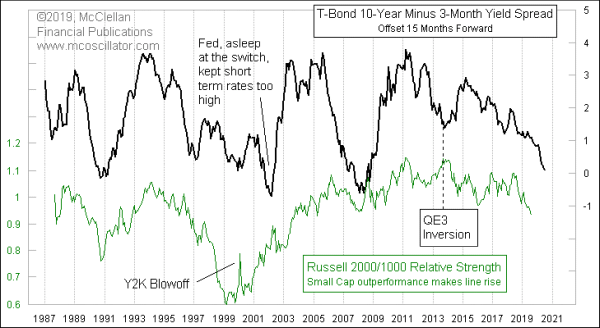
Tom Mccllelan writes “The chart below shows the relative strength ratio for the Russell 2000 Index versus the Russell 1000.  Also in the chart is the spread between the 10-year T-Note yield and the 3-month T-Bill yield, which is one of the common ways of showing the “yield curve”.  The trick in this chart is that the yield spread’s plot is shifted forward by 15 months in order to show how the R2/R1 relative strength ratio tends to follow in the same footsteps after that lag time.  This is relevant now because the R2/R1 relative strength line has been moving lower, indicating that small cap stocks have been underperforming large ones on a relative basis.  And the continued drop in the 10-3 spread says that this underperformance of the small caps is likely to continue for the next 15 months.
Enable Images to see chart or view in browser

Junk bond spread to the broader index are blowing out to highest level since 2016. Via @lisaabramowicz1

Image

India’s ‘One-Trick-Pony’ Growth May Not Turnaround Anytime Soon

Rajiv Malik explains

“There is no reason to think growth is going to turn around anytime soon. We could clearly be down in the dumps for longer simply because my main assessment for India remains—it’s like a truck with a messed-up gearbox. You can change the tires, you can paint it, you can do wonderful things, but will you get the gearbox going?”

To a large extent, India’s growth was predominately a one-trick pony, relying on private consumption which had been held up in large part by debt financing and post the NBFC crisis late last year, a lot of unraveling has taken place. So, after three-four years of strong private consumption growth, there is a natural tendency of momentum to slow down.

Read more at: https://www.bloombergquint.com/economy-finance/consumption-slowdown-indias-one-trick-pony-growth-not-going-to-turnaround-anytime-soon-says-rajeev-malik
Copyright © BloombergQuint

Charts That Matter-19th Aug

The USD shortage + higher short term rates + stronger USD has put (especially) Chinese firms with significant dollar-denominated debts in a fragile position (because 2+ trillion in debts matures over next 24months) . The more USD rally the more difficult is USD loan rollover

Image

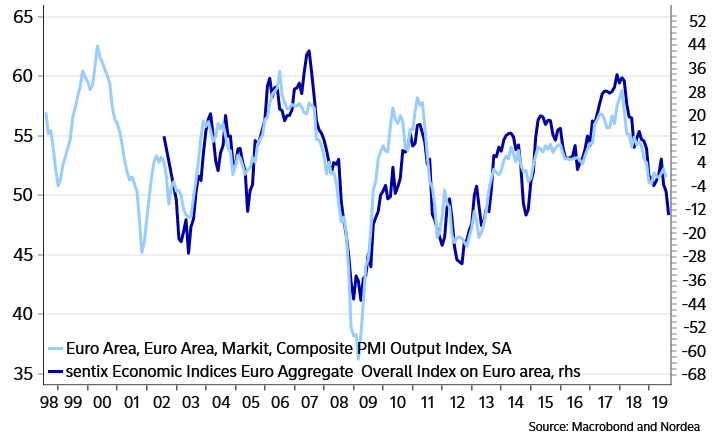
The Bundesbank warns of a technical recession in Germany. Nordea warn of the risks of a Euro area wide technical recession then. The Euro area composite PMI could drop below 50 over the next 2-3 months.

FX weekly -> ndea.mk/33HxWYs

Image

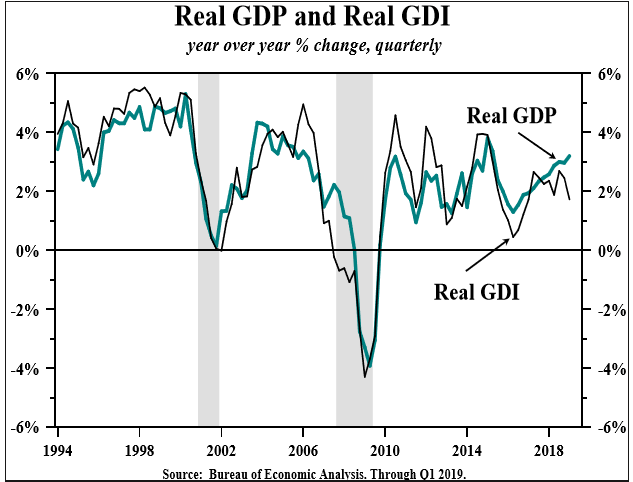
US Real gross domestic income (GDI) gained at a very meager 0.76% annual rate in Q4 2018 and Q1 2019, well below the 2.65% growth in real GDP (Chart 2). Over the past year, real GDP growth was 3.2%, versus 1.7% for GDI, hardly ebullient growth. Normally, GDI and GDP have moved together going into recessions but prior to the severe recession in 2008, GDI led GDP, just as presently, a clear warning sign. Dr Lacy Hunt

why is it never different

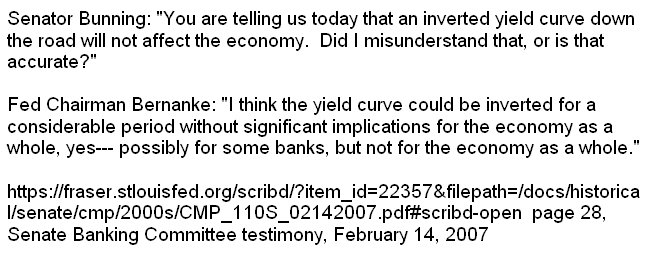
Ben Bernanke, on subject of inverted yield curve, in 2007. That turned out well.

Image

Charts That Matter-16th Aug

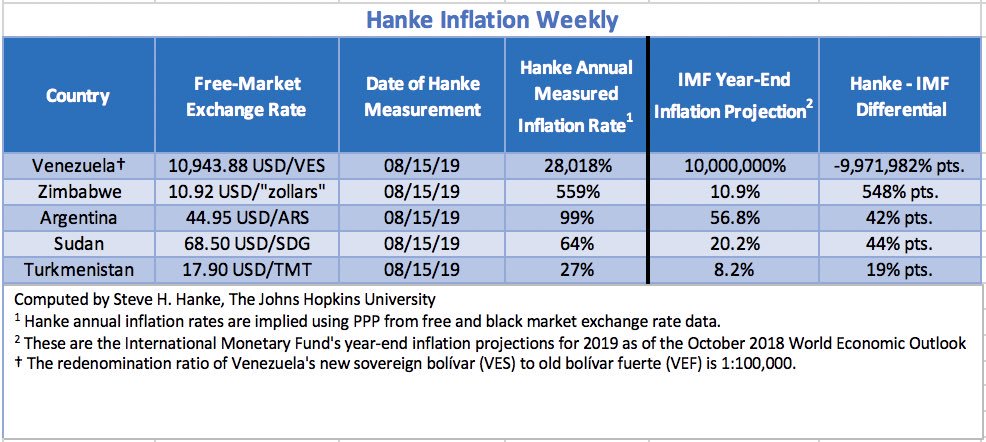
Zimbabwe has suspended the reporting of government inflation statistics until Feb. 2020. Hanke is the only source for Zimbabwe inflation, which is, by his measure, 559%/yr today. Zimbabwe sky-high inflation ranks 2nd in the world behind only hyperinflating Venezuela.

Image

The tariffs are hurting U.S. consumers. Here’s Goldman Sachs’ analysis of what’s happened to prices of goods covered by tariffs. Ugly.

Image

By One Measure, Investors Have Never Been More Worried About The Future.

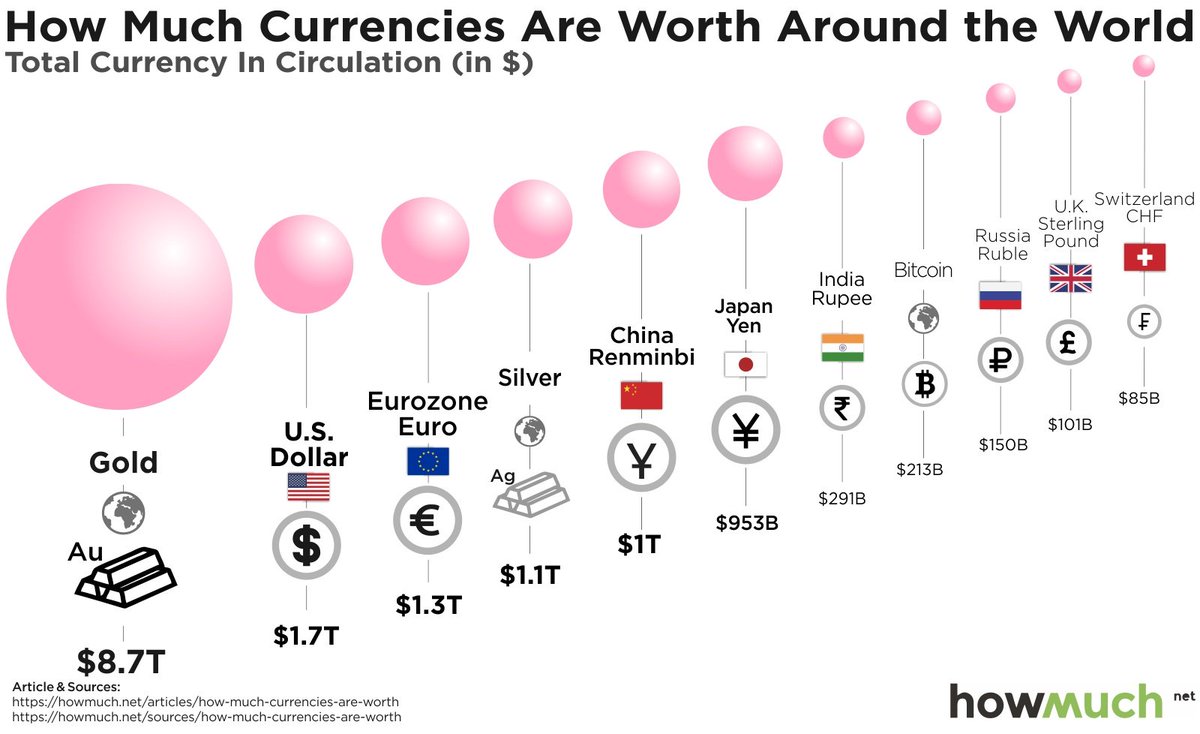
Currency Wars: Stacking Up The World’s Largest Currencies dlvr.it/RBLrX9

Image

Charts That Matter-15th Aug

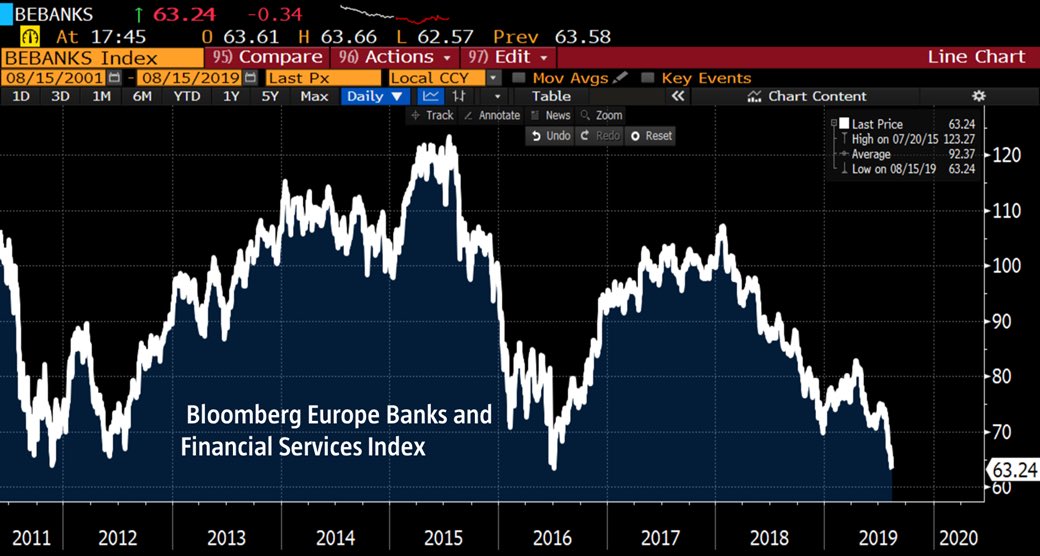
Something is seriously rotten in European banking and Deutsche bank is the biggest systemic risk today.

European bank and financial services stocks just closed below their lows of 2011, 2012 and 2016.

Image

The entire economy is Fyre festival

The day that this chart, showing positive and negative bond yields, turns entirely red, it will become the chart of the century!

Image

“Falling interest rates during a deflationary period are actually bad for stocks.” John Murphy

Image

India’s Richest Man Is Turning Cautious. Bad Sign

Must read article by Andy Mukherjee for Bloomberg quint

Does Mukesh Ambani see dark clouds gathering on the horizon? From his message to shareholders, it doesn’t look like India’s richest tycoon is worried. But his actions may reveal more than his words. At Monday’s annual general meeting, the chairman of Reliance Industries Ltd. was brimming with optimism. Not only did he endorse Prime Minister Narendra Modi’s vision of bumping up annual GDP by 80% in five years to $5 trillion, he even forecast a $10 trillion Indian economy by 2030. It’s not only possible but “inevitable,” he said.Something doesn’t add up. If the outlook is so rosy, why is Ambani hitting the brakes on a seven-year, $100 billion investment spree across refining, petrochemicals, telecom and retail?

India’s Richest Man Is Turning Cautious. Bad Sign

Read more at: https://www.bloombergquint.com/opinion/ambani-cutting-reliance-debt-is-bad-omen-for-india-economy
Copyright © BloombergQuint

Charts That Matter-13th Aug

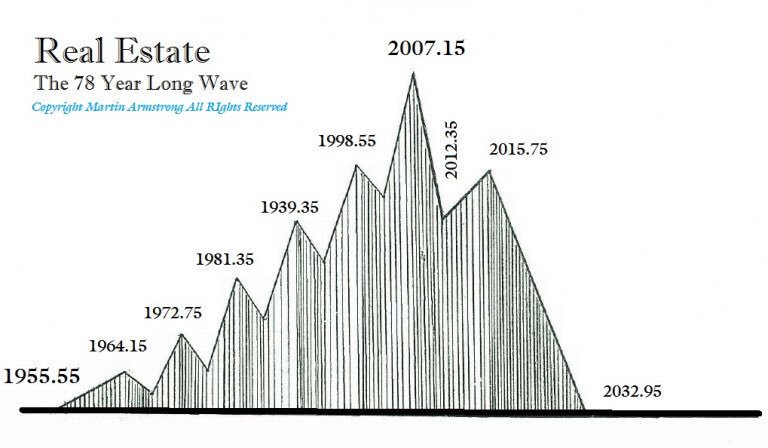
The Global real estate cycle

Image

Argentine stock index down 43% in US Dollar terms Today

Image

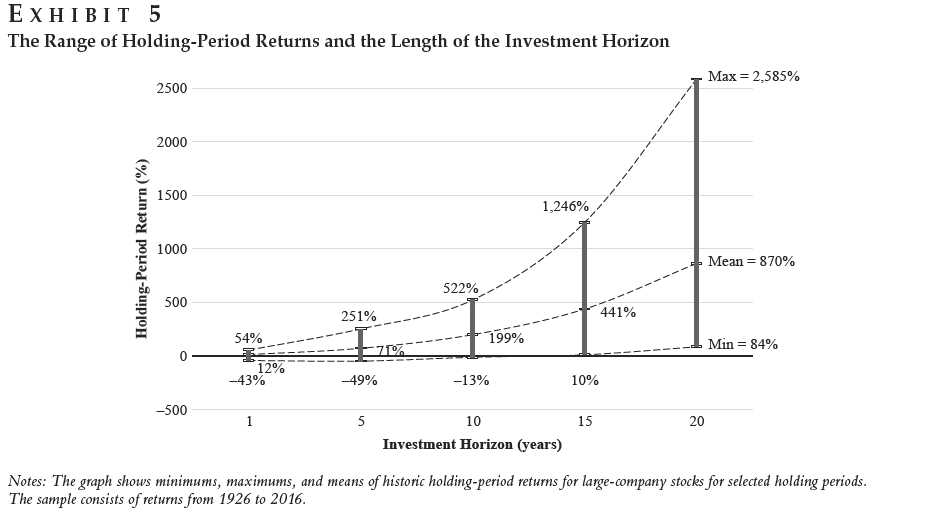
Why longer Time horizon matters in Investment.

The Graph provides a clear graphical representation of the effect that the length of the holding period has on the minimum, the mean, and the maximum returns. The exhibit shows only the stock returns case. We can observe that the mean of total returns increases as the holding period increases. This is the result of the compounding process.

https://alphaarchitect.com/2019/08/12/is-time-really-money/

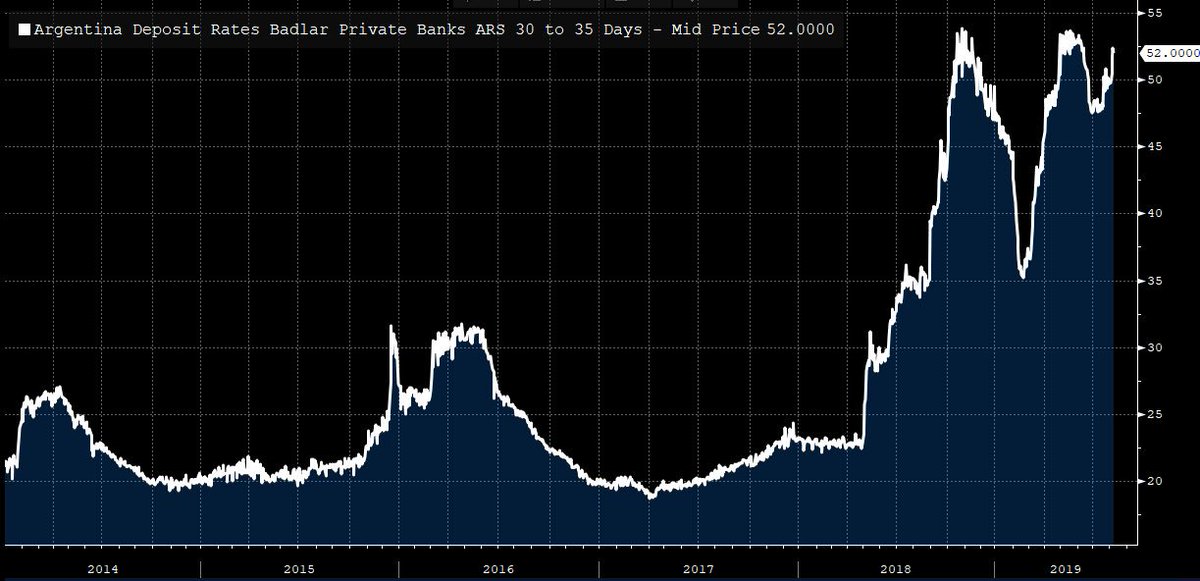
If you don’t like negative rates they are pretty high in Argentina

Image

Euphoria or recession?

India has highest number of Zombie companies in Asia

Nikkei Asian Review writes “In Asia, where debt has risen markedly over the past several years, India is the leader with 617 zombie companies in 2018, followed by China with 431, South Korea with 371 and Taiwan with 327. In Japan, the number of zombie companies is relatively low at 109 because Japanese companies tend to have low debt levels“.

The ratio of zombie companies has risen especially fast in India, Indonesia and South Korea. They accounted for 26% of the total in India, up 13 points from a decade earlier; 24% in Indonesia, up 11 points; and 18% in South Korea, up 4 points.

Read Full article below

https://asia.nikkei.com/Spotlight/Datawatch/Asia-s-zombies-concentrated-in-India-Indonesia-and-South-Korea

Charts That Matter-12th Aug

The one ingredient missing for a major bond price top is the blowup of a big firm like LTCM, Bear Stearns, Lehman, Orange Co., MF Global, etc. Maybe it has already happened, and we just have not heard yet.(Tom McClellan)

Image

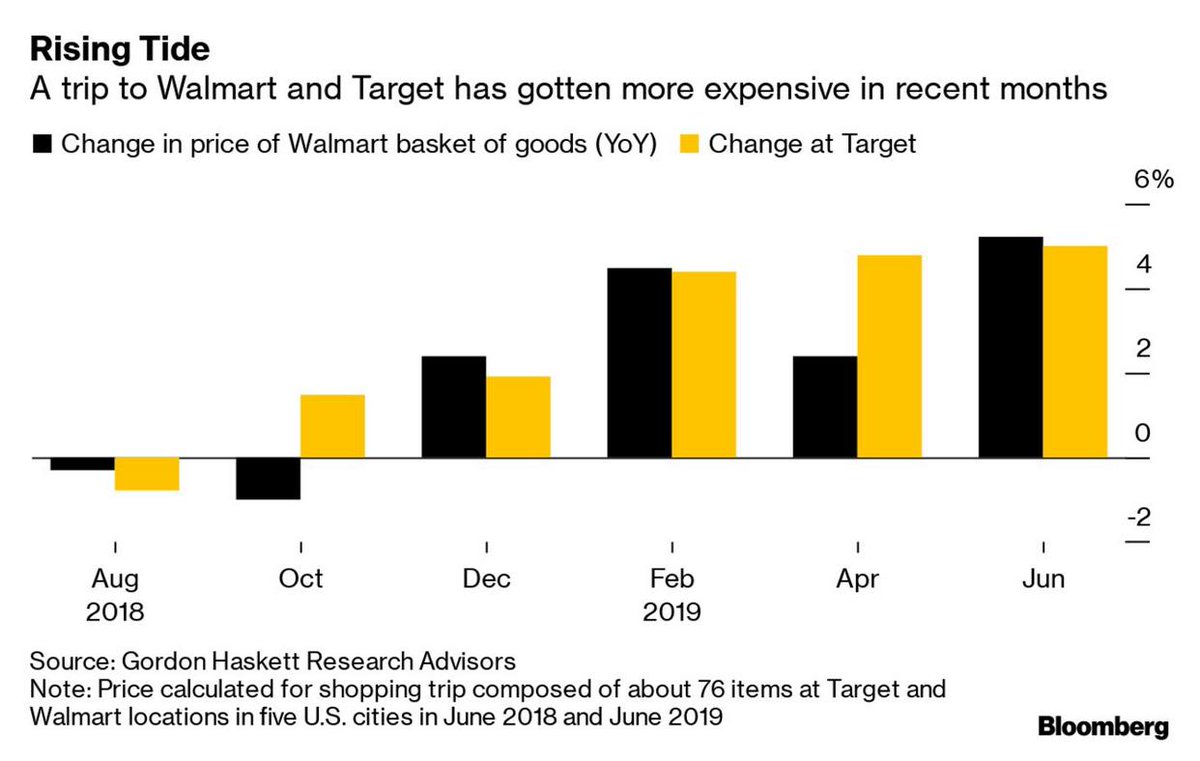
The inflation is back

Walmart said it saw “modest” inflation in the first quarter, but it has heated up lately, and a Walmart shopping trip was 5.2% more expensive in June compared with a year earlier. For thrifty Walmart shoppers, that matters.’ (link: https://www.bloomberg.com/news/articles/2019-08-10/walmart-feels-inflation-sting-prices-and-something-s-gotta-give) bloomberg.com/news/articles/…   

Image

Borrowing doesn’t mean what it used to mean

Image

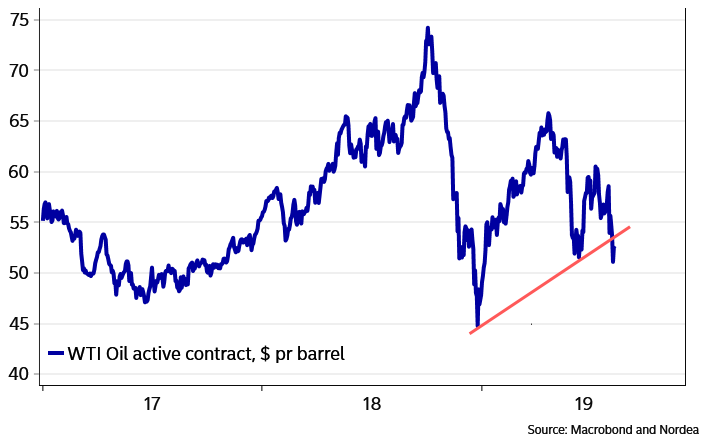
While precious metals seem to prosper, commodities linked to the business cycle seem to falter. It seems as if WTI oil prices have broken lower. This story could have legs for real, if the Chinese started buying more Iranian oil. Will they dare? It will not only piss off the US, but also Saudi Arabia.

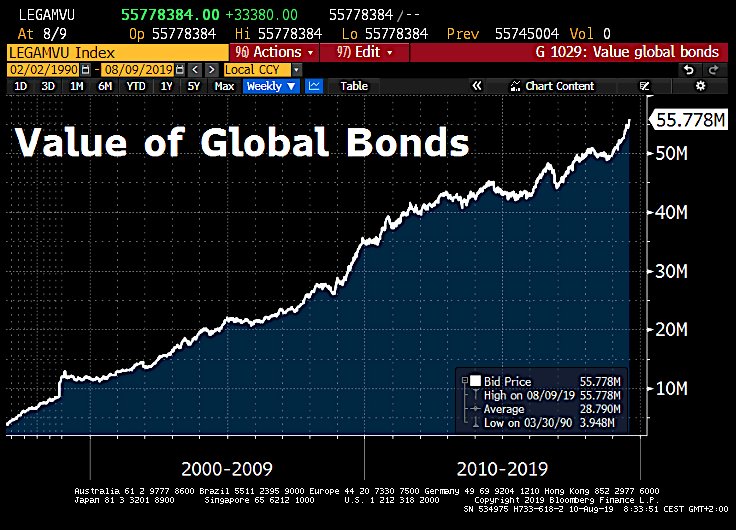
Value of global bonds has hit a fresh high of $55.8tn as investors rushed into safe-haven bonds amid US-China tit-for-tat escalation and further central bank easing abroad.

Image

Global stocks have lost $1.5tn in mkt cap this wk as investors navigated through another round of US-China trade war escalation. Yuan breached 7 per Dollar while US Treasury labelled China currency manipulator. Tit-for-Tat escalation seen as downside risk to growth & risk assets.(Holger)

Image