Borrowing overseas- India Government will finally be answerable to global investors

Indian budget, for the first time in history has created a provision for borrowing in Dollar from international markets .The immediate benefits of borrowing from international market outweighs its concern. There is just too much money chasing global bonds, with almost USD 12 trillion of global government bonds negative yielding. Perennial defaulter like “Argentina” is able to raise 100 years money. Sierra Leone, Angola’s dollar bonds are trading at the same yield as India’s domestic bond. The demand outweighs supply, and international investors are content to buy anything with yield attached to it. But, India is not borrowing to take advantage of this situation, it is borrowing because there is not enough saving left in the country to fund its deficit without crowding out every other borrower.

Mk Venu write in the wire “The government – Centre, states and public sector companies – is by far the largest borrower in the domestic market and tends to squeeze out borrowings by the private sector. Just to illustrate this phenomenon with official data, the total household financial savings, constituted mostly by bank deposits and various other liquid saving schemes, are about 8% of GDP. The total borrowings by the Centre, states and PSUs are also about 8% of GDP. So the household financial savings are almost entirely appropriated by the government. Of course, household savings have another component – in the form of physical assets such as real estate, gold etc. which are not strictly available in liquid form to be tapped by either the government or private sector for productive investment. This should constitute another 10% of GDP. So the total household savings are about 18% of GDP.

The real crisis which has developed over the past five years, forcing the government to borrow dollars from abroad, is that India’s domestic savings rate has fallen about four percentage points of GDP and almost all of it has been in household savings, which is the main source of incremental borrowing for the government and corporate sector. A decline in annual savings of 4% of GDP means roughly over Rs 7 lakh crore less of household savings available for investment every year.

Therefore, the government wants to tap the sovereign bond market to partially make up for the big fall in domestic savings. The big worry is that there is a structural decline India’s savings rate, and the Budget does not address this problem. Instead, it seeks to rely on the lazy and highly risky solution of dollar denominated borrowings.”

My two cents

I am of the view that till the time India stabilizes its macros and makes its data more credible it should not borrow from international markets. Today,India will have enough demand for its international bond offering with less disclosure because the demand is very strong. The tide will turn when India’s macro fundamentals don’t improve and global liquidity tightens forcing the market to ask tough question which will lead to blowing up of its bond spread. This will make currency more volatile and creates one more headache for Indian central bank which will have to be dealt with by raising rates which in turn will be harmful for economic growth
Global Equities cause and effect

Prerequisite Capital writes in their newsletter

Perspective around World & US Equity markets, before launching into an expanded discussion of the required Portfolio Strategy elements that are likely to be well suited to the next 25 years

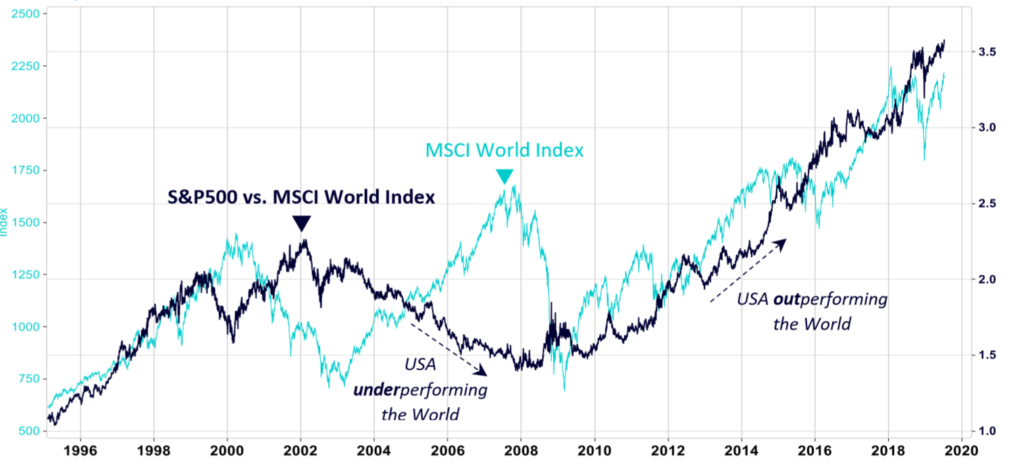
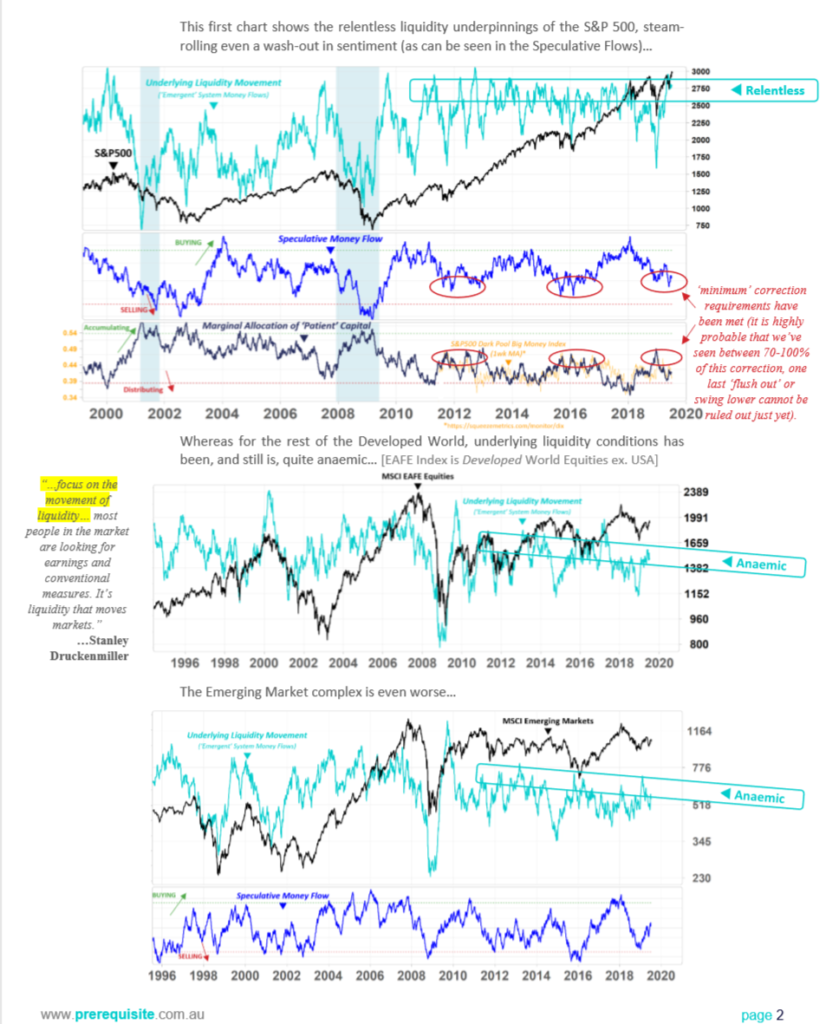
Global Equities: the USA vs. the World Here is the simple ratio of the S&P 500 vs. the MSCI World Large Cap Equity Index that shows the relative outperformance of the S&P 500.

PCS explains the many underpinnings of this dynamic, and its prospects moving forward. But for the purposes of this Letter, one of the ways you can ‘see’ the relative differences of conditions is by looking at the Underlying Liquidity pictures of the USA vs the Rest of the World (see next page).

Valuation multiples are an ‘effect’, whereas Capital Flows are the ‘cause’ (when capital concentrates into an asset class or a security, valuations are naturally bid up, when it disperses valuations fall). Investors are trained in ‘Valuation’ methodologies but Capital Flows & Liquidity remain a blind spot for most. Although it goes beyond the scope of this Letter, the USA still has tailwinds in place for P/E multiples to be more resilient than people realise, whereas the rest of the world still has headwinds to their multiples. Europe & EM in particular remain potential value traps.

full newsletter

http://www.prerequisite.com.au/wp-content/uploads/2019/07/2019-07-14-Quarterly-Client-BRIEFING.pdf

Asian Currency Manipulation Has Led to Stagnant Real Incomes, All Time Low in US Manufacturing Employment Levels and Increasing Wealth Disparities

By Will Matthews

  • Asian countries have used currency manipulation to significantly undervalue their currencies relative to the US$
    • Conferred a massive competitive advantage to Asian manufacturers by artificially reducing their labour and real estate costs which US employers were not able to match or offset with productivity
    • A floating exchange rate would otherwise absorb / ameliorate these advantages
    • Resulted in massive job transfers from the US to Asian countries which led to stagnant real incomes in the US, all time lows in US manufacturing employment levels – in 2010, there were fewer manufacturing jobs than after demobilization from World War II and the population was 2.2 times greater – and wealth disparities – companies could lock in super normal profits by maintaining price and shifting to lower cost jurisdictions
  • This currency manipulation conveyed a huge growth boost to those Asian countries at the expense of the American worker
    • Japan grew at 5% to 7% per year from the 1960s through the late 1980s until Japan’s currency was forced to trade freely
    • China miracle growth since 1990
    • Asian growth of over 5% per year
  • Started with Japan in the late 1960s and was felt strongly through the 1970s and early 1980s until Japan was forced to let its currency trade freely in 1987
    • Japan currency peg led to stagnant job growth in the US manufacturing sector in the 1970s and 80s.  Following the currency becoming freely tradable in the late 1980s there is a slight rebound
    • Taiwan, South Korea, Hong Kong, Singapore and Thailand used currency manipulation to undervalue their currencies.  These countries still manipulate their currencies versus the US$ and are highly dependent on exports
    • Once China pegged in the late 1990s and was given access to US markets, a precipitous decline in manufacturing jobs commenced
  • This transfer of wealth from America workers to Asia has not, and will not, offer any return to the US via new markets. No Asian country is a net importer.  Their growth and current size is dependent on currency manipulation
    • Once Japan’s currency was forced to trade at market rates, it appreciated approximately 250% versus the US$.  Since the revaluation, growth has collapsed- Japan has grown has grown 6% in 25 years
    • After 45 years, Japan remains a net exporter – there still is no net export opportunity for US producers
    • It was thought that once countries reached developed world status, they would switch from net exporters to net importers.  Like Japan, Singapore, Hong Kong, South Korea and Taiwan have reached developed country standards, have not become net importers and remain highly dependent on exports
  • Over the long term, if one country sells/exports (“Seller”) more to the another country (“Buyer”), Seller’s currency will appreciate relative to Buyer’s
  • It is clear that China is manipulating its currency as the trade deficit with the US is up by 300% and the currency is up less than 35%.
  • To be clear, free trade should always be supported but free trade only occurs when both sides play by the same rules:
    • Freely traded currencies
    • Same employment and environmental rules
    • No unequal government subsidies
  • To get the US middle class going again, force all Asian currencies to be freely traded and use access to US markets as a way to normalize employment and environmental laws

Charts That Matter-5th July

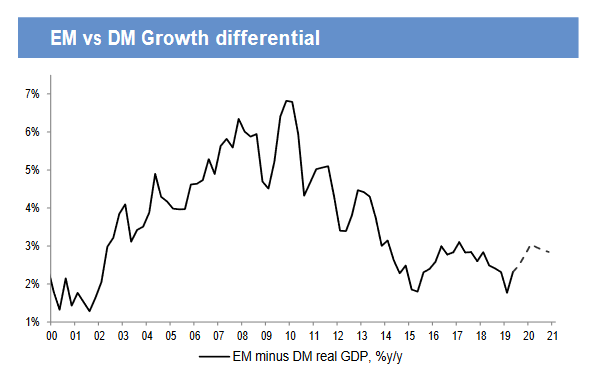
The EM-DM growth differential is depressed in a historical context

The GDP growth differential between EM and DM has collapsed since 2010. While it appears to be stabilizing most recently, escalation of the trade war puts this at risk.The growth differential between EM and DM was historically an important driver of the relative performance of their respective equity markets.

The EM-DM growth differential is depressed in a historical context

Chinese economy is deteriorating fast.The NBS PMI showed jobs contracting at a quicker pace in June (46.9) – the weakest since the 2009 GFC slump. The service PMI jobs also looks weak. The authorities cannot stand by and let the jobs market deteriorate much more.

Image

“Trucking is infamously cyclical, but this is a tad extreme…So far in 2019, year-over-year declines in orders for Class-8 trucks ranged from -52% to -71%, which, as FTR said in the statement, makes it ‘the weakest six-month start to a year since 2010′”

Image

$10,000 invested for 30 years in Swiss government bonds will grow to $9,856 at maturity 2049. (note: assumes interest rates reinvested at @ current 30-yr rate of -0.05%).( Charlie Billelo)

Image

Charts That Matter-4th July

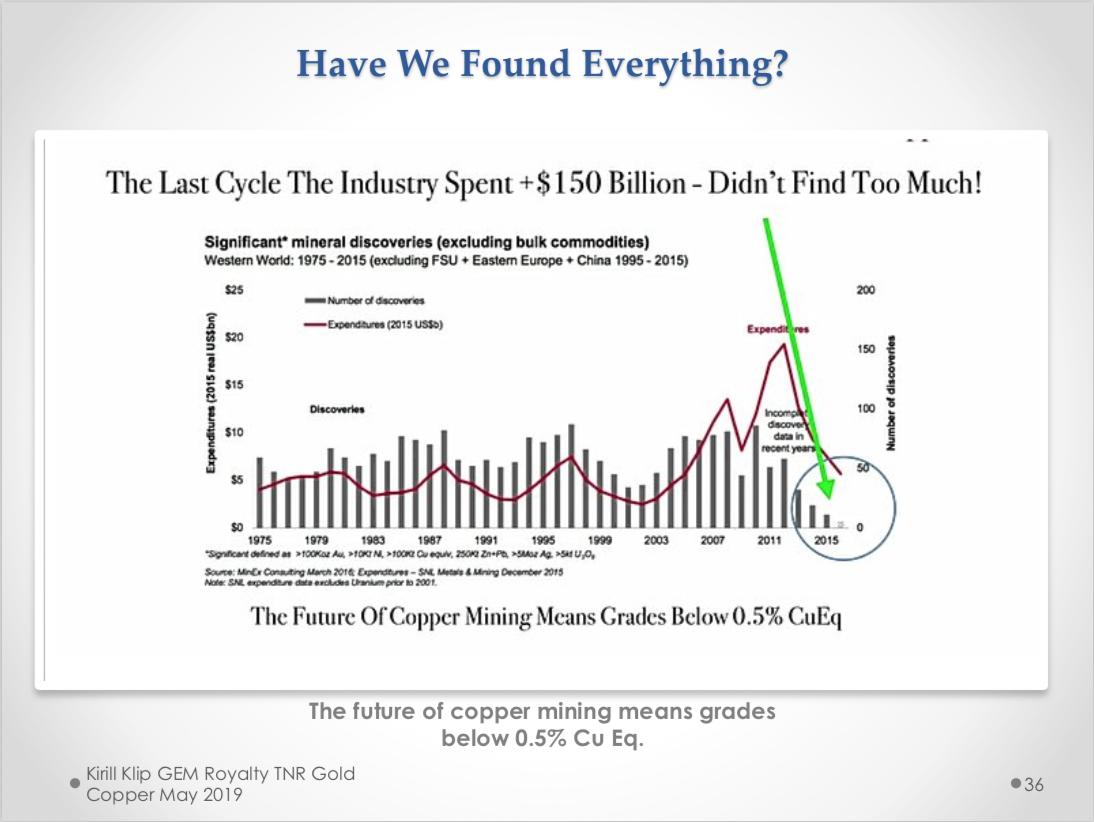
Copper Demand Set To Double In 20 years – The World’s Largest Operating Copper Mines Are More Than 75 Years Old.Conditions are ripe but wait for cycle to turn up for commodities.

Image

Anything left with a positive real yield in Europe is getting eaten up right now. Sovereigns don’t offer much and if you want to take on corporate credit risk? This is the yield you’re getting on the BBG Barclays Euro Aggregate Index.

Image

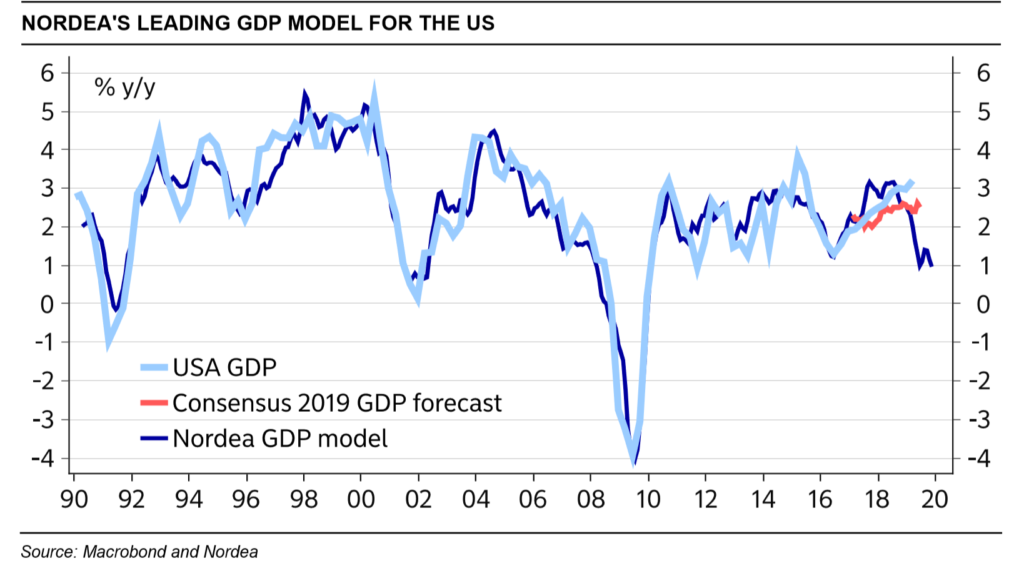
Nordea GDP model points to 1% GDP growth for US, which indicates that negative macro surprises should move to the US.

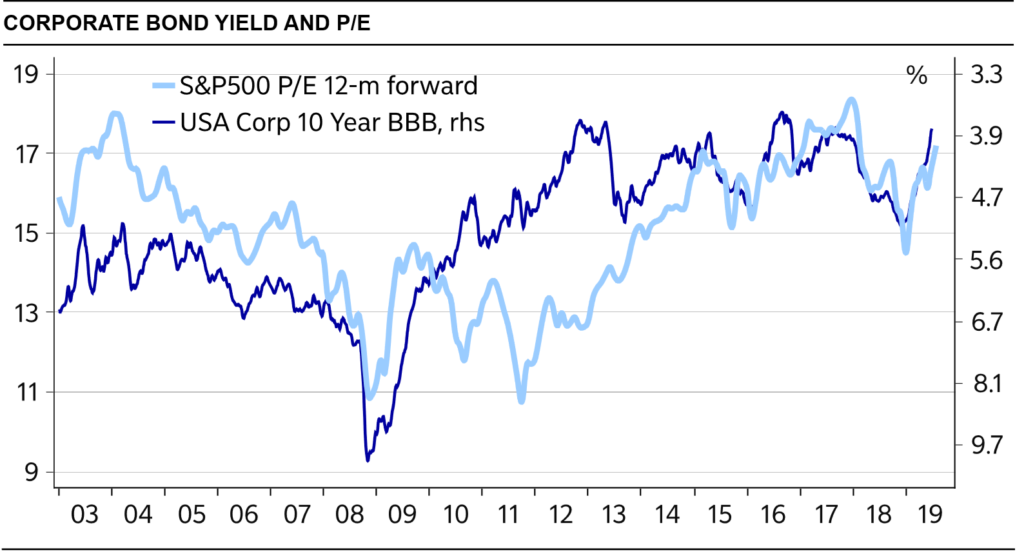
Why equities keep on rising ? Because Falling bond yields have triggered a renewed push higher for P/Es. Can the P/E continue to rise to infinity? The answer is NO…. look at German and Japan P/E levels, they are lower than US

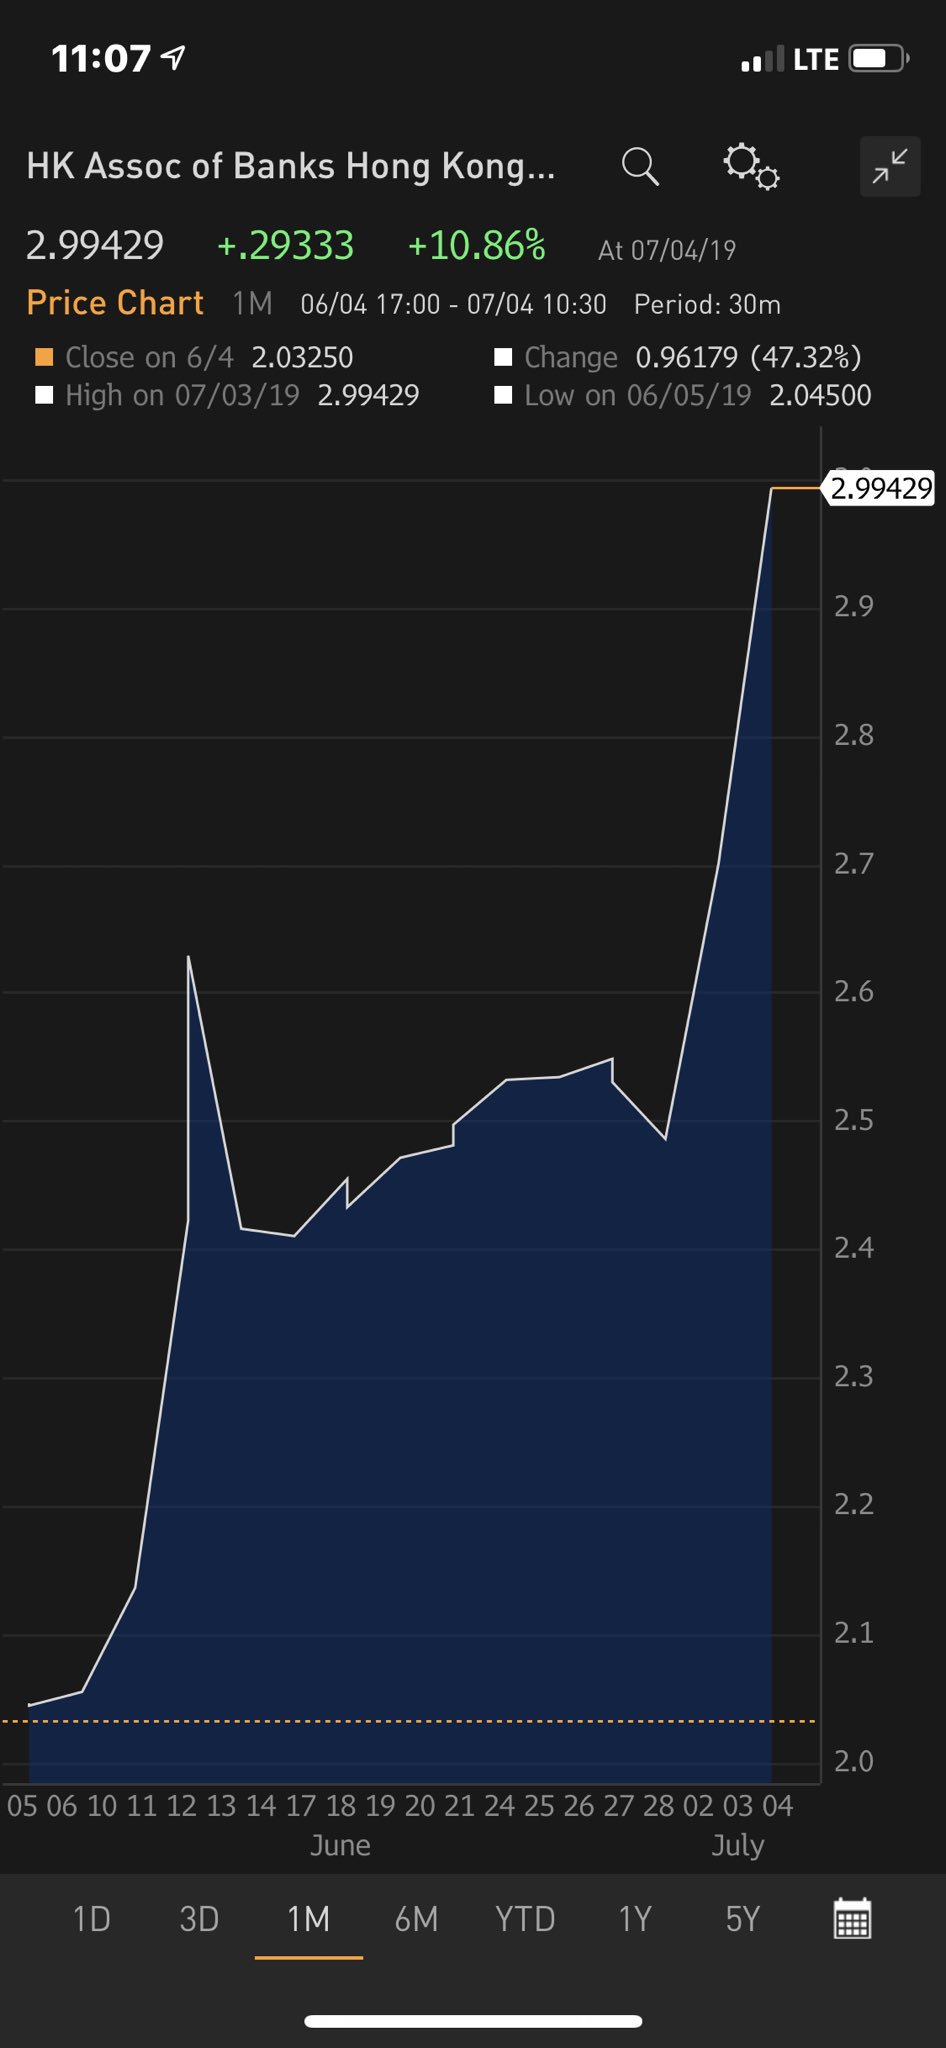
Hong Kong currency market coming unhinged. HK interbank lending rate skyrocketing (up 30bps tonight alone!) as money evacuates the system. M1 and M2 collapsing…happens every time before the system snaps. (Kyle Bass)

Image

Charts That Matter-3rd July

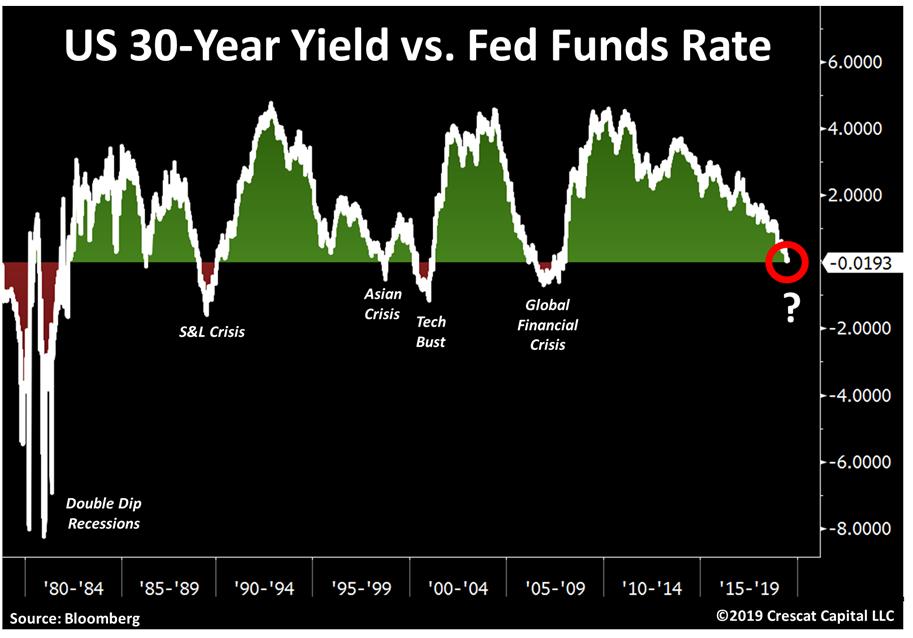
It’s official. US 30-year yield just inverted vs. the Fed funds rate! Same warning ahead of the GFC, tech bust, Asian crisis, S&L crisis, and 1980’s double dip recessions. The only false signal, 1986. (Tavi Costa)

We now have the entire US Treasury curve below the Fed overnight rate.

Image

As world trade goes, so goes EM…( Variant Perception)

Image


Challenger Job Cuts Add a Support Pillar to Gold Foundation — Steadily increasing Challenger job-cut announcements support expectations for Federal Reserve easing, pressuring the dollar and adding support to appreciating gold prices.

Image

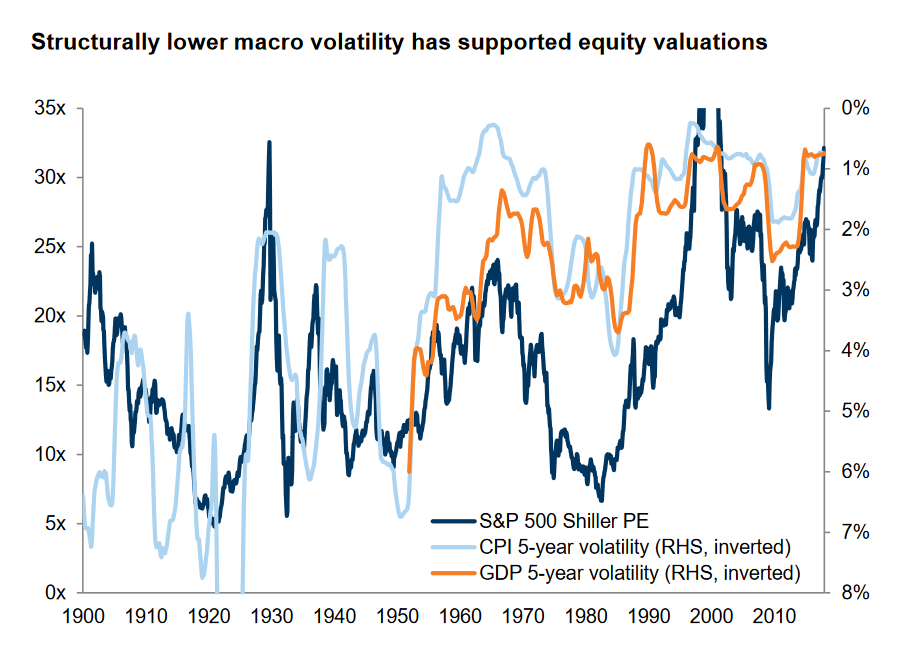
Lowflation has given a boost to valuations across assets

Lowflation has given a boost to valuations across assets

Market overview- June 2019 and outlook

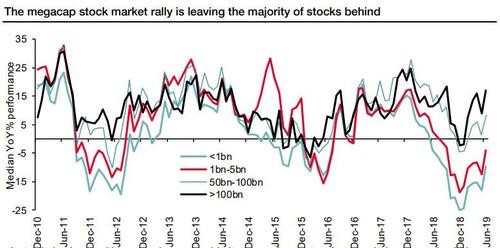
As trade wars threatened to derail global economic growth, major central banks suggested they were ready to provide support in the form of lower rates. Markets rallied early in June as the US Federal Reserve (Fed) President Jerome Powell, said he stood “ready to act” and the official Fed meeting later in the month showed he had plenty of support for that notion, with half of the Federal Open Market Committee (FOMC) members suggesting the most appropriate path forward was for lower US interest rates. Most equity markets closed higher in June, pushing them back into positive territory for 2Q19. Developed markets outperformed emerging markets for the fifth consecutive month. The chart below  shows that Mega caps have been a key driver of global markets for the last few years

but, during June, US regulators announced a plan to investigate anti-competitive conduct among large tech companies . Most of this Mega Cap grouping saw their share prices fall by high-single-digits on the news. I think that we need to take this development seriously and believe that we might be ending years of outperformance by FAANG.

It was strange to hear Dovish central bank talk especially from US which is seeing all time high equity markets, loose financial conditions and low Unemployment. Mario Draghi continues to believe in the monetary stimulus as the panacea for  stagnating European economy. US 10-year bond yields dropped further, briefly edging below 2% during the month, the first time 10-year rates have breached this level since before US President Donald Trump’s election in November 2016. Interest rate markets are now pricing in expectations for almost three US rate cuts by year-end.

Commodity markets generally were subdued, though falling interest rates helped drive the price of gold up 8% during the month (the highest level it has been since 2013) and agricultural commodities showing some signs of life. The US dollar was weaker against most currencies in June.

Market outlook

I believe that both Equities and Bonds markets globally are headed for a steep reversal but it will not happen unless one of the following conditions are met

  1. Rise in Junk bond spread
  2. Resurgence of Inflation

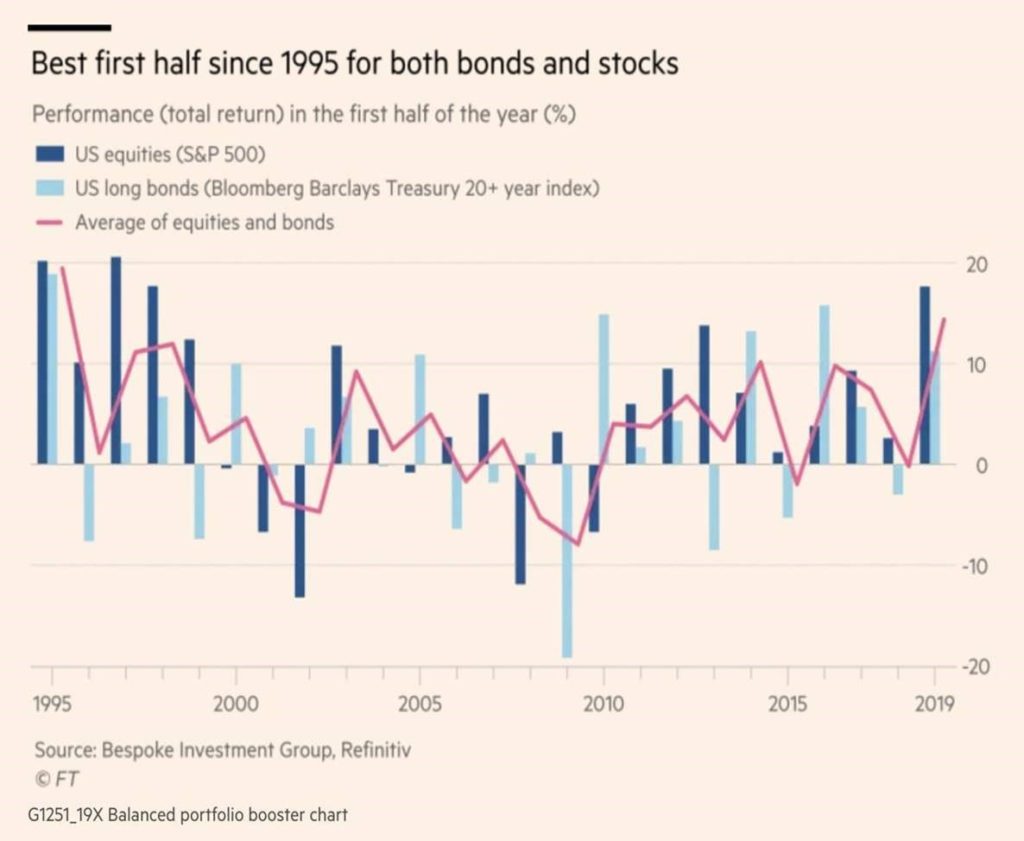
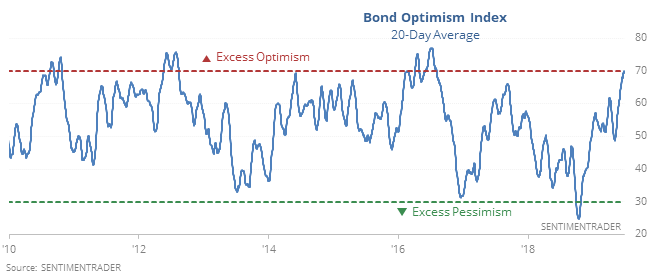
And if I were to pick one asset which is more overvalued between Equities and Bonds, then it is Bonds. USD 12 trillion of Global bonds are now negative yielding and the investor positioning is very optimistic. Infact the bond markets are so overstretched that a 1% rise on global bond yields could wipe out usd 2.4 trillion in market value (Barclays bond fund index).

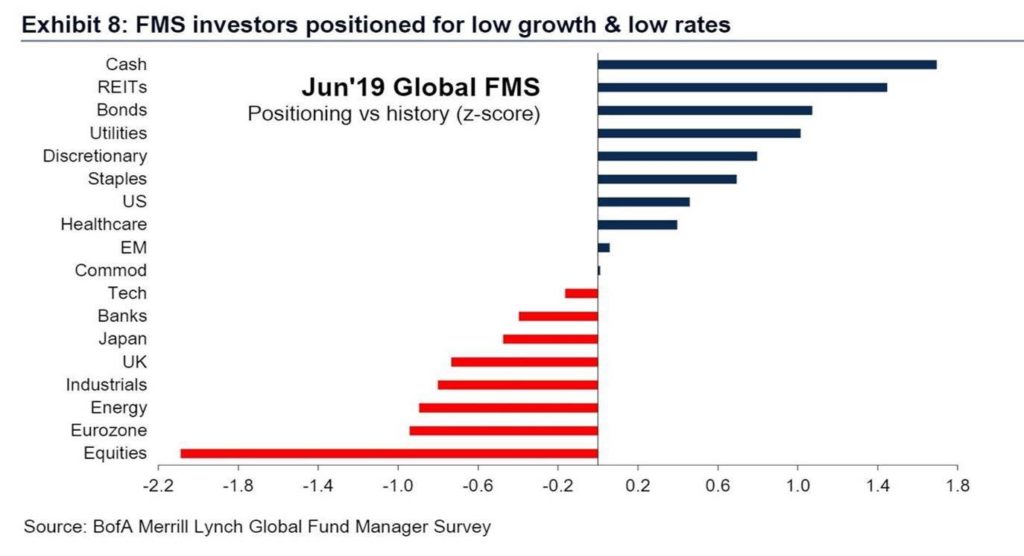
So, Bonds are the canary in the coal mine and I will watch out for volatility in bond markets rising due to any of the factors listed above. Although,We can easily see S&P rising above 3000 in short term as equity market is still defensively positioned as evidenced in this BOFA chart.

There is now more evidence that we are indeed headed for rise in soft commodities over next few months. Agri commodities have remained subdued for so long time that markets are taking their own time to price in the following planting data out of US and not to mention the continued crop infestation in china, Australia announcing the wheat import tender due to drought and the icing on the cake ” African swine flu” which is killing pig herds across China, Vietnam etc

Conclusion

We are in a feedback loop and with the way it has worked in positive way, it will also work in negative way and unfortunately till then both equities and Bonds are tied to the hip. In the very near term it is blue sky for both equities and fixed income possibly getting ready for another leg up with FED’s help. Beyond that, I think we are headed for STAGFLATIONARY scare over coming months as higher agri commodities prices and tariff increases starts passing through the supply chain. This will in turn create a negative feedback loop with Bond yields rising and then feeding through lower equity prices coupled with higher market volatility. In Nutshell

Euphoria followed by “Brace for Impact”

Charts That Matter-26th June

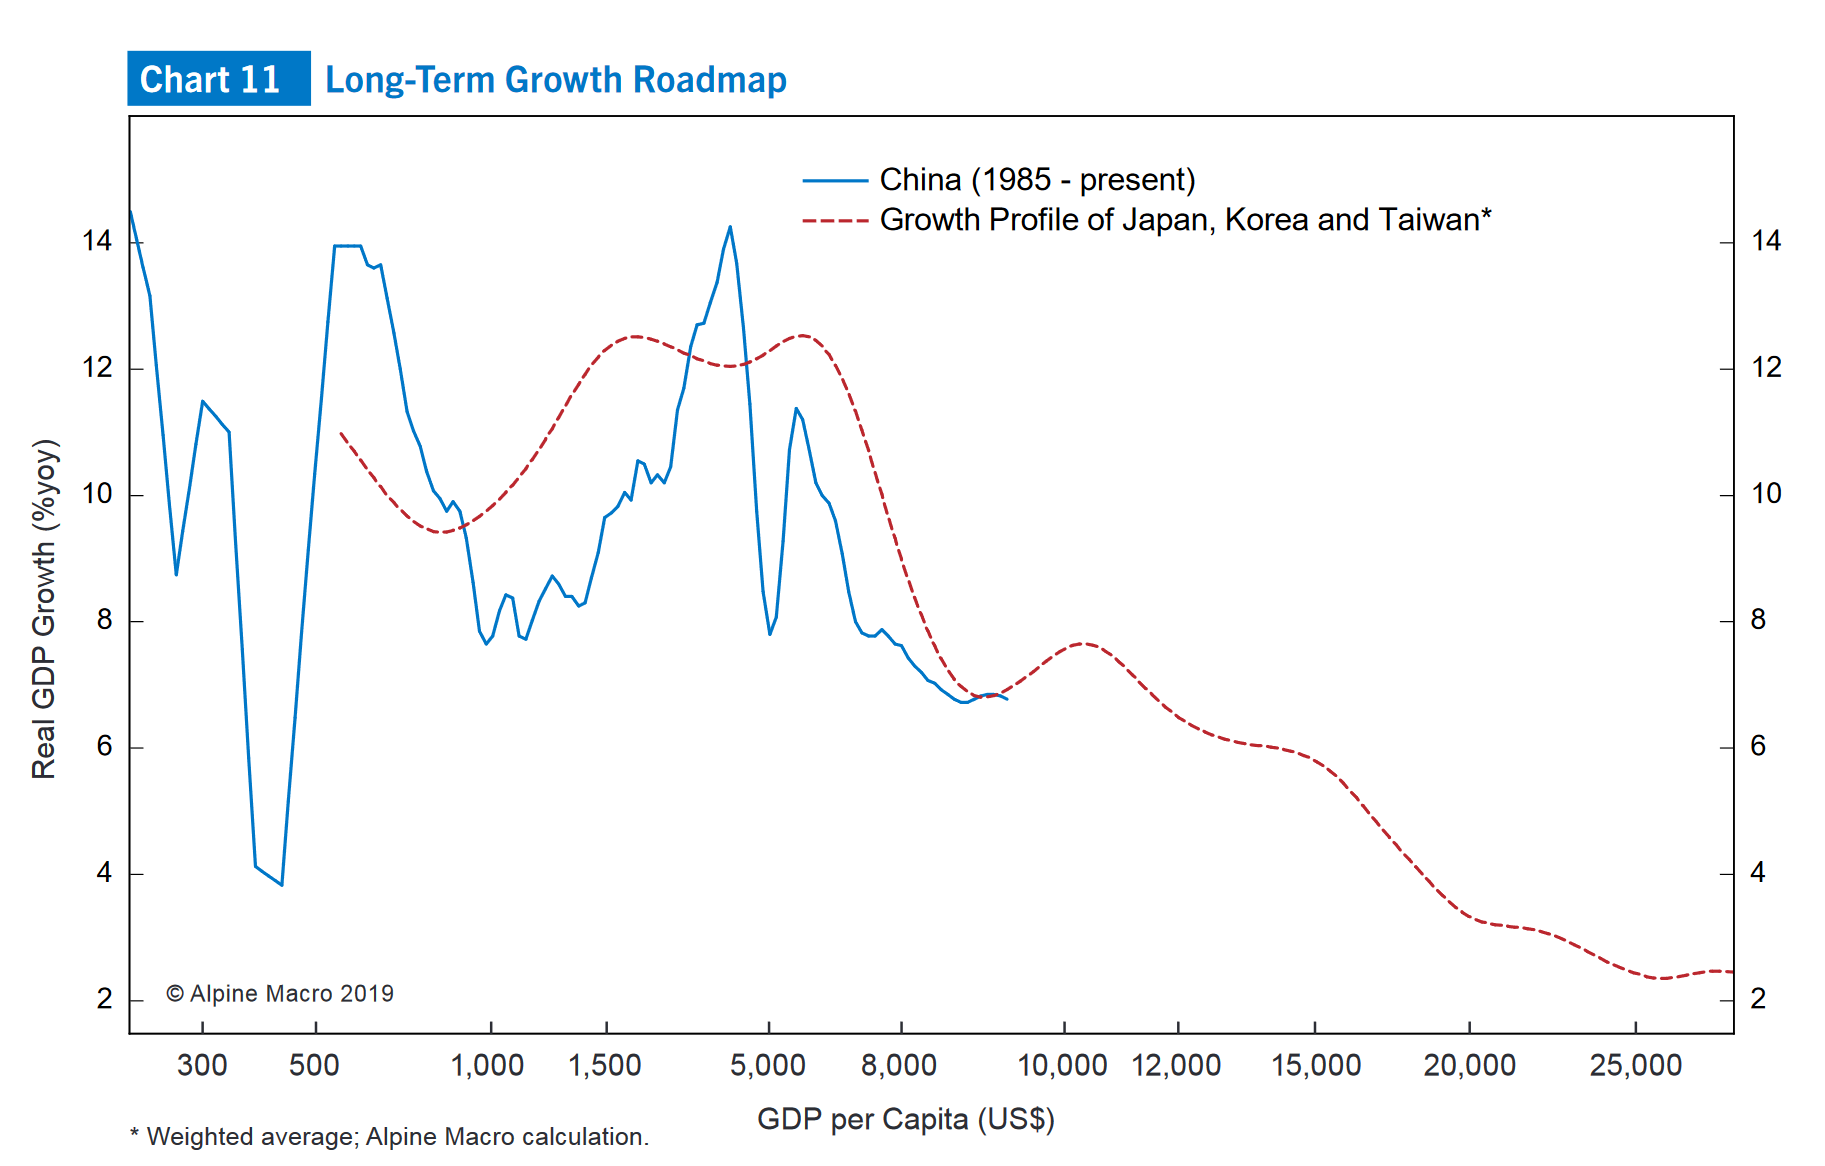
China long term growth path is following on footsteps of Japan and South Korea. Blow asset bubbles, take too much debt and there you have it….. the lost decade.

China Long Term Growth roadmap

US 2-year yield now on pace for dropping 8-weeks straight! Moves as such only happened 8 other times in history. All of them during bear markets or recessions. People tell me that it is different this time

There is a presumption that faster economic growth in emerging markets drive up corporate earnings as well. Look at the chart below and decide yourself.
Nathan Rothschild’s investment mantra was said to be “buy on the cannons, sell on the trumpets”. Apparently it works for EM investing. Buying during one of the periodic bad news frenzies yields outsized returns. @SteveJohnson000 https://www.ft.com/content/d6f18712-9365-11e9-aea1-2b1d33ac3271 …

The Kondrateiff seasons and India

By Rohit Srivastava

The idea to Measure and Map India’s economy along with the EW view was given to in 2003 but I decided that the time to do so would be a decade later. Rightly so I started the process in 2010 with the publication of the Economic Winter of India reports 3 completely detailed reports are online with the latest published in Dec 2018. i also write winter updates from time to time But let me get you up to speed quickly with what this is all about. The economic cycle was considered to have 4 seasons along an entire cycle from birth and back and then repeat. The use of seasons to describe a cycle is probably meant to highlight that the cycle goes on and on. The length was considered 50 years but it is not a fixed time it can be 70-80 years now based on the  life expectancy of mankind and other factors. It is therefore about the events that follow each other from one season to the next
Here is an analysis of India’s seasons and where we are within then.

The Kondrateiff seasons and India

Kf Spring – Spring represents the birth of an economy which for India would have started a little before or around Independence.
Spring is the bull market during which the economy grows on new found growth prospects to exploit all its resources. Interest rates start on a low base and trend higher as demand for money grows to fund growth. Prices of assets commodities and labor expand. For India the time up to 1990 would represent such a period. GDP compounded at 6% during this period.

Kf Summer – Summer is when the economy reaches full bloom. All resources are being exploited and the expansionary phase of the past
results in visible price inflation catching up with wages. To control it, interest rates move up substantially often slowing down the economy. By the end of Spring price inflation will eventually appear to have been controlled and interest rates can go lower again. 1994- 2001 represents such a period in India. 1966-1981 represents the same for the US. For those who have been following the market for the last decade you will remember how analysts were often comparing the 70’s Dow chart with the 90’s India chart to predict how the Dow then took off later and went up 10 fold over the next 20 years [during the Kf Autumn]. Well India went up 8 times since 2001 in 7 years. What I want to highlight is that in terms of the Kf cycle they were comparing the same state of markets [Kf summer]. The outcomes
therefore were also similar, but time wise one lasted much longer. There is a belief therefore that India’s bull market that started in 2001 is going to last for decades and we are seeing a temporary halt right now, however the size of the bull market is often ignored. Time was smaller in India because we quickly went from a closed to open economy and are doing a very fast catch up job with lost time. In terms of wave structure too if you see the chart above wave 3 was the longest however wave 1 was a small bull market relatively, and therefore wave 5 equals wave 1 in size and that is good enough. India’s debt to GDP was just over 50% by the end of the Summer].

Kf Autumn – The myth that inflation is under control is what kicks off the Autumn. This feeling of control allows for monetary action to start again. Note that this is the only time when lower interest rates are associated with rising asset prices. During spring interest rates start on a small base and expand slowly as the economy expands, demand for finance leads interest rates. During Autumn rates are lowered to kick start economic activity and the belief that prices can be kept under control allows for credit based bubbles to reach full scope. Falling rates push all asset prices up from equities bonds and real estate to possibly commodities and wages. As credit levels expand exponential nurturing debt with cheap finance is the essence of keeping the Autumn bubbles alive. But as discussed above they will eventually burst. 2001-2010 is the Autumn for India. In terms of credit 2010 appears like the right time of the cycle to end, though from a stock market perspective it can be debated whether the 5th wave based on Elliott waves ended in 2008 or 2010. It differs between Sensex and Nifty. India’s debt to GDP had crossed 135% and is now close to 140% This excludes items like NBFCs, non banking FDs, non banking corporate debt, derivatives markets and other lenders and borrowers. Bank credit and Govt debt along add up to close to 140%. If we put everything together it could shoot past 150%

Kf Winter – As always winter will come. The most painful period as bubbles burst causing economic upheavals and hardship. Fear and distrust force reduced lending activity despite lower interest rates. Quality debt is back in vogue. The process of unwinding of debt before another cycle starts can take from a few years to decades depending on the degree. The U.S. deflation from 1929-1949 took 15 years for debt, but stock markets bottomed in 1934, i.e. in 4 years. However a grand super cycle occurs when a 5 wave rally of one larger degree occurs. This means after 3 consecutive Kf waves in a country it completes a larger degree 5 wave rise lasting 210 years and will correct/consolidate for a longer period. In the U.S. 1720-1784 is shown as the Grand-Supercycle degree wave 2 by Robert Prechter in his book “Prechter’s Perspective”. That was 50-60 years of depression/consolidation. Since then US has been in a Grand supercycle degree wave 3 till year 2000. Wave 4 could potentially be as large in time. But for countries like India that are in their first Kf cycle since independence and things are not so bad. Yes I think India will see its own Kf winter, i.e. deflation or depression, however after 2-3 years once it completes a supercycle degree wave 2 correction, a larger degree supercycle wave 3 bull market lasting 70 years can emerge. This is when decoupling will happen for India and maybe China. The recent 2010 Indian budget has started talking about reducing the fiscal deficit and that is a deflationary trend signal. How debt gets reduced may vary from cycle to cycle. Bubbles can be pricked internally through tightening or externally through events not in our control.

Now that I have given enough perspective to the Kf cycle and where India is placed within it lets discuss the impact on India and the stock market. it is my belief that India will find it hard to escape the Kf winter that is likely to follow. As India was late to enter the Global Kf-Autumn, it will has taken time to enter the Kf winter. One of the reasons that India’s cycles are years apart from the west is that we were a closed economy but since the 80’s we started the process of opening up. In 1991 we jump started the process with reforms and have been catching up very fast with the world cycle. So while the Indian Summer occurred 10 years after the US summer ended, our winter is now starting 3 years later. 2010 shall mark the beginning of India’s Kf winter of deflation and depression as the external
environment starts to worsen. Attempts to finance its own fiscal deficit internally might stress the economy and attempts at price inflation will lead to dumping of goods by other nations or social revolt. Raising interest rates will lead to reduced lending and if we try diverting savings to finance the government the corporate sector will starve. So we are walking a tight rope which will break more due to external factors than domestic ones. Non financial problems like the one with our neighbors can also be a hidden trigger. Basically our high fiscal deficit and 160% debt/GDP is now exposed to various external risks that can stall further monetary expansion and thus force a period of deflation before we can start growth all over again.

India’s biggest strength that will eventually bring us out of this mess is our demographics. A young population is willing to take hard steps and suffer the pain needed to quickly move ahead. Ageing populations in the west and Japan prefer not to suffer pain and postpone it as far as possible which will make them take much longer.

Delusional outlook

There is a presumption that faster economic growth in emerging markets drive up corporate earnings as well. This statement isn’t new. Many “supply-side” models of stock market returns are based on macroeconomic performance.

Supply side models assume that the GDP growth of underlying economy flows to shareholders in three steps:

  1. It transforms into corporate profit growth
  2. The aggregate earnings growth translates into EPS growth
  3. EPS growth translates into stock price increases

The thought of high GDP growth in EM’s lead to faster EPS now seems intuitive but in practice research shows contradictory results. See the chart below,EPS has grown at a slower pace than GDP.

In reality, firstly, we need to expand our view to global markets than local markets. With globalisation operations is distributed throughout the world and production processes for these MNC’s is not reflected in country’s GDP. Company’s revenue and share price largely depend on global GDP growth as increasing proportion of products is sold abroad.

Secondly, a significant part of economic growth comes from new enterprises and not by faster growth of existing ones.

In EM’s the finance and resources sectors account for a far larger portion of the stock exchange them they do of domestic corporate sector. Dilution from equity issuance has been far greater in EM’s than in developed ones. Research by Schroders over 10 years to 2017 estimates the dilution across all EM’s at 3.8% p.a. on average, significantly larger than 0.5% p.a. dilution for DM’s.

Rather than dilution, across portfolio most companies have reduced shares on issue, so EPS has risen faster than profits. EPS dilution arising from growth in issued shares is greater than the lower the return on capital. This causes discrepancy between corporate earnings and earnings per share. If companies issue new shares and dilute existing shareholders or if young companies go public, capital increases and the economy grows, but shareholders are not receiving any increase in EPS. In such case, the market capitalization grow much more than shareholders’ returns.

India for example, shows divergence in corporate earnings and GDP growth. As per Aoris Investment Management report on Emerging Market Fallacy, “The profits of all listed and unlisted companies relative to GDP in India declined from a peak of 7.8% in 2008 to 3% in 2018. Over that period, India’s nominal GDP (including inflation) grew at a rate of 12.90% while earnings of Indian companies grew by just 2.6% p.a.”

In few analysis, it is evident that long term equity performance was similar to GDP growth. However, this parallel growth was due to increasing valuations offsetting the dilution effect. Expected economic growth is built into current prices, thus reducing future realized returns. As an example, when Japan’s Nikkei 225 soared to almost 39,000 in late December 1989, investors were bullish about the growth of Japanese economy. When the expected growth did not happen, the stock markets collapsed.

Mobilizing domestic resources is not simply a matter of taxing more, it’s also about taxing better, by expanding the tax base, ensuring an appropriate distribution of the tax burden among taxpayers, simplifying and improving the efficiency of tax administration, bringing tax laws up to date, and making sure that tax administrators know how to audit local and multinational companies alike. The citizenry must see the tax system as being equitable. There is a concern that the trend toward lower taxation of capital (to encourage growth) is making it harder to counter the growing inequality of income and wealth. The growing income and wealth gaps can undermine social cohesion, and ultimately undermine economic growth as well. World Bank flagship report states, “EMDE activity has stalled, in part reflecting the effect of financial stress in some large economies with sizable current account deficits and high exposure to volatile capital flows. Domestic demand across EMDEs has generally moderated and trade flows have softened. High – frequency indicators suggest that the weakness continues, particularly in vulnerable economies.”

Country – specific sectors influence a country’s ability to attract long term financing. Development of domestic capital markets to act as a long term source of financing will support the goal of strong, sustainable and balanced growth. This calls for greater attention to policies and instruments that can lower the risk and strengthen the confidence of investors over a long term horizon.  Domestic resource mobilization is always going to be a main source of funding for development purposes. 

Gaps between investment needs and the availability of appropriate financing often arise not only from the supply side of financing, but also as a result of a weak underlying investment climate, lack of planning and institutional capacity, and the absence of strong regulatory frameworks.

As per FSD report, “GDP growth is expected to remain steady at 3.0% in 2019 and 2020. Most growth forecasts have been revised downwards due in part to the negative effects of trade uncertainty and weakening financial market sentiment.

In current uncertain environment, financial markets are highly susceptible to a sudden shift in investors’ perception of market risk which could result in a sharp and disorderly tightening of global financial conditions. A faster than expected pace of increasing interest rates in systemically important developed economies could have significant spillover effects on the rest of the world, including sharp reversal of capital flows from developing countries. This would likely have a larger impact on countries with weak macroeconomic fundamentals, large external imbalances, high indebtedness and a high share of short term liabilities among capital inflows and low policy buffers. Currency depreciation can also dampen capital investment through balance sheet effects.”

In Conclusion “EPS growth in EM’s has fallen significantly short of GDP growth over the last decade. You may feel bullish on the Chinese economy or the recovery prospects in Brazil. However, counterintuitive though this may feel, your view on an economy should have no bearing on your expectation for EPS growth from that particular country.”

file:///C:/Users/rites/Desktop/The%20Emerging%20Market%20fallacy.pdf