Power play

Emerging Market spreads are inversely proportional to the US Dollar and recession causes strong US Dollar, not the other way around. These are two basic notions in economics and these two possess the capability of creating a havoc. These notions are driven by many factors which causes skewness in the upside or downside depending on risk taking capability of the investors and this gives central banks globally a huge responsibility to make decisions not only to advance the country domestically but also to analyse how the decision may affect other economies. In today’s scenario, who holds all the cards? US? China?

Fed was hawkish in 2018, Europe which is still weak, US Tariffs & US – China trade war sucked global dollar liquidity and already fragile economies went pale.  A strong dollar causes damage to external economies, people lose their purchasing power and most affected by are emerging markets. When balance sheet reductions paused, Fed also became dovish, trade war silenced, this change in stance made room for dollar to weaken. A weak dollar saw inflows in EM economies and the stocks rallied. Investors became cautiously bullish in their net positions and have already priced in ‘no change’ decision of Fed in 19-20 March meeting leading to stability in the markets for now.

Fed has no option but to shift from being hawkish as higher interest rates causes tight financial conditions and global economic weakness. Hiking further would not only bleed the world but US too. US is currently locked in with China’s economy and inch away from the double edged sword with all the cards which they once held shifting into Chinese hands. In rear view, China seems to be driving the decisions of Fed. A weak dollar makes a strong Yuan, a strong Yuan makes not only Chinese economy healthy but all the neighbouring and emerging market economies. A world where USD and Yuan move together have never existed, the world reap benefits from their negative correlation. Even though China is currently witnessing a slowdown, forex is always to the rescue with Chinese realising gains from strengthening Yuan and falling inflation, boost from imports from its trading partners and also leading a way for Trump in 2020 election. This economic cycle would play in his favour and to extend the cycle, a pause in rate hike, pause in balance sheet reductions is the only way in for him.

There is a downside to this analysis which could cause some investors to remain net short. The point of difference between 2016 rate hike and 2018 rate hike is that in 2016 global central banks were not in tightening mode like Fed but in 2018, Fed when turned dovish, global central banks were also softening. This tandem movement of Fed and central banks have kept emerging markets in a fragile state if not crumbling and the yields provided by short term US treasuries are still more attractive and stable. This fear is keeping some investors from take a long position and they rather prefer holding on to existing portfolio.

Technical analysis shows us that a golden cross is emerging and higher growth is expected if the economic situation remains unchanged. Equities and commodities like copper and oil are pricing in the positive effect of China stimulus and pressure on commodities caused by rate hikes is lifting. Copper which is seen as an indicator of global growth is moving opposite to 10 year treasury yield. 

In late 2018, under pressure from Trump administration and to prevent further domestic slowdown, China implemented tax cuts to increase consumption, reduced the rate of required reserves for lenders to encourage borrowing and stimulated fiscal multiplier to boost demand which along with weaker USD led to strengthening of Yuan and rally in demand dependent commodities.  China in effect is navigating this ‘reflation trade’. A weak Yuan hurts US manufacturing sector so to stretch out economic cycle for 2020 election in US, Trump would not mind a weak USD for stronger Yuan out of China which will recover global growth and reverse inflation expectations. China’s (almost) healthy economy keeps all the neighbouring economies in shape and any poking in China destabilize other Asian and EM economies. So, who holds all the cards? Xi Jinping?

(with inputs from Apra Sharma)
https://eur02.safelinks.protection.outlook.com/?url=https%3A%2F%2Fwww.nedbank.co.za%2Fcontent%2Fdam%2Fnedbank-crp%2Freports%2FStrategy%2FNeelsAndMehul%2F2019%2FMacroInsights_CBvsTrade_190312.pdf&data=02%7C01%7C%7C9bf3ed55dbcb468fb47b08d6a6fbd1ae%7C84df9e7fe9f640afb435aaaaaaaaaaaa%7C1%7C0%7C636879999342546238&sdata=V6CwzwhsUpi%2BewTQsj8wHFE2jrue3I%2B9HUchlZH3BJw%3D&reserved=0

Charts That Matter- 18th March

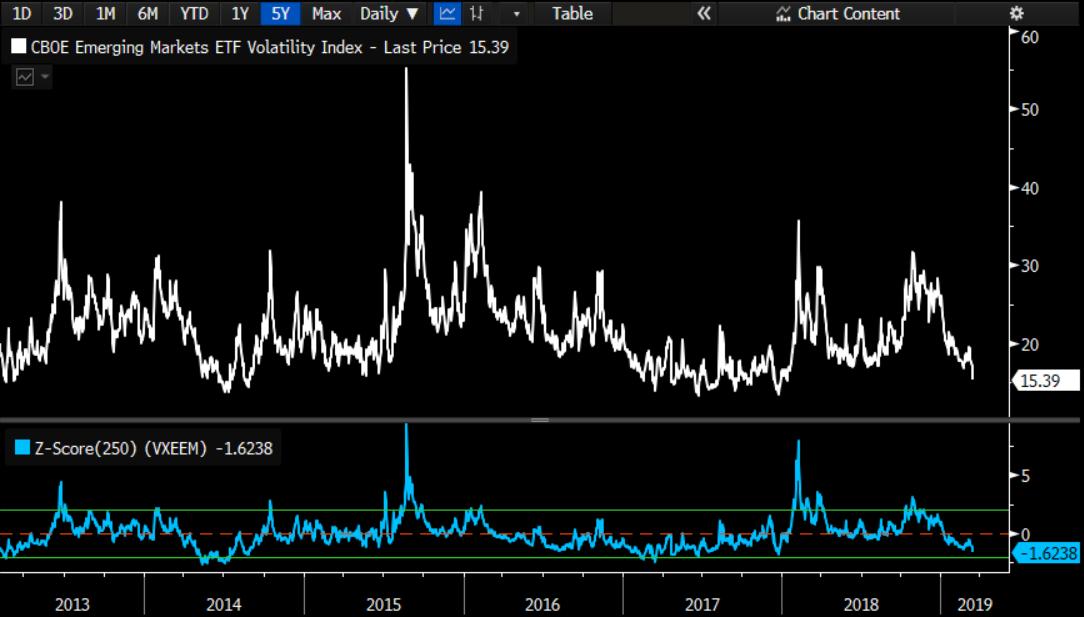
Volatility collapses in Emerging Markets. Suggest euphoria which is seen in EM currencies also along with Chinese Yuan.

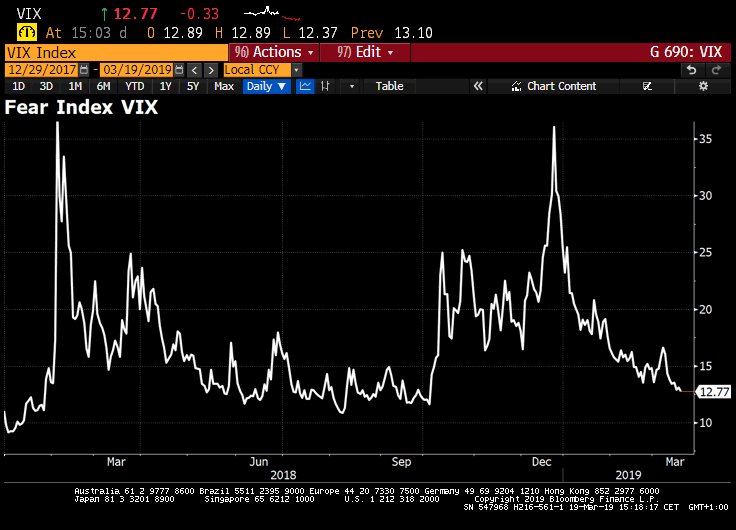
Panic over? It is according to the derivative markets: Even Wall Street’s fear gauge VIX drops to over 5mth low.

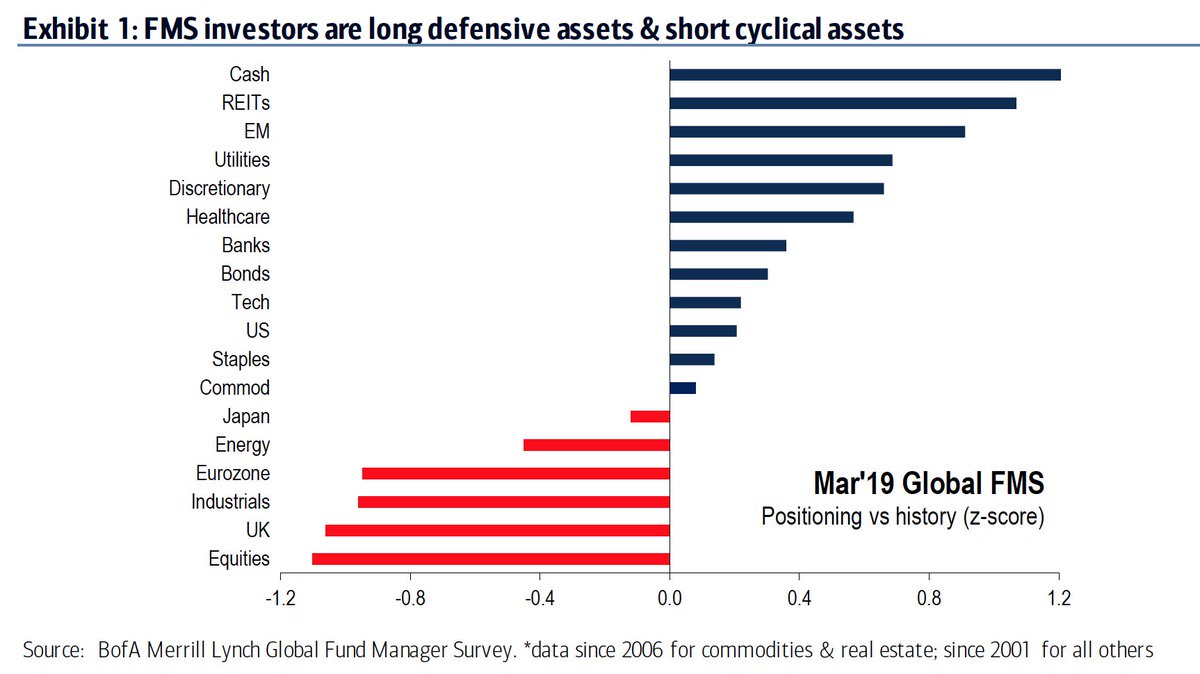
“Pain trade” for stocks is still up: In BofAML March Global Fund Manager Survey (FMS) profit expectations rose, rate expectations fell BUT allocations to stocks dropped to their lowest level since Sep ’16.

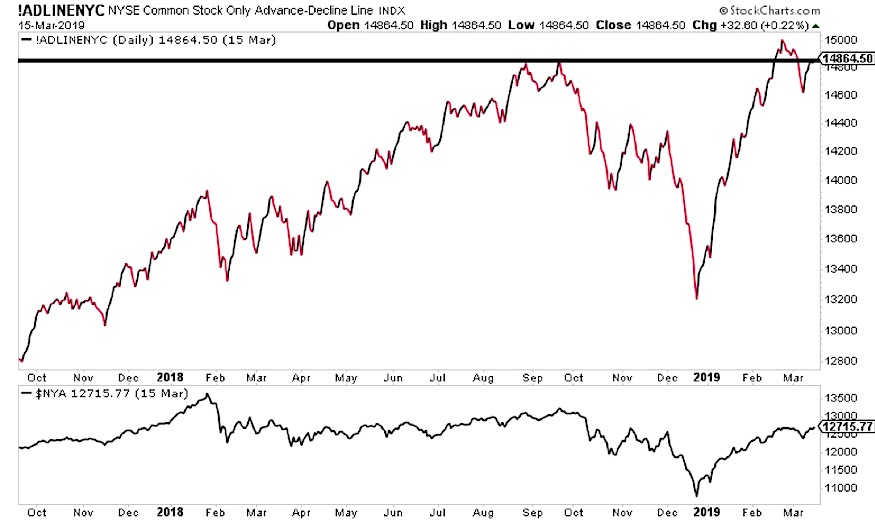
Below is a look at the broadest measure of advance-decline line breadth, the NYSE stock only Advance-Decline line. A simple failure to hold new highs in breadth marked the top in the NYSE in the fall.  Now, breadth is notably diverging from price after a massive rip while it has stopped right at that old September high area.  Aaron writes…We have evidence of both a longer term bullish sign with a shorter term caution sign.  Thus, it seems prudent to be aware of downside risks now while keeping in mind the longer term framework, supporting an eventual move to new highs.

nyse advance decline line bullish news stock market breadth march 18 year 2019

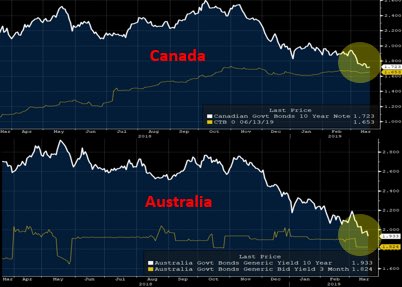
Bond markets are sniffing out a global recession… Canada & Australia just a bps away from full inversion

Store Power

A few offline stores went bankrupt blaming their loss on online sales while few sectors in offline stores have seen a slight rise in sales compared to last year owing to increased consumer confidence in retail stores when government had a shutdown or the holiday season that just went. Is it that the job of offline stores have become stagnant due to e commerce or they could not keep up to the changing business environment? Many offline stores now have gone online to sell their product acknowledging that online sales will have larger share than offline. Shops which in time couldn’t adjust to new environment are shutting down giving e commerce a bad face but is it really their fault?

(with inputs from Apra Sharma)

Through a glass, darkly!

The most widely used hedge for stocks is the US Treasury market which is currently seeing a flattening trend and sending mixed signals to the investors. The stocks have rallied for quite a few sessions now yet only two sectors, XLU ( utilities) and XLRE (real estate) have been trading above its 2018 highs. XLU has rallied over 17.3% and one of the contributing factors was lower treasury yields. Generally speaking, a positive correlation between stocks and long term treasury bonds is viewed as a bad sign for stocks. As fed took a dovish stance and Powell told CBS, “We want inflation to be anchored at 2 percent”, the expecting investors waiting for yield curve to steepen met with disappointment.

The curve tend to remain flat and could only steepen if there is a rate cut (last year there were 4 rate hikes) as expectation of rate cuts first leads to bullish flattening and then steepening depending upon inflation expectations. Bloomberg noted that the forward curve have already priced in a steepening of the yield curve doubling to about 30 basis points on Wednesday when the above spread was at about 15.5 basis points.

US government has been borrowing heavily with budget deficit figure close to $1trillion a year. The inflation target is vehemently kept at 2 percent to avoid deflationary trap whose target has been Japan and recently Europe. Powell said in his March 8 speech, “The fed could adopt a make – up strategy – letting inflation run above target during good times like now to offset the periods of slower price rises.”

Both the 5 year and 10 year TIPS yield show curve wanting to settle around 2 percent. Currently long term bonds are viewed as a good hedge for stocks. Term premiums was 0.72 percentage point for 10 year treasuries above the all-time low of July 2016. A lower term premium means lower bond yields which in a healthy market should be followed by higher stock returns.

Hence based on term premia the bond market appears cheap compared to equity markets.

(with inputs from Apra Sharma)

The Twenty Craziest Investing Facts Ever-Michael Batnick

1. Since 1916, the Dow has made new all-time less than 5% of all days, but over that time it’s up 25,568%.
95% of the time you’re underwater. The less you look the better off you’ll be.

2. The Dow has compounded at less than 3 basis points a day since 1970. Since then its up more than 3,000%.
Compounding really is magic.

3. The Dow has only been positive 52% of all days. The average daily return is 0.73% when it’s up and -0.76% when it’s down.
See above.

4. The Dow has spent more time 40% or more below the highs than within 2% of the highs (20.6% of days vs. 18.4% of days)
No pain no gain.

5. The Dow gained 38 points in the 1970s
See above.

6. Why am I using the Dow instead of the S&P 500? They’re effectively the same thing. The rolling one-year correlation since 1970 is .95.
Stop wasting your time on this.

7. At the low in 2009, U.S. stocks were back to where they were in 1996.
Stocks for the long-run. The very long-run. Usually. Sometimes.

8. At the low in 2009, Japanese stocks were back to where they were in 1980.
See above.

9. U.S. one-month treasury bills went 68 years with a negative real return.
What’s safe in the short-run can be risky in the long-run.

10. At the bottom in 2009, long-term U.S. government bonds outperformed the stock market over the previous 40 years
Stocks generally outperform bonds, but there are no guarantees.

11. Gold and the Dow were both 800 in 1980. Today Gold is $1,300/ounce, the Dow is near 26k.
Cash flows > commodities.

12. Over the last twenty years, Gold is up 340%. Stocks are up 208%, with dividends.
You can support any argument by changing the start and end dates.

13. Since 1980, Gold is up 153%. Inflation is up 230%.
See above.

14. CTAs gained 14% in 2008 when stocks lost 37%. Since 2009 they’re up 2.5%. Stocks are up 282%.
Non-correlation cuts both ways.

15. If you had invested from 1960-1980 and beaten the market by 5% each year, you would have made less money than if you had invested from 1980-2000 and underperformed the market by 5% a year (A Nicky Numbers Special)
When you were born > almost everything else.

16. The Dow lost 17% in 1929, 34% in 1930, 53% in 1931 and 23% in 1932.
Be grateful.

17. Warren Buffett is the greatest investor of all-time. In the 20 months leading up to the dotcom peak, Berkshire Hathaway lost 45% of its value. The NASDAQ 100 gained 225% over the same time.
No pain no premium.

18. 96% of U.S. stocks generated a life-time return that match one-month treasury bills.
The reason why so many mutual funds fail to beat the market is because so many stocks fail to beat the market.

19. Dow earnings were cut in half in 1908. The index gained 46%.
The stock market ≠ the economy.

20. In 1949 the stock market was trading at 6.8x earnings and had a 7.5% dividend yield. 50 years later it reached a high of 30x earnings and carried just a 1% dividend yield.
You can calculate everything yet still not know how investors are going to feel

Market view

Global economy is weakening and may be on the verge of recession by third quarter of this year. The jump in global growth during Oct- Dec quarter ( 2018) was due to inventory rebuilding as companies increased their buying to beat US tariffs. Unfortunately it lead to upfronting of GDP in last quarter and final sales in US ,Europe , China etc does not paint a rosy picture going forward. Somehow it looks like that the global consumers are tapped out and will rather be saving than continuing on their borrowing binge to support the GDP. Citibank economic surprise index across globe continues to paint a grim picture.

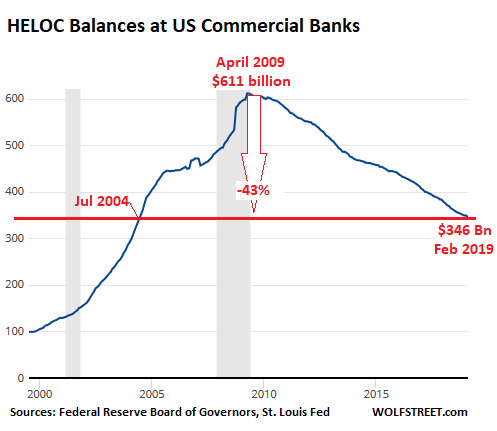
The following graph is quite stark where HELOC balances of US banks is now at 15 years low. US household have been single large buyer of Global goods and they are tightening their belts

Canadian economy was also the beneficiary of US consumer tariffs in last quarter with Chinese buyers of Agricultural commodities deciding to step up purchases from Canada at the expense of United states. The employment generation continues in Canada although we can question the quality of jobs which are getting created ( low pay jobs). The Canadian housing market is feeling the ripples with withdrawal of Chinese demand from Vancouver real estate where sales volume has just come to a standstill amid lower prices. The lethal mix of highly indebted Canadian consumer who is more leveraged to real estate than equity markets mean that Canada is at higher risk of recession then its neighbor. The Canadian dollar continues to weaken and looks expensive along with Canadian growth stocks. On the other hand Bonds are quite cheap compared to equities across north America and we could actually see a bullish flattening in the curve over next few months.

Charts That Matter- 12th March

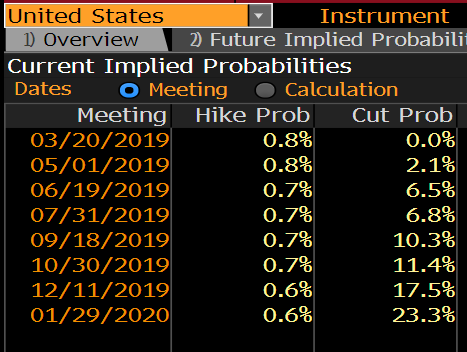
Futures traders are pricing in a 23% chance of a rate cut at the beginning of 2020, and basically no chance of another hike this year. https://www.bloomberg.com/news/articles/2019-03-12/u-s-core-inflation-unexpectedly-cools-on-autos-drug-prices …

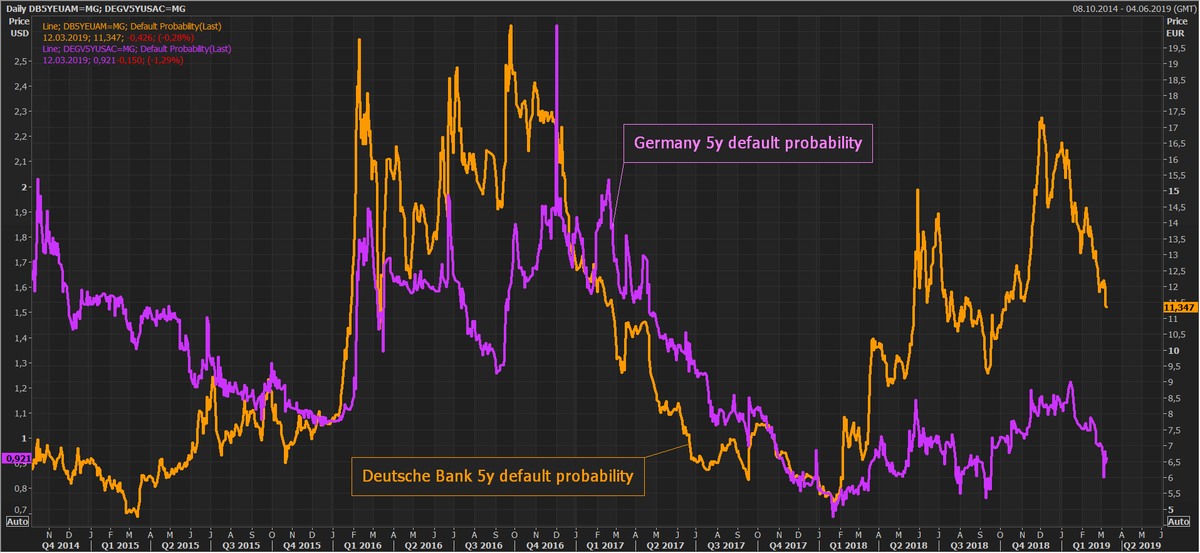
This chart highlights why the German govt is orchestrating a merger of Deutsche Bank and Commerzbank. Germany’s 5y default probability trades in tandem w/ Deutsche Bank’s default risk as Deutsche is too big too fail and so doom loop alive & kicking.

This is Inflation

UNDERSTAND THE DIFFERENCE BETWEEN REAL AND NOMINAL Are wages up 9x since 1964 or are they up 0.1x ?

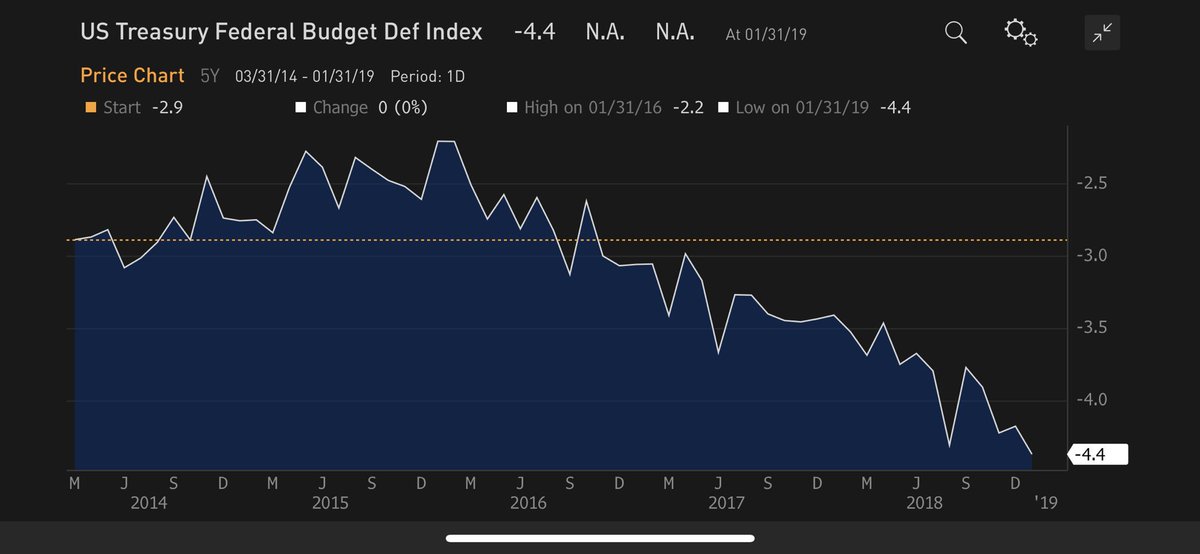
The US Budget deficit during the last 5 years!. Chinese stopped buying US debt in 2015 ,still US 10 year has barely budged in all these years

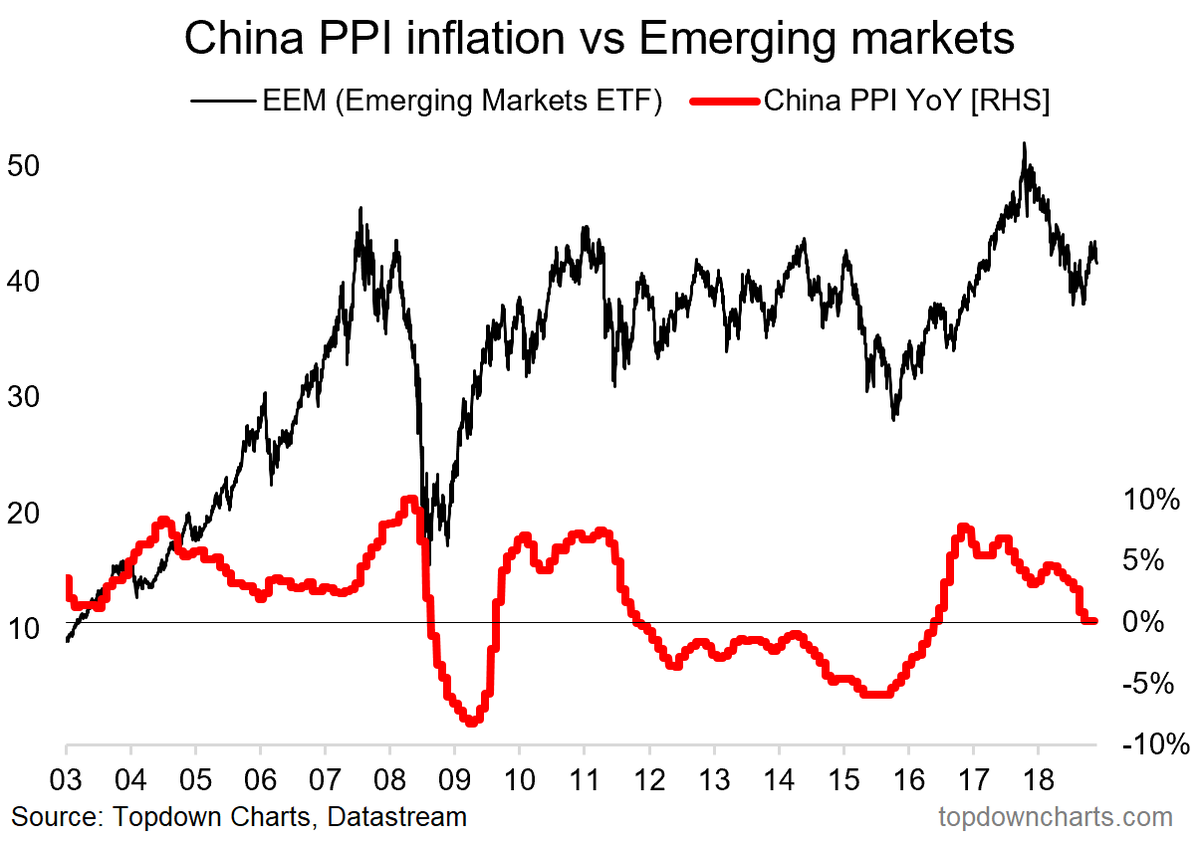
China PPI inflation has moved decisively toward deflation, and that could be a problem for emerging markets… https://www.linkedin.com/pulse/top-5-charts-week-callum-thomas-16d/ …

Jaguar on a Whirly Ride

Tata had a ‘beginners luck’ when it acquired Jaguar and Land Rover in 2008 from Ford Motors Co., named it Jaguar Land Rover Automotive PLC and launched Range Rover Evoque which became huge success and a profit making machine for Tata’s. The company’s market value soared above $29bn in 2015.  Then came a speed bump.

China’s government decided to phase out combustion engines joining UK and France to eliminate gasoline and diesel engines by 2030. China and UK are the two largest market in auto sector and JLR was heavily reliant on its sales in China and production in UK.

First, sluggish demand and collapsing shipments in China started a wave of realisation for JLR that not all the reasons for its fall were global but also of ignored internal quality control checks. Jaguar had 148 problems and Land Rover had 160 problems per 100 vehicles. John Zeng, MD of LMC Automotive Shanghai said, “Quality issues have added to JLR’s troubles in China where the company had multiple recalls. This has greatly jeopardized Chinese consumers’ confidence in brand value. JLR’s quality control capability and its after sales network are not good enough to support its volume expansion or help it compete with rivals.” JLR is apparently restructuring its network in China but is falling behind its German rivals such as Mercedes, Audi and BMW.

Second, it is exposed to risks of disorderly Brexit and it would be disastrous for JLR if Britain go for no – deal Brexit. They would be affected by disrupted trade flows between Britain and continent due to close links between assembly plants and suppliers on both sides of English Channel.

Europe’s struggles include a broader economic slowdown with Germany at risk for slipping into a technical recession after dramatic plunge in industrial activity late last year. The slump in region’s biggest economy was partly driven by carmakers battling to adapt to new emissions testing procedures which caused production bottlenecks and sales gyrations across the regions, noted Bloomberg.

Third, Tata, India’s biggest conglomerate was caught in a power struggle when Ratan Tata fired his successor, Cyrus Mistry. The company decided to eliminate 4,500 jobs or about 10 percent of global workforce. The cherry on this cake was on 7th February it told investors about its plan to write down its JLR’s investment by $3.9bn.

Tata Motors took a sharp fall and had their biggest drop in 26 years accompanied by being downgraded to BB- from BB by S&P Global Ratings for second time in five months. The icing around the cherry is that JLR also needs to raise $1bn in just over a year to replace maturing bonds, a tricky test for them given their debt in S&P’s junk category.

As per Tata, this is all part of their plan. “As part of JLR’s plans to achieve 2.5 billion pounds ($3.2bn) of investment, working capital and profits improvements by March 2020, they would slash their global workforce by 4,500. This is expected to result in a one-time exceptional redundancy cost of around 200 million pounds for luxury unit of Tata Motors. The costs of voluntary scheme will be recognised in quarter ending March 31.”

There are rumours of Tata exploring the possibility to sell its luxury car unit, Tata executives deny by implying a possibility of investing massively in UK though no formal statement has been announced. If this plan goes through it seems they could get some relief in tough weeks in the global economy.

JLR is also making efforts to step up in China and working a way around the Brexit uncertainty, without letting the corporate power struggle hindering them to make a mark again globally. Land Rover still ranks as most valuable major brands owned by Tata Group. The automotive marque was worth an estimated $6.2bn last year according to Interbrand. Tata’s like any other company are doing whatever is in their hand to revive the company

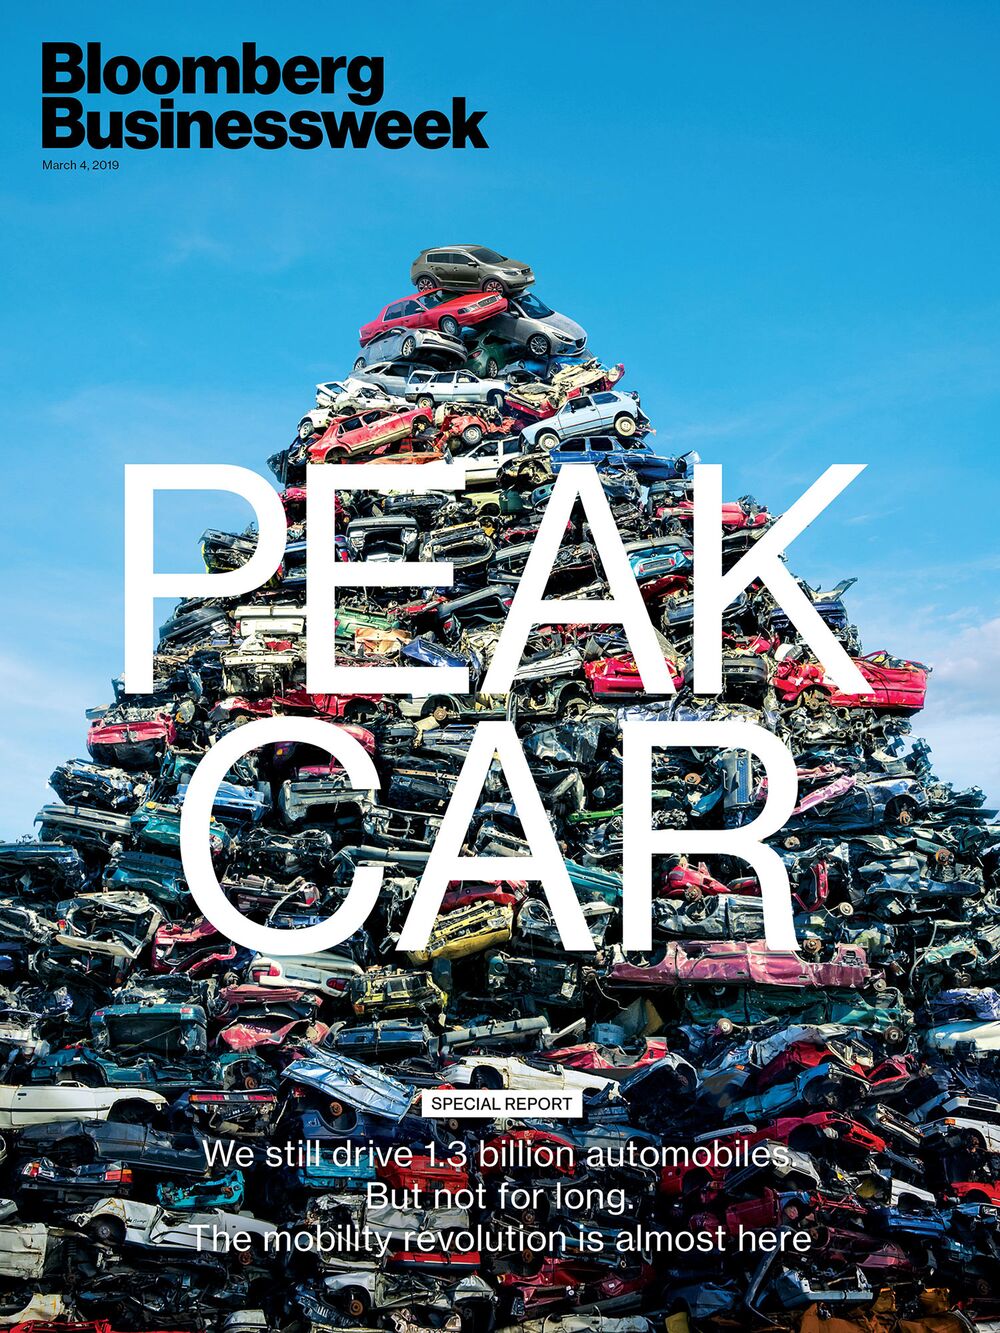
bw-cover-1911-peak-car

but what if as Bloomberg writes ….. on a macro level We have reached PEAK CAR SALES

(with inputs from Apra Sharma)

Charts That Matter- 6th March

US High Yield credit spreads at their tightest levels in over 3 months, 152 bps lower than Dec 27 levels. Credit always leads equities

The US consumer is a risk factor for the global economy. The US consumer accounts for 17% of global GDP and is more important than China. Deutsche Bank

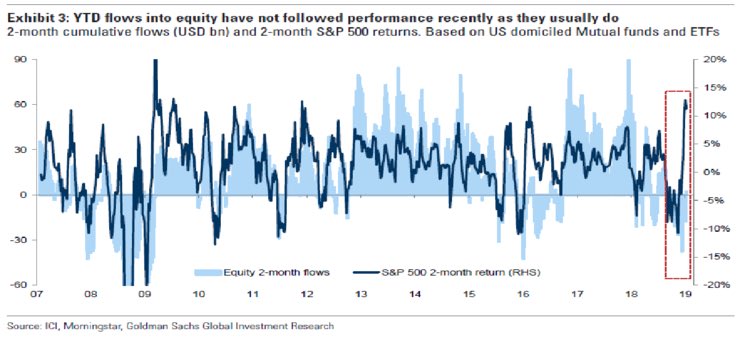
With so few investors buying America’s $5 trillion post-Christmas stock rally, Wall Street is starting to wonder whether apathy could kill the melt-up. Wall Street strategists question sustainability of 2019 gains. https://www.bloomberg.com/news/articles/2019-03-05/goldman-sees-crisis-echo-in-big-stock-rally-bereft-of-buyers …

U.S. Credit Card Debt Closed 2018 at a Record $870 Billion, add 12 million account holders go delinquent in Q4. https://www.bloomberg.com/news/articles/2019-03-05/u-s-credit-card-debt-closed-2018-at-a-record-870-billion …