Doug Noland writes… “Goldilocks with a capital ‘J’,” exclaimed an enthusiastic Bloomberg Television analyst. The Dow was up 747 points in Friday trading (more than erasing Thursday’s 660-point drubbing) on the back of a stellar jobs report and market-soothing comments from Fed Chairman “Jay” Powell.
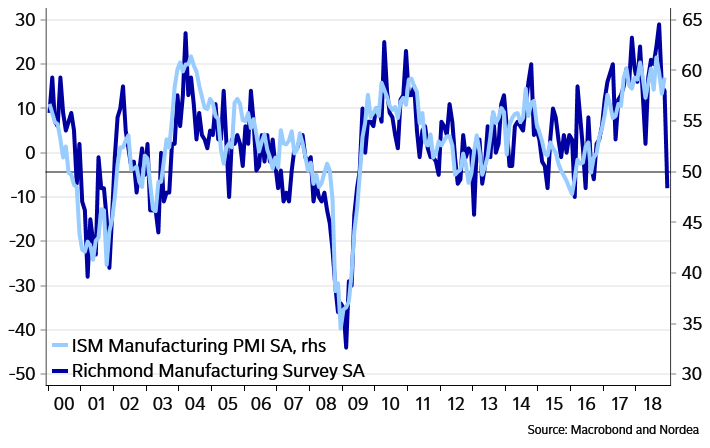
December non-farm payrolls surged 312,000. The strongest job gains since February blew away both estimates (184k) and November job creation (revised up 21k to 176k). Manufacturing jobs jumped 32,000 (3-month gain 88k), the biggest increase since December 2017’s 39,000. Average Hourly Earnings rose a stronger-than-expected 0.4% for the month (high since August), pushing y-o-y gains to 3.2%, near the high going back to April 2009.
Just 90 minutes following the jobs report, Chairman Powell joined Janet Yellen and Ben Bernanke for a panel discussion at an American Economic Association meeting in Atlanta. Powell’s comments were not expected to be policy focused (his post-FOMC press conference only two weeks ago). But the Fed Chairman immediately pulled out some prepared comments, perhaps crafted over the previous 24 hours (of rapidly deteriorating global market conditions).
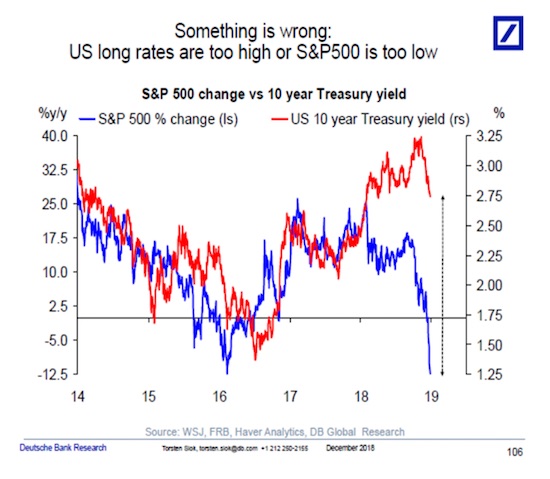
Chairman Powell: “Financial markets have been sending different signals – signals of concern about downside risks, about slowing global growth particularly related to China, about ongoing trade negotiations, about – let’s call – general policy uncertainty coming out of Washington, among other factors. You do have this difference between, on the one hand, strong data, and some tension between financial markets that are signaling concern and downside risks. And the question is, within those contrasting set of factors, how should we think about the outlook and how should we think about monetary policy going forward. When we get conflicting signals, as is not infrequently the case, policy is very much about risk management. And I’ll offer a couple thoughts on that… First, as always, there is no preset path for policy. And particularly, with the muted inflation readings that we’ve seen coming in, we will be patient as we watch to see how the economy evolves. But we’re always prepared to shift the stance of policy and to shift it significantly if necessary, in order to promote our statutory goals of maximum employment and stable prices. And I’d like to point to a recent example when the committee did just that in early 2016… As many of you will recall, in December 2015 when we lifted off from the zero bound, the median FOMC participant expected four rate increases for 2016. But very early in the year, in 2016, financial conditions tightened quite sharply and under Janet’s leadership, the committee nimbly – and I would say flexibly – adjusted our expected rate path. We did eventually raise rates a full year later in December 2016. Meanwhile, the economy weathered a soft patch in the first half of 2016 and then got back on track. And gradual policy normalization resumed. No one knows whether this year will be like 2016, but what I do know is that we will be prepared to adjust policy quickly and flexibly and to use all of our tools to support the economy should that be appropriate to keep the expansion on track, to keep the labor market strong and to keep inflation near 2%.”
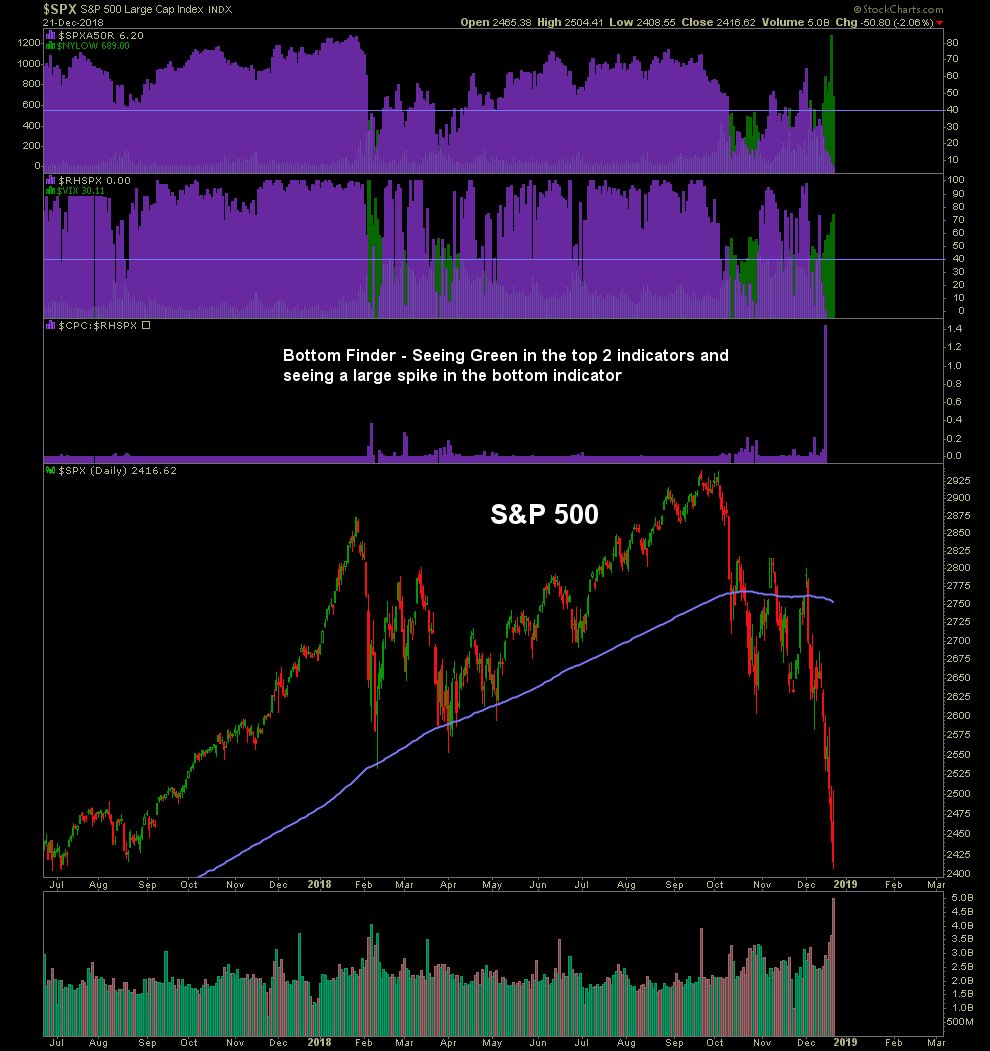
Powell heedfully hit key market hot buttons: “…Policy is very much about risk management.” “We will be patient as we watch to see how the economy evolves…” “…Always prepared to shift the stance of policy and to shift it significantly if necessary…” “We will be prepared to adjust policy quickly and flexibly and to use all of our tools to support the economy…” A Bloomberg headline: “Powell Shows He Cares About Markets.” Markets heard assurances of an operative “Fed put” – with rate cuts and QE (“all of our tools”) available when demanded – and it was off to the races. The Nasdaq Composite surged 4.3%, the small cap Russell 2000 3.8% and the S&P500 3.4%. The Goldman Sachs Most Short index rose 3.8% in Friday trading.
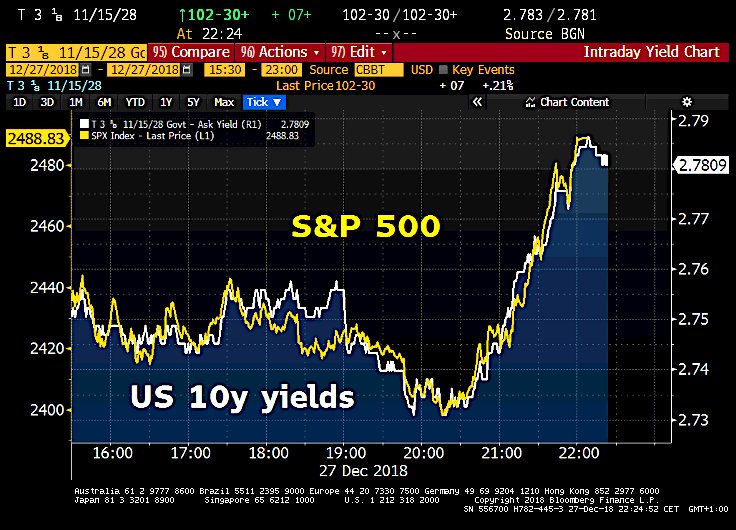
Treasury investors, of late fixated on mounting global fragilities, saw the data, listened intently to Powell, glared at surging stock prices – and recoiled. Ten-year yields jumped 11 bps in Friday trading, with five-yields surging 14 bps. Friday’s equities buyers’ panic masked troubling market behavior over the previous week – important developments not to be swept under the rug.
January 4 – Financial Times (Robin Wigglesworth): “Housebuyers always carefully study the kitchen fittings and measure up the airy living room, but often neglect to check whether the pipes are up to scratch. Investors act similarly, often forgetting that dodgy market plumbing can lead to a smelly catastrophe. There has been no shortage of culprits offered up to explain the worst month for US markets since the financial crisis, with conveniently nebulous ‘algorithms’ emerging as a particularly popular bogeyman. But on New Year’s Eve a little-watched corner of the US money markets offered up clues as to another, arguably stronger candidate as a contributor to the recent volatility. On Dec 31, the rate on ‘general collateral’ overnight repurchase agreements suddenly rocketed from 2.56% to 6.125%, its highest level since 2001. This was a huge move, the single biggest outright percentage jump since at least 1998. The repo rate has since normalised, but the severity of the spike indicates that at least part of the market’s plumbing gummed up.”
The Global Markets’ Plumbing Problem didn’t unclog with the passing of year-end funding pressures.
January 3 – Bloomberg (Ruth Carson and Michael G Wilson): “It took seven minutes for the yen to surge through levels that have held through almost a decade. In those wild minutes from about 9:30 a.m. Sydney, the yen jumped almost 8% against the Australian dollar to its strongest since 2009, and surged 10% versus the Turkish lira. The Japanese currency rose at least 1% versus all its Group-of-10 peers, bursting through the 72 per Aussie level that has held through a trade war, a stock rout, Italy’s budget dispute and Federal Reserve rate hikes. Traders across Asia and Europe are still seeking to piece together what happened in those minutes when orders flooded in to sell Australia’s dollar and Turkey’s lira against the yen… Whatever the cause, the moves were exacerbated by algorithmic programs and thin liquidity with Japan on holiday.”
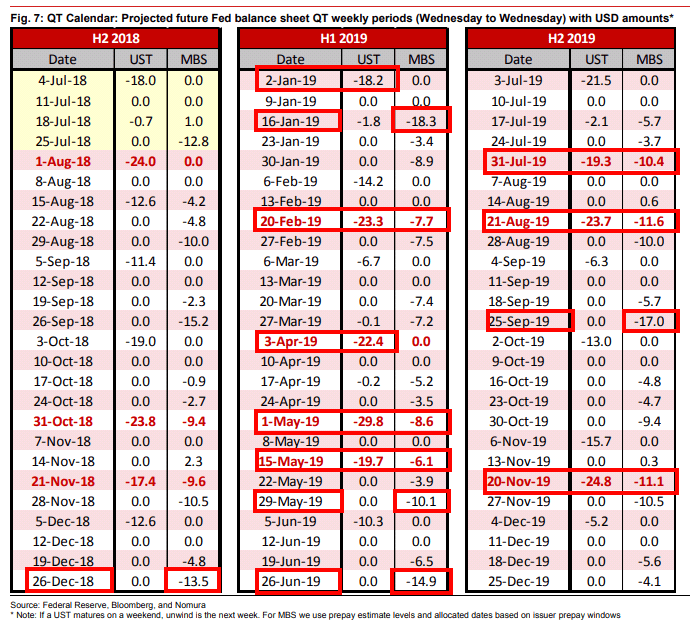
Thursday’s market gyrations hinted at a quite disconcerting scenario: illiquidity, dislocation and a “seizing up” of global markets. The day saw an 8% move in the yen vs. Australian dollar – two major – and supposedly highly liquid – global currencies. Trading in the yen dislocated across the currencies market, a so-called “flash crash.” We’ve seen the occasional “flash crash” in equities over the past decade. These abrupt bouts of selling and illiquidity reversed in relatively short order, with recovery only emboldening animal spirits. These recoveries, in contrast the current backdrop, were supported by expanding global central bank balance sheets (QE/liquidity).
I’m concerned that Thursday’s currency “flash crash” has potentially dire implications. Together with other key market indicators, evidence of systemic illiquidity risk is mounting. De-risking/deleveraging dynamics continue to gain momentum globally. Moreover, there are literally hundreds of Trillions of currency-related derivatives transactions – a byzantine edifice fabricated on a flimsy assumption of “liquid and continuous markets.”
I suspect the “global” derivatives marketplace is today much more global than the U.S.-dominated market heading into the 2008 crisis. This implies scores of new players, certainly including Chinese and Asian institutions. This suggests different types of strategies, complexities, counterparties and risks more generally. It certainly raises the issue of regulatory oversight along with potential policy challenges in the event of a globalized market dislocation. Interestingly, the AIG bailout was mentioned in Friday’s Fed head panel discussion. It’s been about a decade of derivative risk complacency.
When it comes to current global systemic liquidity risks, the Japanese yen may be the single-most critical global currency. Trillions have flowed out of Japan to play higher global yields. Zero Japanese rates and, importantly, negative market yields forced so-called “Mrs. Watanabe” to forage global securities markets in search of positive returns.
Years of radical monetary policies coerced enormous quantities of Japanese household savings into the realm of international securities and currency speculation. Likely an even greater source of global liquidity materialized from “carry trade” speculations – borrowing at zero (or negative yields) in Japan to finance levered holdings in higher-yielding instruments around the world – certainly including in Australia.
Keep in mind also that massive (reckless) BOJ balance sheet growth seemed to ensure a weak Japanese currency. Prospective yen devaluation has been integral to the yen becoming a prevailing “funding” currency for global speculation throughout this historic global government finance Bubble period (what’s better than borrowing for free in a currency you expect to be worth less in the future?). “King dollar,” with its positive rate differentials, shrinking Fed balance sheet and booming markets, bolstered the case for the yen as dominant global funding currency.
Thursday’s yen dislocation was quickly transmitted across global bond markets. After beginning the new year at an incredibly meager 0.005%, Japanese 10-year “JGB” yields in Friday trading dropped to a low of negative 0.054%, before closing at negative 0.045% – a 13-month low. Ten-year Treasury yields began Wednesday trading at 2.69%. Yields then sank to as low as 2.54% in late-Thursday trading, an almost one-year low. At that point, Treasury yields had collapsed 70 bps since the 3.24% closing yield on November 8th. And after beginning 2019 at 23 bps, German 10-year bund yields sank to as low as 15 bps in Thursday trading (down 30bps since Nov. 8th).
Italian yields, after trading Wednesday at a five-month low 2.66%, abruptly reversed course Thursday to close the session 20 bps higher at 2.86% (ending the week up 16bps to 2.90%). With their relatively high yields, Italian bonds have likely been a target of Japanese savers and yen “carry trade” speculators. Curiously, Portuguese 10-year yields, trading down to 1.69% Wednesday, reversed course and traded as high at 1.82% Friday before ending the week up nine bps to 1.81%. This week saw spreads to German bunds widen 19 bps in Italy, 12 bps in Portugal, nine bps in Spain and seven bps in Greece. European high-yield (iTraxx Crossover) CDS was up 12 bps for the week at Thursday’s close, the high going back to June 2016. European bank index CDS prices also rose to two-year highs in Thursday trading.
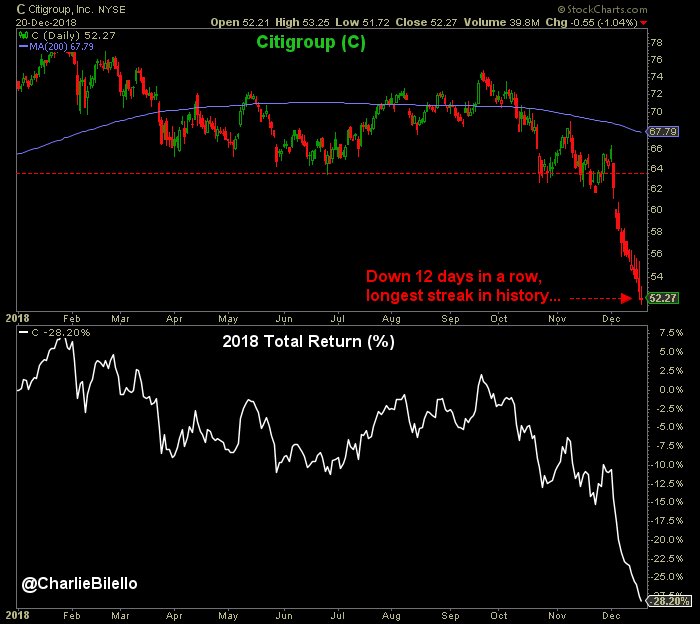
It’s worth noting that Goldman Sachs Credit default swap (5yr CDS) prices surged an eye-opening 19 bps in Thursday trading to 129 bps, the high going back to the early-2016 market tumult period. Goldman CDS traded below 60 in early-October, before ending October at 77 bps, November at 87 bps and closing out 2018 at 106 bps. Deutsche Bank CDS rose seven bps Thursday to 218 bps, near the highest level since 2016. Many large financial institutions saw CDS prices rise this week to highs going back to 2016 (Goldman up 17bps, Morgan Stanley 14 bps, Nomura 11 bps, Citigroup 9 bps and BofA 8 bps).
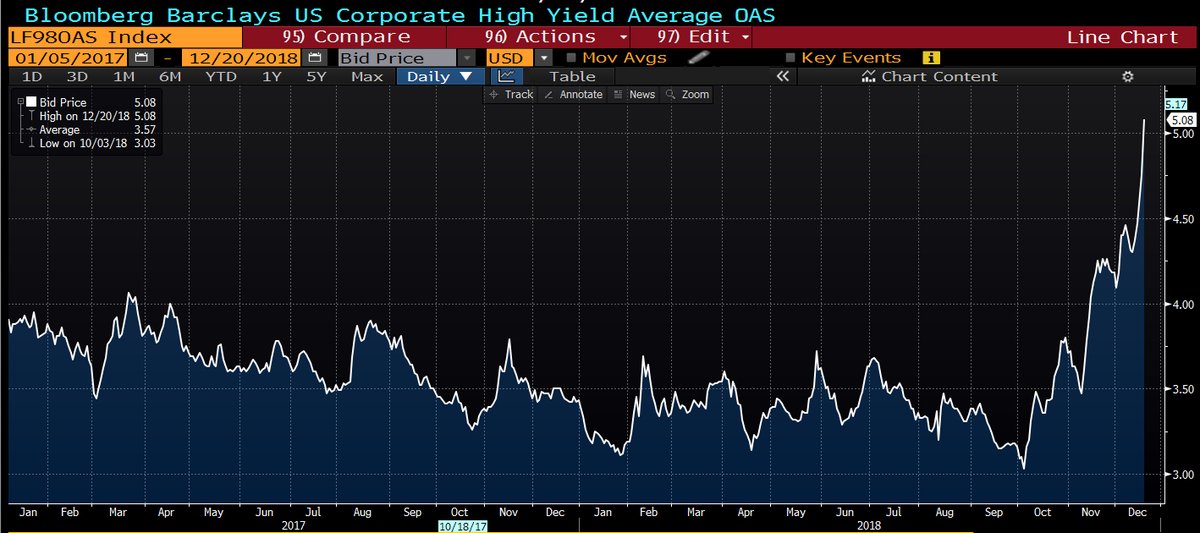
U.S. junk bonds were under significant pressure. U.S. high-yield corporate bond yields (Bloomberg Barclays average OAS index) jumped 10 bps Thursday to 5.37%, the high going back to July 2016. Energy-related debt was not helped by WTI crude trading as low as $44.35 in Wednesday trading, before reversing course and ending the week up almost 6% to $47.96. Investment-grade corporate spreads to Treasuries traded Thursday to new two-year highs (and narrowed little Friday).
Gold is worthy of a mention. Spot bullion traded to $1,299 Friday morning (pre-payrolls/Powell), the high since June. Bullion gained $10 in Thursday trading and was up $18 for the week at Friday highs (before closing the week up $4 to $1,285). As global systemic risk builds, Gold is demonstrating safe haven attributes.
And speaking of global systemic risk: China.
January 2 – Wall Street Journal (Nathaniel Taplin): “Champagne or no, New Year’s Eve must have been a somber affair for China’s top leadership, with word that manufacturing activity declined in December for the first time since 2016. The bad news from the official purchasing managers index was confirmed Wednesday by the privately compiled Caixin index, which further showed new orders in December down for the first time in 2½ years. It’s a sign that nine months of monetary easing by the central bank has failed to boost lending to the real economy, though it has succeeded in pushing housing and government-bond prices into bubbly territory. This kink in China’s monetary-policy machinery bodes ill for 2019, and makes predictions that growth could bottom out in the first quarter look optimistic. Where banks are lending again, it’s mostly to other financial institutions and the government, not the cash-starved private companies that really drive growth.”
Hong Kong’s Hang Seng index dropped 2.8% during the first trading session of 2019 (down 3.6% y-t-d at Thursday’s lows). The Shanghai Composite was down more than 2% y-t-d as of early Friday, trading at the lowest level since November 2014. An abrupt 3% rally pushed the index positive (up 0.8%) for the first few sessions 2019. The People’s Bank of China Friday announced another reduction in reserve requirements (0.5%).
From Reuters (Kevin Yao and Lusha Zhang): “The announcement came just hours after Premier Li Keqiang said China would take further action to bolster the economy, including reserve requirement ratio (RRR) cuts and more cuts in taxes and fees, highlighting the urgency to cope with increasing headwinds. ‘This speedy RRR cut with great intensity fully demonstrates the determination of policymakers to stabilize growth,’ said Yang Hao, an analyst at Nanjing Securities.”
It’s hardly coincidence that Powell’s market-pleasing comments followed by only a few hours the PBOC’s policy move. The situation has turned more serious – in China, in global finance and in U.S. markets. Apple’s Thursday cut in earnings guidance was one more important indication of rapidly slowing Chinese demand. That China’s economic slowdown is occurring in the facing of a historic apartment Bubble significantly complicates policymaking. Beijing would surely prefer to cautiously deflate this colossal Bubble. But, at this point, aggressive measures to stimulate China’s economy would further extend the precarious “Terminal Phase” of mortgage and housing excess.
December 31 – New York Times (Alexandra Stevenson and Cao Li): “Unwanted apartments are weighing on China’s economy — and, by extension, dragging down growth around the world. Property sales are dropping. Apartments are going unsold. Developers who bet big on continued good times are now staggering under billions of dollars of debt. ‘The prospects of the property market are grim,’ said Xiang Songzuo, a senior economist at Renmin University, said… ‘The property market is the biggest gray rhino,’ he said, referring to a term the government has used to describe visibly big problems in the Chinese economy that are disregarded until they start gaining momentum… More than one in five apartments in Chinese cities — roughly 65 million — sit unoccupied, estimates Gan Li, a professor at Southwestern University of Finance and Economics in Chengdu.”
It’s difficult to fathom 65 million vacant apartment units – more than 20% of China’s housing stock. What is the scope of future bad debts and bank impairment associated with such a fiasco? Economic impact – China and globally? Financial ramifications? With a bear market in Chinese equities, China’s vulnerable Bubble Economy and waning global growth, it’s perfectly reasonable for the world to start really worrying about China’s vulnerable apartment Bubble. With all the Friday excitement surrounding Powell and rallying U.S. equities, it’s worth noting that Asian shares underperformed this week. Copper declined another 1.3%.
Along with sinking Treasury and bund yields, there’s ample evidence that something lurking out there is stirring up a palpable degree of angst. And I would like to be more sanguine about U.S. economic prospects, especially considering strong December payroll data. I’m actually not expecting the economy to just fall off a cliff. Tightened financial conditions are a relatively recent development. Barring an accident, it might take some time for faltering markets to feed into the real economy. Yet the U.S. has a Bubble Economy structure unusually vulnerable to deflating securities and asset markets. It also faces perilous structural issues throughout its securities markets and financial system more generally. I certainly believe the U.S. is highly exposed to the unfolding issue of illiquidity afflicting global financial markets.
January 4 – Bloomberg (Rizal Tupaz): “Investors pulled the most money out of investment-grade bond funds in three years last week amid the ongoing turmoil in credit markets. The funds lost $4.5 billion for the weekly reporting period ending Jan. 2, the biggest outflow since December 2015, according to Lipper. That marks the sixth straight retreat by investors. High-yield funds saw a seventh week in a row of outflows as investors yanked $628 million versus the previous period’s $3.9 billion.”
Read More
https://creditbubblebulletin.blogspot.com/2019/01/weekly-commentary-global-markets.html?spref=tw
