Charts That Matter

Warning Signal

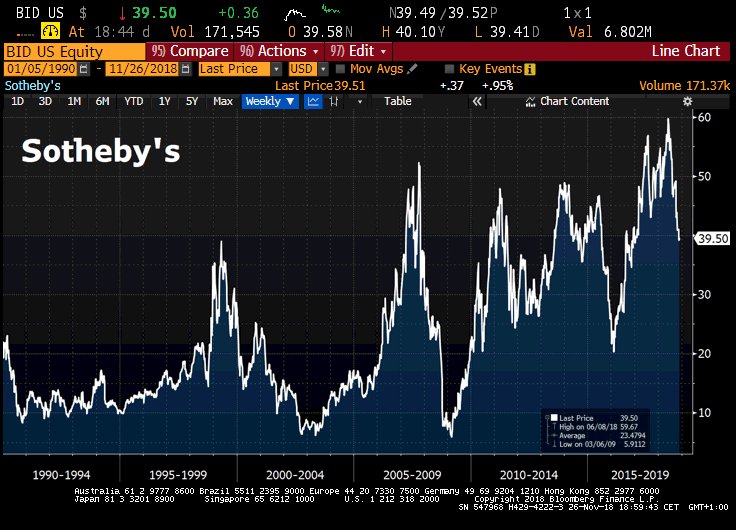
Another leading indicator spells trouble for the stock market: Shares of Sotheby’s, which had predicted every crisis in the past decades, have lost 34% from this year’s all-time high.

Finally an Undervalued asset class
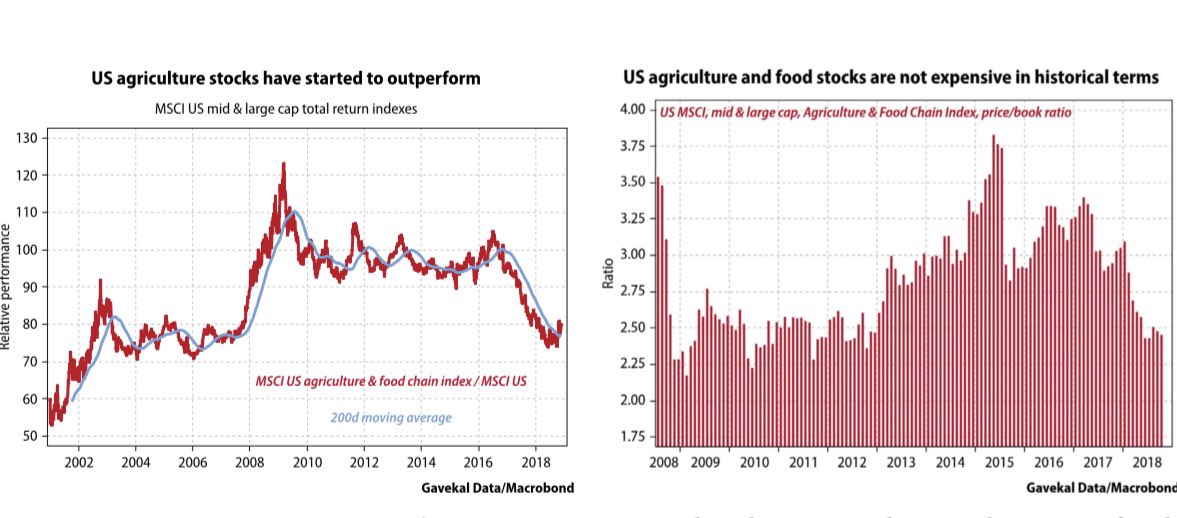
Thinking about potential outperformers in 2019. How about Agriculture stocks? They have suffered big time from the USD rally and the trade conflict. They look cheap by historic standards, tend to outperform in bear markets, and who knows..maybe there will be a fancy trade deal…
Gone

Gone down the Drains
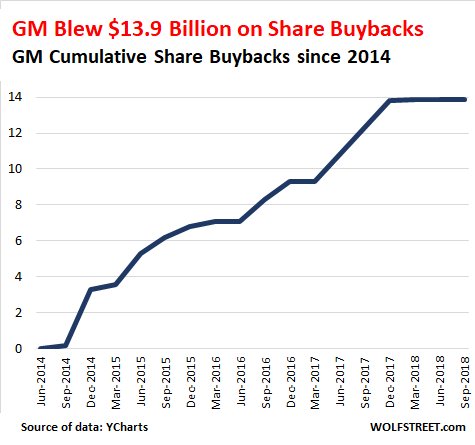
After Wasting nearly $14 billion on Share-Buybacks, GM Prepares for Carmageddon & Shift to EVs, Cuts Employees, Closes 8 Plants. A big shift, at a cost of $3.8 billion – which it now has to borrow.

No place to hide
Record share of asset classes have negative return so far this year so don’t listen to experts on correlations, afterall it is your hard earned money

No, falling crude oil is not good for Emerging Markets including India

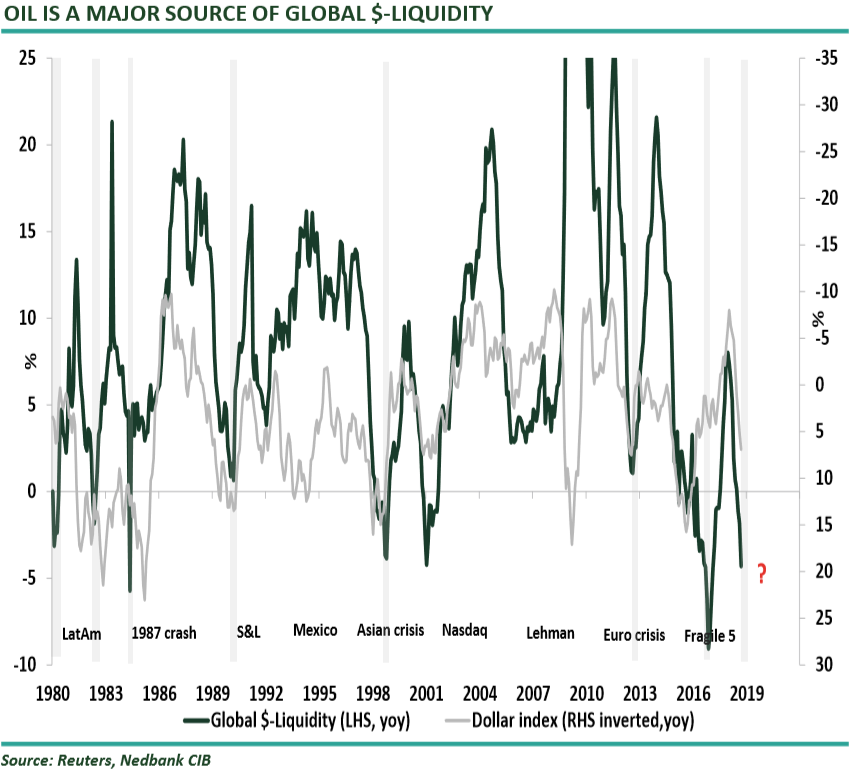
Indian media and Portfolio managers always like to spin a bullish story and the current bullishness stems from the collapse in oil price. Afterall rising oil prices for a country which imports almost all of its oil requirement is bad for discretionary consumption and its currency . Conversely, lower oil prices are good for the Indian economy as trade deficit comes down giving stability to the currency,retail oil prices come down giving breathing space to household budgets. But Nedbank breaks this Myth and their strategist Mehul Daya and Neels Heyneke  writes …”Many market commentators are indicating that it is time to look for a bottom in the relative performance between EMs and DMs. History, as a guide, suggests that EM vs DM performance is still way above the 1988 and 1998 lows ( in short the bottom is far off)

• EMs underperformed in 2011-15, followed by a risk-on period in 2016-17 after the G20 meeting in February 2016 in Shanghai. Hence the interest in the upcoming G20 meeting to see whether the US and China can come to an agreement on global trade and re-engineer another risk on phase. We believe it will be difficult amid the number of headwinds facing the global economy.

• The underperformance started in 2011, long before the Trump victory; it is not just about trade, but also about $-Liquidity. As long-time readers know, we believe investors are underestimating the role that $-Liquidity (money supply) plays in risk assets.

• An agreement between the US and China should boost failing global trade, helping dollar creation and increasing $-Liquidity. This would trigger a setback in the value of the dollar (EURUSD targeting 1.18), providing relief for EM assets in the near term. However, we still believe structural dollar shortages will continue to plague the market in 2019; hence, in the longer term, we remain bearish on EMs. We also remain concerned about China and its dollar debt burden, as Chinese corporates are heavily indebted with cross-border dollar debt. Hence, China cannot afford a stronger dollar or an escalation in the trade war with the US.

My two cents

Before you hop on to the boat of EM outperformance vs DM rotation ,look at the above chart. When dollar liquidity is ample, capital moves to higher yielding EM in search of returns and when the dollar liquidity contracts, the same capital is forced to sell EM assets as dollar rises.
so pray for a G-20 deal between US and china. it might just give you one last bounce in EM assets to get out because after that the door will be shut

India’s shadow Banking system is hanging sword

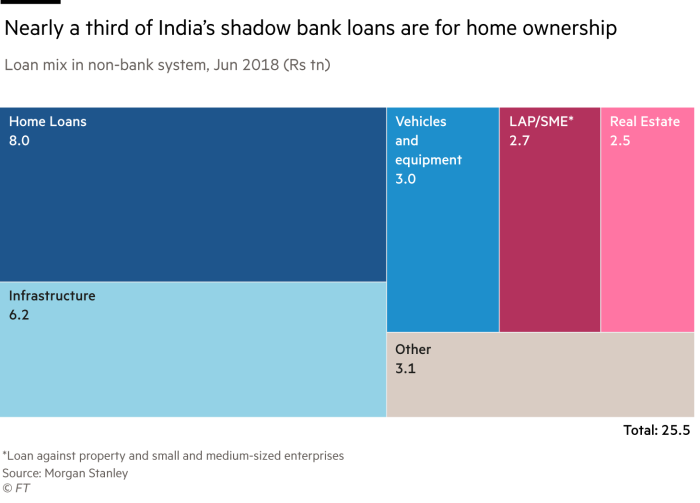
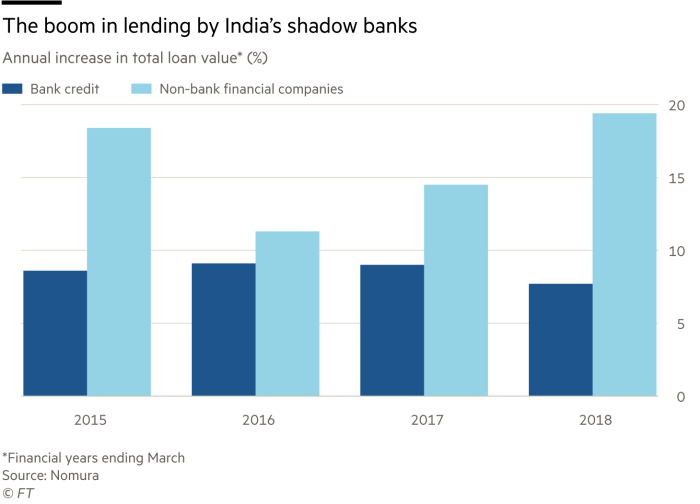
FT writes “As India’s state-controlled banks were sucked into a crisis of non-performing corporate debt over the past four years, following a glut of lending to ill-fated projects in infrastructure and industry, an opportunity appeared for non-banking financial companies, or NBFCs. Thousands of shadow banks, which face broadly less rigorous regulation than formal banks, rapidly took market share, ramping up loans to customers from scooter buyers to construction companies

The chart below shows the extent of credit creation by shadow banks at the expense of commercial banking system

By the end of March 2018, the sector’s aggregate balance sheet had reached Rs22tn ($309bn), according to the latest figures available from the RBI.

But as always happens in an upward sloping yield curve, the long term assets of Housing Finance companies were increasingly getting financed by short term commercial paper . This was funded by Mutual funds who  needed an outlet to deploy the unprecedented inflows due to demonetization. So it was the match made in heaven till ILFS collapsed and this funding was suddenly at the risk of rollover from now edgy mutual funds with some of them burnt badly with credit losses and bad press.

This is when spat between govt and RBI came out in open with govt wanting RBI to bail out the shadow banking system . The uneasy truce between central bank and govt (which is keen to have a higher credit/GDP growth in election year) has led to fragile calm in debt markets. But the final word goes to Morgan Stanley which notes Shadow banking loans to property developers, and similar assets, are worth about Rs4.6tn, ( USD 60 billion) with some estimates of inventory in following link https://www.livemint.com/Companies/j7PAiwiugpdE3MGlk0hHpL/Mumbais-new-luxury-flats-face-harsh-realty.html . It is easy and probably patriotic to bail out SME and MSME businesses whose funding from NBFC’s got cutoff in wake of ILFS fiasco.With developers facing a sales slowdown, there are fears that defaults from this sector    ( which can only be bailed out by reducing the value of currency via higher inflation) could create new set of headaches for central bank and hit the credit boom responsible for India’s GDP in last 3 years.

Predicting the next Bear Market in Six charts

The Six Bear Market indicators as per WSJ are

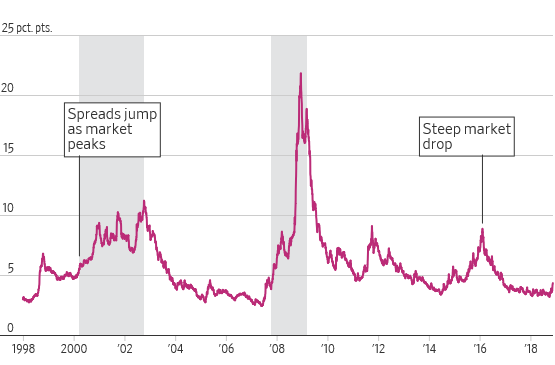
1.High-Yield Bond Spreads

A steady trend higher in high-yield bond spreads accompanied the last two stock market peaks. It signalled that investors were getting wary about riskier companies’ ability to pay back debts.Credit markets are more reliable indicator of rising recession risk

ICE BofAML US High Yield Master II Option-Adjusted Spread

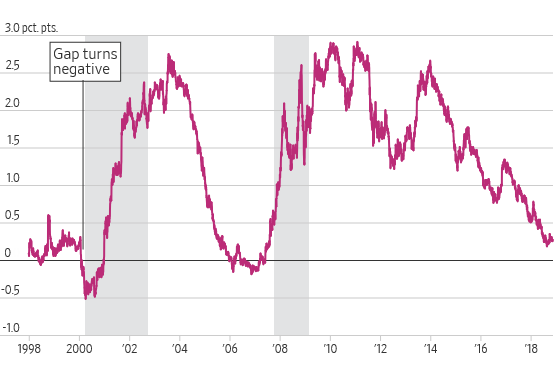
2.Yield Curve Steepness

Inversions often precede recessions and bear markets for stocks. This measure did not invert until after the 1987 bear market, but did precede the bears of 1980, 2000 and 2007. Investors are staunchly divided over whether an inverted yield curve on U.S. Treasurys can still signal a bear market, or whether rates have been distorted by years of unorthodox global monetary policy that keep yields on long-term debt low.

Gap between 10-year and 2-year Treasury yields

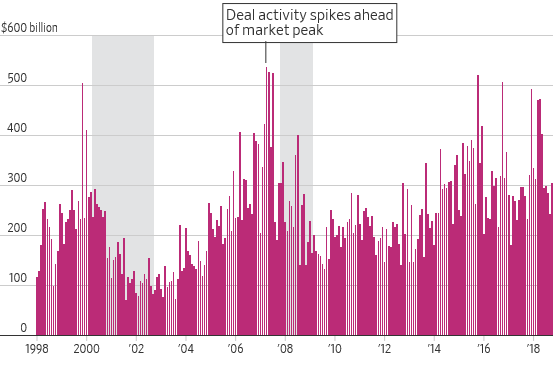
3.M&A Deal Activity and Buybacks…… I consider this to be most important indicator because it not only reduces the availability of good stocks in market but also artificially increases the accounting profit of the companies

A big pickup in deal activity has historically come toward the end of bull markets. A jump in mergers can signal that sentiment has turned excessively optimistic—or that companies see it as the only way to grow as the economy decelerates. Mergers and acquisitions spiked in 2000 and 2007 shortly ahead of the stock market peaks in a sign of excessive risk-taking. More recent peaks have been false alarms, though a spike at the end of 2015 was followed by a stock market correction that fell short of a bear market.

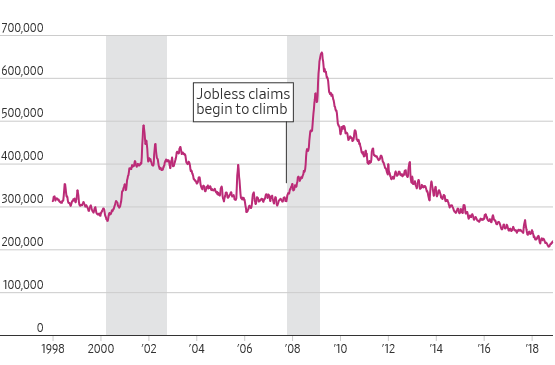
4.Weekly Jobless Claims
When unemployment rises, consumers spend less money, which crimps what companies take in. Analysts suggest looking for a consistent rise in jobless claims after a steady period. If this happens at the same time as weakness in the monthly U.S. jobs report, it is an ominous sign for the economy.

5.Investor Sentiment
Look for extreme highs and lows of investor bullishness, says Charles Rotblut at the AAII. When investors get too optimistic, they tend to run down their savings and overspend. There’s typically less cushion to protect the market, allowing selloffs to gain momentum. This measure worked very well just before the dot-com bubble burst, and spiked just before selloffs in 2011 and 2018.

6.What the Market Thinks
A relatively new measure, this chart spiked during the financial crisis and rose sharply during other recent episodes of market stress, including the 2016 China growth scare that sent markets tumbling.

The Smart person Market View

Kyle Bass tweets “There is an easy beginning to negotiations. Chinese theft of US IP is estimated to be $200-$600b annually. They currently own $1.1T of US bonds (book entry).US should begin by cancelling China’s bonds and then look for additional reparation payments”

Bill Blain writes ‘Many of our buy-side clients are telling us their investment committees are telling them to re-focus on top credit ratings and liquidity. Good luck to them as they look for bids on the 50% of the market poised on the edge of sub-investment grade.. (Chortle, Chortle… that’s the sound of stable doors slamming as the horses bolt off down the hill.)’

Kaloyan from Socgen who takes a victory lap with right 2018 market prediction writes  “we Expect another challenging year for global equities, with “downside potential to global equity indices for the next 12 months, with poor performance expected to be concentrated in 2H as investors discount the next US recession” which the French bank expects will hit in mid-2020. The punchline:
Our end-2019 index targets call for an S&P 500 at 2,400pts, the EuroStoxx 50 at 2,800pts and the Nikkei 225 at 21,400pts.

UBS writes “Two days of negative close on the key US markets is forcing a question as to – is this a capitulation. Not so, if you were to listen to our US Derivatives Strategist – Rebecca Cheong. The makeover of a capitulation would need VIX to ( currently 20) go past 30 (need VIX intraday volatility to be extreme vs SPX intraday volatility),need investors to give up buying calls and switching to downside protections. We need a large day of excess selloff. So far, all trading patterns are too orderly for a true market bottom….( thank god I thought why I am the only one not able to make money on long volatility in this fall)

Nepollian (The technical Analyst) writes ……I agree to disagree.CBOE Vix….On the verge of getting bullishly aligned for the first time in weeklies since 2009 which means US markets are finally changing character

Enodo Economics  writes ‘China Quarterly annualised growth was a meagre 0.9% (6.4% according to the official data), the lowest reading since the Enodo series started in 2004. Annual growth slowed to 3.7%, also a new low (6.5% official)’. Enodo further writes China’s middle class has now grasped that they are living in a very different world under Xi Jinping and this is the fundamental reason behind the more pronounced weakening of urban consumption this year.


The SEX recession

Kate writes for The Atlantic…….”Over the course of many conversations with sex researchers, psychologists, economists, sociologists, therapists, sex educators, and young adults, I heard many other theories about what I have come to think of as the sex recession. I was told it might be a consequence of the hookup culture, of crushing economic pressures, of surging anxiety rates, of psychological frailty, of widespread antidepressant use, of streaming television, of environmental estrogens leaked by plastics, of dropping testosterone levels, of digital porn, of the vibrator’s golden age, of dating apps, of option paralysis, of helicopter parents, of careerism, of smartphones, of the news cycle, of information overload generally, of sleep deprivation, of obesity. Name a modern blight, and someone, somewhere, is ready to blame it for messing with the modern libido.

The retreat from sex is not an exclusively American phenomenon. Most countries don’t track their citizens’ sex lives closely, but those that try (all of them wealthy) are reporting their own sex delays and declines. One of the most respected sex studies in the world, Britain’s National Survey of Sexual Attitudes and Lifestyles, reported in 2001 that people ages 16 to 44 were having sex more than six times a month on average. By 2012, the rate had dropped to fewer than five times. Over roughly the same period, Australians in relationships went from having sex about 1.8 times a week to 1.4 times. Finland’s “Finsex” study found declines in intercourse frequency, along with rising rates of masturbation.”

The Gaurdian adds “What might people be doing instead of having sex? I mean, I can think of one thing … Yes, people do a lot of that. Since the 90s, in the US, the proportion of men who masturbated in a given week has doubled to 54% and women to 26%.
I blame vibrator technology and online porn. Perhaps. There is little evidence that it is addictive, but, as one researcher put it, it might be “taking the edge off” people’s libido.

Do say: “Perhaps we need a central bank to stimulate the sexual economy.”
Don’t say: “Lowering the price of alcohol ought to do it.”

Read full article below

https://www.theatlantic.com/magazine/archive/2018/12/the-sex-recession/573949/

Charts That Matter

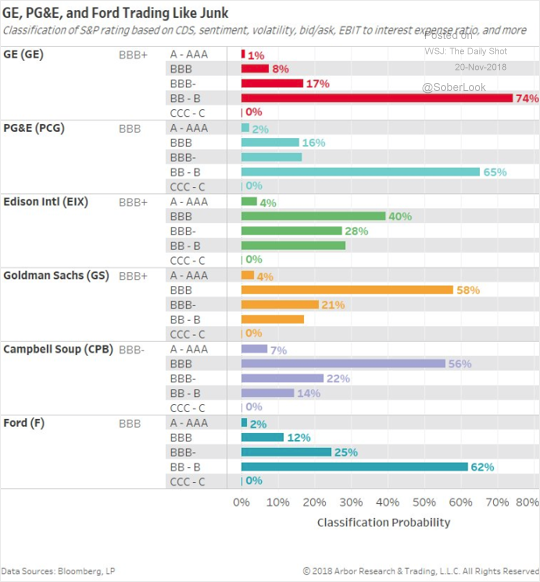
Several investment-grade names are trading like junk and there are couple of names which might surprise you.

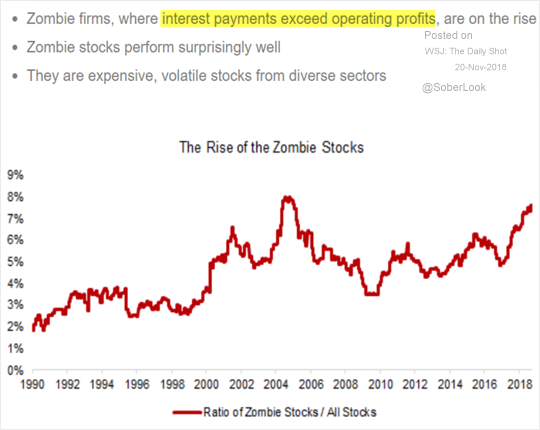
The percentage of “zombie” firms in US keeps climbing as per BIS

The table below looks at what has happened to real broad money growth in the developed world from recent peaks. This is happening along with almost flat growth in world forex reserves. Fear DEFLATION not INFLATION

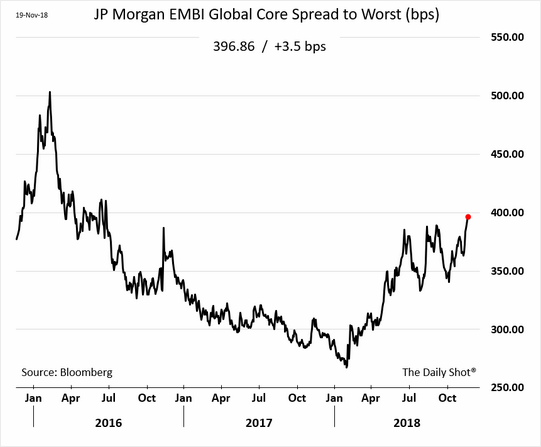
Rising US corporate high-yield spreads are pressuring EM dollar-denominated bonds (EM spread shown below).This is one more headwind for Emerging Market Dollar bonds

Too few shares, or Too little money

Russell Napier writing for The solid ground gives his final warning to get out or get slaughtered
He writes in this must read post……
Regular readers will know that this macro analyst is not particularly interested in the business cycle. This is a form of heresy for those of us who have spent our careers studying and analysing the impact of macro factors on asset prices. Sometimes, however, heresy is what is necessary, though of course it is never welcomed. It becomes a necessity when we face a profound structural change to the nature of the global monetary system. Just such a change is now upon us.
Your analyst is asked regularly, ‘Where are we in the cycle?’ and in recent days many seasoned investors have offered an opinion that we are late cycle. The sport of determining which stage of the cycle we are in is, of course, normally the key to macro investing, but today it is not relevant. Its irrelevance is because we are clearly living through the breakdown in the global monetary order – a profound structural change. I once mentioned this breakdown to the wonderful Jim Grant who replied, in his usual laconic tone, “There’s a global monetary order?”
Well, there is such an order even if, unlike Bretton Woods or the Gold Standard, it does not have a name. It is the order in which China and then, after the Asian Economic Crisis, other emerging markets were allowed to link their exchange rates in varying degrees to the USD. The result was the fastest growth in world foreign exchange reserves ever recorded and thus record purchases of US Treasury securities matched by the creation of money, commercial bank reserves, in the emerging markets.
What nirvana for equity investors when we enshrine a lower global risk-free rate and a higher global growth rate in the seeming structural setting of a monetary order! The agents of debt take full advantage of such opportunities and have thus geared the hell out of assets to increase their own cut on the asset price inflation. To paraphrase William Wordsworth, ‘Bliss in that dawn it was to be alive/But to be geared was very heaven.’ Now the sun is setting.
There is now no growth in world reserves and the US Federal Reserve is actively destroying USD bank reserves.  not many can grasp the importance of this)The decline in emerging market share prices from January this year is just the beginning of the adjustment that will now follow. The decline in commodity prices since October now confirms that adjustment, pointing the way to a deflationary, not an inflationary, adjustment.
To worry about what stage we are at in the business cycle today is akin to worrying about the stage of the cycle we were at in 1968 and ignoring the probability that the Bretton-Woods agreement was about to collapse. As the excerpt from the 1968 Wall Street Journal above shows, there was considerable faith that investing in equities for the long term would pay off, particularly as a protection against inflation. Such faith was misplaced. When Rotnem was writing the DJI was just above 900 and as late as 1982 it was just below 800. The general price level, as measured by the CPI, rose by 174% over the same period.
Even for those who worked out that there would be a collapse of the Bretton Woods Agreement and also that this would unleash very high levels of inflation equities did not offer wealth protection. When a major structural change comes along other factors such as technological breakthroughs, institutional demands for shares, and supposed inflationary protection, all cited as positives by Rotnem in 1968, are just not that important. That collapse of Bretton Woods sparked an inflationary wave that produced massive negative real returns for investors in both equities and bonds. Those investors who were focused on whether we were in the mid or late cycle in 1968 missed the major post-war structural turning point that brought massive losses to anyone not prepared to adjust for a new monetary system, replete with inflation, by buying commodities, gold and Swiss government debt.
Subscribers will be aware of the arguments behind the call for a breakdown in the global monetary system, and the consequences for asset prices both short-term and long-term. The Newsletter has made it clear that the initial adjustment following such a collapse is probably deflationary rather than inflationary. This, of course, has not been a popular opinion, as not long ago the consensus foresaw synchronised global growth and now we can all witness that the US economy has been buzzing along with a tight labour market. Isn’t the lesson from history that a breakdown in the global monetary order will unleash inflation? Indeed it is, but this need not be the first impact of such a breakdown. There is much evidence of an initial deflationary adjustment, as subscribers will know, but for now let us focus on perhaps the most surprising item of news – there is not enough money in the world!
In the summer of 1987 the well-known monetary guru of Greenwell’s, Gordon Pepper, forecast that there would be a crash in the stock market. He based this forecast on a dramatic slowdown in the growth of inflation-adjusted broad money growth in the UK ( how many track this measure) How, he pondered, could such a slowdown in real broad money be reconciled with the consensus view for solid economic growth, inflation, and a rising stock market? Across the Atlantic Ocean Milton Friedman was staring at similar data for the USA. The Friday before the stock market crash of October 1987 he spoke in New York to warn of a forthcoming recession based upon the slowdown in real broad money growth.
As it turned out we got the stock market crash, but not the recession. The stock market was the key factor that had to adjust and perhaps the economy would have followed if Alan Greenspan, the artist formerly known as ‘The Maestro’, had not slashed interest rates and birthed his now infamous ‘Greenspan put’. So, money may not always matter, but sometimes it behaves in such an extreme way that it matters very much. The collapse in real broad money growth across the world is thus something well worth paying attention to, precisely because nobody is paying attention to it.
The table below looks at what has happened to real broad money growth in the developed world from recent peaks.

The Solid Ground has long pointed out the failure of the monetary authorities to create sufficient broad money to justify belief in a combination of higher assets prices, continued growth in the real economy and rising inflation. Outside of the US this call has played out very well. The MSCI World ex USA Capital Index is now back at its 2011 level, and bank investors have been particularly heavily punished by the failure of the monetary transmission mechanism over the period.
Of course, in the USA this lack of broad money growth has not prevented a surge in asset prices, a rise in inflation, and reasonable economic growth. Why this is so is probably a large enough topic for a quarterly Solid Ground, but in essence it is because corporate cash-flow has surged during this period, particularly following the Trump tax cuts. Massive share buy-backs in the US have very much kept the equity bull market on track.
However, the table above shows that even in the US we are not living in a world of monetary stasis. As The Solid Ground pointed out in 1Q 2018 (Crowding Out: Higher US Real Rates and Lower Inflation), the added new challenge for the US is that broad money growth remains low while the supply of treasury securities, from the Treasury and the Federal Reserve, at circa US$1.4trillion is rather formidable! If it’s morning in America, who will buy this wonderful morning? In the forthcoming 4Q report The Solid Ground assesses the extent to which that funding burden will fall upon the US or non-US savers. Much depends upon how that funding burden is shared and the greater the burden taken by the non-US saver, the more the divergence of returns between US and non-US equities.( exactly, they will suck worlds saving)
Now we need worry about the fact that real broad money growth has declined dramatically since 2015 and the risks of a deflationary adjustment, through lower real GDP or lower asset prices that undermine cash flows and collateral values, can augur another debt deflation. This slowdown in money is particularly important as the BIS report shows the world’s non-financial debt to GDP ratio has reached yet another all-time high of 246%. So this analyst will not advise investors to play the mid cycle or the late cycle. He advises investors to prepare for the breakdown in the global monetary system and a deflation. Those still sceptical can watch commodity prices as a guide to whether such an outcome is increasingly likely. Those who are prepared to accept that money makes the world go round might contemplate the rapid slowdown in the pace of money supply growth and conclude that something is already stopping.
So as we approach Christmas, the time of carols, why not join the chorus from the musical Oliver!, filmed in 1968 by Carol Reed, and ask how we reconcile ever expanding goods prices, ever expanding asset prices and ever expanding economic activity with the fact that there is too little money.

‘There’ll never be a day so sunny
It could not happen twice.
Where is the man with all the money?
It’s cheap at half the price!

Who will buy this wonderful feeling?
I’m so high I swear I could fly
Me, oh my! I don’t want to lose it
So what am I to do
To keep a sky so blue?
There must be someone who will buy…’

Lionel Bart, Oliver!, 1960
Option selling….. seriously what can go wrong?

One more Six sigma event after one this February when inverse VIX ETF blew up.

“Stocks are great, until they aren’t,” proclaims the now ‘dark’ website of Tampa-based OptionsSellers.com, explaining to ‘high net worth investors’ that “options are better but most make the mistake of buying them.”

Here’s a selection of blog posts you would have been presented with as a client of optionsellers.com
Sleep at Night Risk Management for Option Sellers
5 Rules for Surviving the Next 4 Years
Avoiding the Big Hit When Selling Options
The 2 Key Criteria You Must Use to Measure Diversification
Beyond these kinds of blog posts, you will see all sorts of allusions to Talebian concepts as well, like this one which suggests that selling deep out-of-the-money options is how to prepare for black swan events. If you are ever feeling guilty about your behavior, force yourself to read this again and again as punishment until you feel like the universe is in balance again.

Process and method words abound on the website’s materials, because they must. Lip service to the value of diversification and conservatism are everywhere, too, as are attempts to sell against the unpredictable volatility of equity markets. Because you can’t sell anything without this language in 2018, especially a risky strategy that is willing to bet the farm on huge exposure to notoriously idiosyncratic markets like natural gas. All of those blogs, all of that garbage about deep out-of-the-money options and black swans – is a cartoon of process. It’s a Nice Sweater.

On November 15, 2018, OptionSellers.com notified its investors in an email entitled “Catastrophic Loss Event” that it not only lost all their money, but that they would also owe money to Intl FC Stone for margin calls.
I am writing to give you an update on the situation here with your account.
We have spent the week unwinding our short natural gas call position as expediently as possible.
Today which was to be the final day of liquidation, the market flared as prices appear to have been caught in a “short squeeze.”
The speed at which it took place is truly beyond anything I have seen in my career. It overran our risk control systems and left us at the mercy of the market.
In short, it was a rogue wave and it overwhelmed us. Unfortunately, this has resulted in a catastrophic loss.
Our clearing firm, FC Stone now requires us to liquidate all positions. We hoped to have this done today. If not, it will be completed tomorrow.
Your account could potentially be facing a debit balance as of tomorrow. OptionSellers.com will be processing fee credits over the course of the coming days to help alleviate debit balances. What these will be will be determined after all positions are cleared.
This has in effect, crippled the firm. At this point, our brokers at FC Stone have been assisting us in liquidation.
Our offices will remain open and we will all still be here to answer your questions and process account closings. We will do everything in our power to ease what discomfort we can.
I am truly sorry this has happened.
I will be updating you again via memo in 24 hours.”
Regards,
OptionSellers.com

Charts That Matter

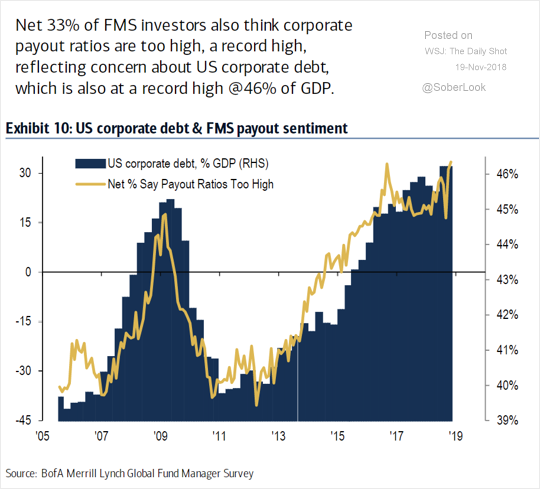
Thank god… finally Investors are getting increasingly concerned that outsize share buy-backs and dividends (high payout ratios) are boosting corporate debt levels.


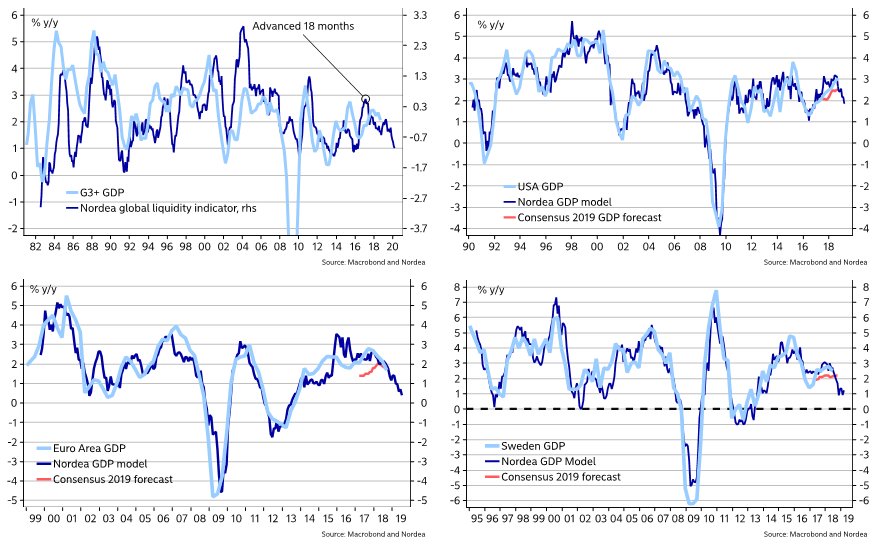
Is FED Chairman Powell pondering pausing rate hikes? Nordea says look at following charts

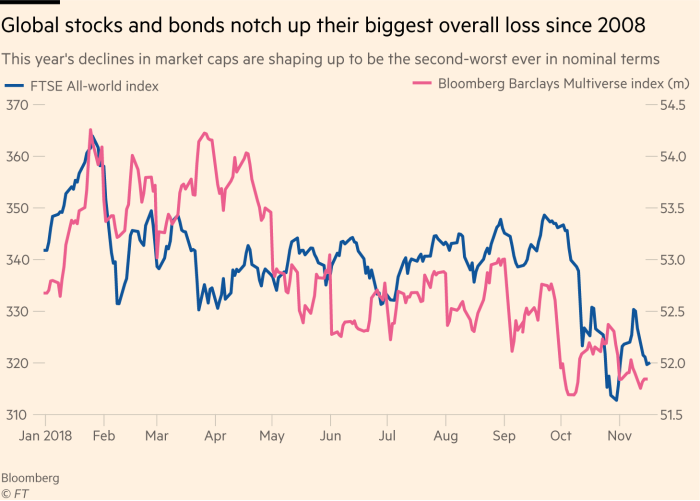
Global Bonds and equity markets shrink $5trillion in 2018. Rare parallel declines in capital markets could result in biggest contraction post financial crisis

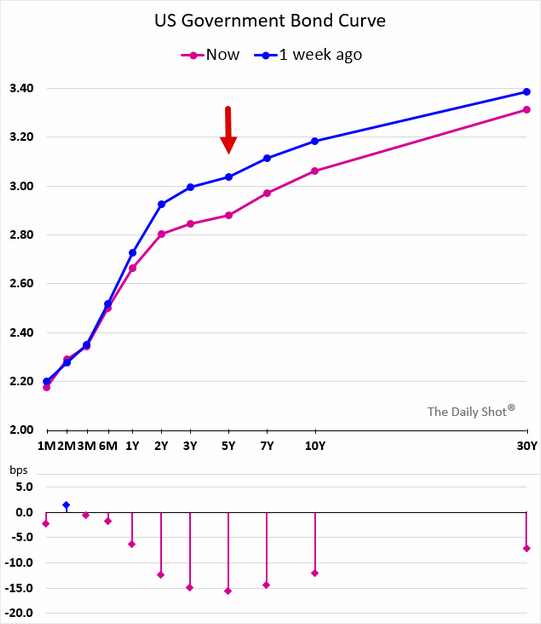
Rising macro risks have resulted in increased demand for the “belly” of the curve (leading to a steepening vs. the 30-year yield) which is strange. I still think that yield curve will invert