Crescat nails it

Crescat’s flagship global macro fund was up 17.1% net in October and rose to 28.2% net year to date.

Today, their three highest conviction macro ideas and portfolio exposures continue to be:
US Equities: The market is damaged and finally breaking down from truly record valuations while US profit growth has peaked. Crescat’s hedge funds remain tactically net short.
China: China’s economy is in the early stages of a collapse which will be globally contagious. The trade war with the United States is just one catalyst, not the primary cause of China’s economic downfall. We expect China’s currency to soon enter a full-blown crisis and have shifted our global macro hedge fund short exposure slightly less towards Chinese stocks and slightly more towards the currency.
Precious Metals: Left for dead. Precious metals are an extremely undervalued alternative to cash today as a haven trade that can also help us capitalize on financial turmoil and beat inevitable future inflation.
US Equities and High Yield Corporate Credit
It was just two months ago that the US stock market hit all-time high valuation multiples across eight different measures that we have been featuring in our quarterly letters. Our macro model is signaling that a cyclical bear market in US stocks remains in the early stages of developing with much further to play out over the next one to two years. We remain fundamental bears on US equity and high-yield credit markets. Corporate leverage is at record levels while credit spreads are near all-time lows. It is late in the economic cycle with the Fed continuing to remove liquidity from markets by raising interest rates and unwinding its balance sheet. With many global stock markets already in bear territory, US markets are finally showing signs of cracking. Now is a great time to be short overvalued US stocks such as those identified by Crescat’s fundamental equity model. That is how Crescat’s hedge funds remain positioned currently. Our global macro fund also continues to be short high yield bonds through put options on select ETFs.
China
A global macroeconomic downturn is already in motion with the unwinding of record debt-to-GDP bubbles globally. China, the largest credit bubble ever based on our analysis, is already in a full-scale credit bust with the median Chinese-listed equity recently down almost 40% from its 12-month high. We believe China is already in a serious recession despite popular fiction regarding its positive reported GDP numbers that omit losses on bad debt. Chinese stocks have already lost over $5 trillion of market value since January of this year, about 26% of GDP. Yet, no commensurate value of bad debt has been marked down yet. By comparison, in 2008 when US stocks had lost a similar proportion of GDP in market value, the US economy was already in deep recession. China is almost certainly in recession now.
As we have been writing about for several years now, China’s GDP has been vastly overstated due to the lack of write-downs of its non-performing loans. By our estimates, bad loans today still on the books of Chinese banks could be as much as $8 trillion, 60% of its GDP and about four times the book value of equity in its banking system. These are insanely large numbers that portend systemic bank runs and social unrest. The Chinese economy has been a failed experiment in Ponzi finance. China can no longer fool the world regarding its GDP growth. The result is an historic credit bubble that is finally bursting under its own weight. The Trump trade war has been just one of the many catalysts for the burst, but it is not the root cause of it. The cause was excessive bank credit expansion along with the continued rolling over of bad debt. That playbook is now coming to an end with a dramatic slowdown in China’s M1 and M2 growth proving that its credit expansion is unsustainable. China is now experiencing its time of economic reckoning, its Minsky Moment. The Chinese banking imbalances are so large that it is too late to undo the bursting of the credit bubble regardless of the direction impending trade negotiations with the U.S. take. China is careening towards the inevitable: its central bank will soon have no choice but to print record new levels of yuan (M0) to bail out its banks and attempt to quell social unrest. Like other economic collapses of centrally-planned, totalitarian communist countries, we continue to expect that the Chinese currency will plunge as money printing and capital flight accelerates.
In our global macro fund, we remain short the Chinese yuan through put options laddered out in different durations. The yuan short has contributed to the fund’s strong performance year to date, but we haven’t seen anything yet in terms of our expected return from a coming yuan plunge. We also have significant short exposure to “the other Chinese currency”, the Hong Kong dollar, structured similarly through laddered put options to play a likely de-pegging of that currency. HKD presents an extreme asymmetric risk/reward investment opportunity to profit from yet another huge credit imbalance in the world today. Hong Kong has the largest credit-to-GDP gap and debt service ratio of all countries tracked by the Bank for International Settlements. The BIS considers each of these important early-warning indicators for banking and currency crises. Hong Kong is part of China, and therefore part of China’s credit bubble. It is China’s financial hub with the rest of the world and has its own housing and banking bubbles. Its financial markets are already being swept up in China’s economic crisis. We expect the Hong Kong dollar to de-peg and devalue as China’s credit bust continues to play out and Hong Kong is further absorbed politically and economically by China.
Precious Metals and Global Fiat Debasement
With a decade of money printing and interest rate suppression in the wake of the global financial crisis, central banks have created truly record global debt and financial asset bubbles. At the same time, they have created a corresponding record low valuation of global above-ground gold holdings relative to fiat money. The depressed gold price relative to the of high cost of finding and extracting it has wreaked havoc on the mining stock fundamentals. It’s been a seven-year free cash flow and stock price drought. Declining industry-wide capital investment over this period has created a steady decline in new gold discoveries leading to “peak gold” production fears that have large miners scrambling to acquire new in-the-ground reserves. Gold and silver miners represent historic deep value today according to Crescat’s fundamental equity model at a time when the broad competing stock market is at record fundamental valuations. Already activist hedge funds are taking note and industry consolidation is underway which has been benefiting several of Crescat’s gold and silver mining holdings. We strongly believe it is poised to be one of strongest performers in the coming months and quarters.
Why? Because we expect gold and silver to soar at the first hint of the end of Fed rate hikes which we believe is just around the corner and much sooner than priced into the Fed Funds futures curve today. The Fed has already been raising interest rates for three years now trying to lead the world out of global central bank life support, but it is hamstrung. Its tight monetary policy has already served as a key catalyst to burst global debt and financial asset bubbles in China and other emerging markets. Meanwhile, the Fed’s tightening has likely not been enough to fight rising real-world inflationary pressures at home. As record over-valued financial asset bubbles burst, it is likely that the Fed will stop raising rates soon. Next, it would likely end its balance sheet reduction, reduce rates, and re-engage in QE. The end to rate hikes will come first and the signal to watch for that will be a drop in the Fed Funds futures curve. It’s already been slipping in recent weeks.
Yield Curve Inversion… Conclusion
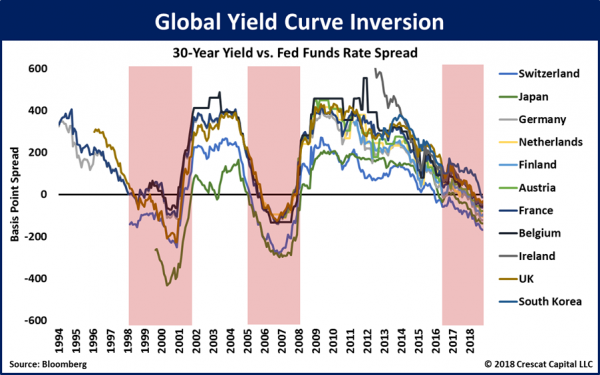
We take issue with the economists and market prognosticators who say we shouldn’t be concerned about a coming recession anytime soon because the Fed hasn’t inverted the Treasury yield curve yet. For those who obsess over the need for an inverted yield curve to signal a coming financial collapse and recession, be advised that the Fed has already inverted the global yield curve today, just as it did ahead of the last two U.S. stock market crashes and recessions. 
The coming monetary CRISIS

Martin Armstrong writes…”The entire problem with this Quantitative Easing has been the plain fact that the government is the biggest debtor. This is the same model around the world. Lowering interest rates to encourage people to borrow is absurd when the greatest impact will be upon the government. Europe is now on life support thanks to the ECB. Even if we look at the United States, every 1% rise in interest rates adds $220 billion annually to America’s deficit. Since we have exceeded the Bullish Reversal on Fed Rates on an annual basis ( martin’s proprietary model) , reaching the 5% level means the annual interest expenditures will be rise by about $1 trillion per year! This is just not a system that has much life expectancy before we enter a major Monetary Crisis that is off the charts”.

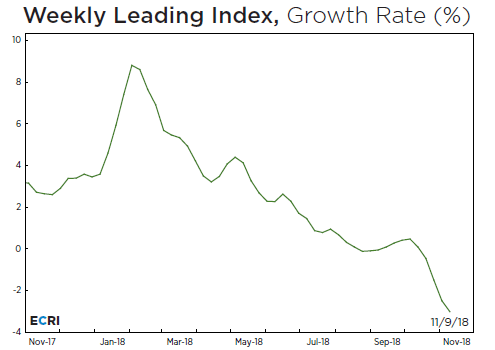
ECRI has also come out with its weekly leading index and it shows, growth is sharply cooling off which will ultimately lead to lower corporate profitability along with lower tax collection exactly at the time US will be running a trillion dollar budget deficit

.

I wanted to conclude this article with the stupidity of politicians from Illinois, the city which is so broke economically that, they want to now impose an EXIT tax for anyone who dares to think about leaving the state . Such a tax may make others decide NOT to move to the state and then watch property values also crash.

The technical analyst is back and he is suggesting you temper your enthusiasm

Neppolian is back and he is suggesting that you temper your enthusiasm. On of my widely read post  http://worldoutofwhack.com/2018/10/24/conversation-with-a-technical-analyst/  was a conversation with him on technical positioning of markets where he insisted, market has put a short term bottom and is headed for a rally.

Well that played out really well and now he writes

Apropos our 5th October 2018 market update where in we had proposed markets bottoming out in the subsequent 2-3% range of 10400 and rallying to a Nifty level of 11000-11200 and Bank Nifty level of 26000-26500, here is our further thoughts.

The markets did bottom within 2-3% range of 10400 by basing a low at 10000 Nifty. Bankex  has reached the mid point of the 26000-26500 range suggested with today’s high printed at 26300. The rally measures 9% off the bottom from 24250.

Nifty: has underperformed Bankex by rallying just 7% to 10700 from a bottom of 10000. This is concerning as broad sectoral participation still remains elusive.

Breadth: one of our principle arugement for a rally was basis the sentiment indicators (breadth indicators) trading at historical oversold levels on 5th October. Currently the oversold condition no longer exist now and in fact the
present readings are close to historical pullback metrics.

Market Breadth now:
% >20DMA = 68% (4%)
% >50DMA = 44% (8%)
% > 200DMA = 40% (28%)
50DMA>200DMA=42% (56%)

The numbers in brackets above represent the figures on 5th October.

We are concerned by the deterioration in the 50>200DMA gauge moving down from 56% to 42% (this is interesting) This is suggestive of crumbling medium term market strength even as Nifty is playing out the expected rally. Such deterioration is symptomatic of corrective rallies which would eventually resolve to further downsides.

Nymex crude: the second principle argument for a rally was based on crude trading at an important rally high/resistance at 78 on 5th Oct and the expected correction in crude helping Indian equity rally. This has played out as expected with crude falling from a high of 78 to 55 now. The sentiment for crude has turned 360 degrees
from peak bullish to max bearish now. We feel the sentiment reversal is symbolic of near term bottom in crude and we are open to the possibility of crude starting a pullback rally from 55 to 65-68 levels. This should be equity decretive.

INR: The third argument for a bull case then was INR staying under 74 and a possibility of appreciating. Since then INR has been involved in a shallow appreciation from 74.5 to sub 72 now. We do not expect INR to appreciate past 71 in near term putting a cap to further equity rally.

Basis the above changed circumstances and the medium term breadth deterioration we shall be open to mark down the Nifty pullback targets from the earlier 11000-11200 to the more likely 10700-10900. We can retain Bankex ending its pullback in the range of 26300-26500.

Conclusion

This calls for taking profits in the earlier tactical buys if any done at the recent bottom and also recalibrate portfolios in the names in which you may be wanting to trim/exit.

Sorry Guys CAPITALISM is not working but I am worth $ 18 billion

Ray Dalio has a net worth estimated at $18 billion, according to Forbes, largely gained from building and running Bridgewater Associates, the largest and—by some metrics—most successful hedge fund in the world

Main points from article/interview in BARRON’s

Capitalism is basically not working for the majority of people (sorry guys if you have not made your moolah by now the time is up… cycle is over)

“Economics and markets are my day job,” said Dalio ( he tells people how to manage their business)

Jonathan Tepper and Denise Hearn’s forthcoming book, The Myth of Capitalism, argues that the current U.S. system is so dominated by monopolies that it isn’t true capitalism ( ask us Indians,we have closed 5 telecom companies with million jobs lost). There’s also Anand Giridharadas’ Winners Take All, published in August, which posits that the efforts by the global elite to save the world through philanthropy serves to preserve the status quo that benefits them—and to mask their own participation in creating the crises they’re purported to fix

Dalio has spoken about the pressing problem of inequality for years—and has warned that artificial intelligence will help to worsen it. (I can only tell the Indian policy makers to WAKEUP AND SMELL THE COFFEE… there is no more demographic dividend guys)

DALIO cited a Federal Reserve survey statistic that 40% of U.S. households could not raise $400 in case of emergency without selling something. “We might not have contact with those people, but that is a reality,” Dalio told the crowd, who paid thousands of dollars to sit on the Palace Theater’s velvet seats and hear him speak.

The current polarization—both politically and socially—is most analogous to the 1930s, he argued. “It has to be dealt with,” Dalio said, saying if he were running things, he’d declare the wealth gap and opportunity gap a “national emergency.”( can we do that in India, if not ,get ready for social chaos)

Tide turning in favor of Long dated US treasuries

Lewis Johnson writes “Inflation scares this deep into one of the longest cycles in post-war history should be viewed with skepticism, in our view, because of the shaky foundation upon which they are built. Just a few days ago, many feared how the economy would cope with the inflationary pressures from crude oil prices which seemed inexorable in their climb toward a hundred dollars a barrel. Now, it appears investors are again fearfully updating their models, only this time to the downside. Transitory inflationary fears are being replaced with the sober realization: weaker crude oil prices could weigh upon many parts of the economy. Think about it.
The U.S. is now the world’s largest producer of crude oil. Trillions of dollars, much of it borrowed in the junk bond market, went into financing this production increase. In fact, nearly 20% of the junk bonds sold in the past decade have gone to financing this production boom and its associated infrastructure. How much of U.S. industrial production is dependent upon a strong crude oil market? If crude oil prices remain depressed, will weaker debtors be able to honor their commitments? What about the health of the banks who lent them money? What about employment? The questions are starting to mount.

It’s Better to Be Long the Solution Than Short the Problem
In a way, we believe that we can achieve a similar outcome in the financial markets when seeking to hedge out the risks of owning an equity portfolio into the peak of the cycle. Like so many of the world’s elegant solutions, it hides in plain sight, protected only by the controversy that surrounds it. We think that longer dated U.S. government bonds can act as such a hedge, which is why they play an important role for us when we seek to create a more defensive portfolio. ( disclosure… I am heavily long US treasury through leveraged ETF)
You need look no further than the buoyant performance of such bonds during the 2008 and 2011 equity bear markets, when they returned nearly 40% while equities fell.

In Conclusion
The hardest task in portfolio management, in my opinion, is managing a portfolio into the peak of a cycle. Look no further than the squeeze up and crash in the crude oil market. Cycles are volatile.
Our solution, learned through hundreds of cycles, is to manage risk proactively. It’s times such as this that the discipline of valuation and proactive risk management can add the most value to portfolios. We believe that the “cost” of such strategies – selling early and favoring quality to avoid the worst ravages of downcycles – is worth the “risk” of potential near-term underperformance. ( I agree)

A guide for the Perplexed- Convexity Maven

Harley Bassman writes “Convexity is always lurking at the scene of the crime
Wall Street loves to make convexity sound complex (I suppose it’s so they can charge higher fees ?). We speak Greek (calling it “gamma”), employ physics as a metaphor (analogizing to it “acceleration”), and use mathematical definitions (since it is the second derivative of the asset’s price change).
Pish, posh. An investment is convex if the payoff is unbalanced for equally opposite outcomes. So if there’s the potential to earn a profit of two on a bet versus a maximum loss of one, the bet is positively convex. If you can lose three versus making two, it is negatively convex. That’s it. The rocket scientists are called upon to help (fairly) price the cost (value) of such possible outcomes. This is why the expansion of derivative trading in the 1990’s resulted in a hiring spree of physics PhD’s.
Investors have a conflicted relationship with convexity. It has been observed that the unpleasantness of losing one dollar is greater than the joy of making a similar sum; a social economist would say that people are not risk neutral. Yet incongruously, investment managers display a bias to be short optionality (convexity); a payoff profile where the losses can be greater than the gains.

The reason is simple: Convexity (option) sellers are paid up front, either via a coupon or cash (the option premium). In a nutshell, greed outweighs fear.
For simplicity, let’s assume that US Treasuries (UST) have no convexity, so their yield is just the pure risk-free interest rate received to maturity. As such, we can model a non-callable corporate bond as a UST plus some extra yield for the risk the company cannot ultimately return your money. This will sort of look like being long a UST and short a put on the company’s stock, but more accurately short a credit default option on the company.
A greater risk of default translates into a more expensive option and thus, a higher yield on such bonds. Presently, a bond issued by Apple yields about 42bps more than a similar maturity UST, while a bond backed by Tesla offers an extra yield of 406bps. Investment professionals will ponder which has a better ‘risk-adjusted return’; but there no is doubt that buyers of Tesla bonds will receive an extra 364bps as long as Elon’s company can make the coupon payments.
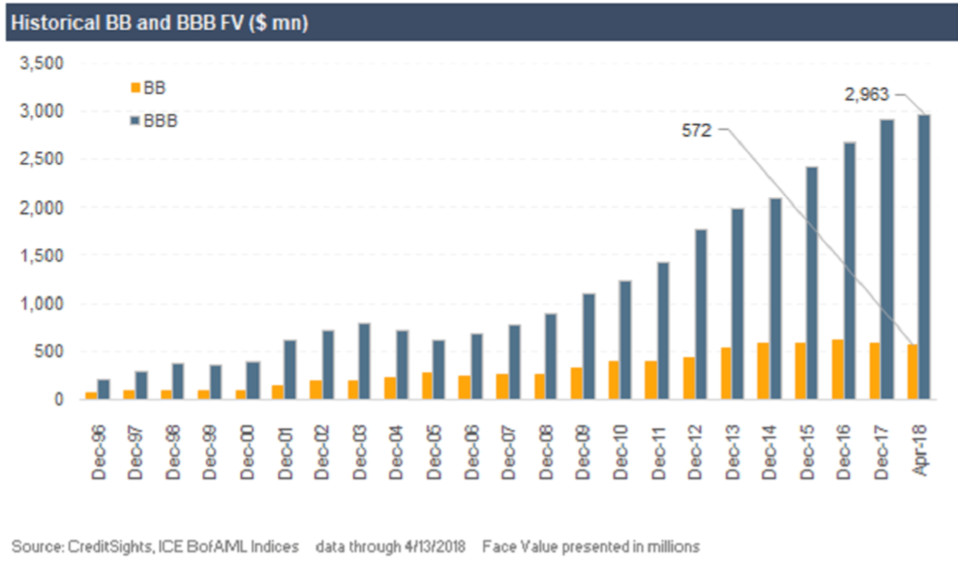
Among the many under-appreciated consequences of the Fed’s Zero Interest Rate Policy (ZIRP) was how liability managers (pension / insurance) might overweight convexity risk in their effort to reach their return targets. This demand explains the massive growth in the -labrador bar- BBB-rated market relative to the -gingerline bar- BB-rated market

An option is most convex when it is at-the-money; a location where it also has the greatest time value (yield). BBB-rated bonds reside at the credit inflection point – a notch lower and they become “junk” that may need to be quickly liquidated by investment-grade portfolios.

Harley concludes …….
I am loath to use the word “always”, but over the course of my professional career, there always seems to be a concentration of short convexity at the core of extreme market turbulence. Convexity is the measure of unbalanced risk so, almost by definition, a negatively convex portfolio will be unstable. Markets become disturbed when the instability of convexity becomes greater than the market’s liquidity.
Convexity is not the match, but rather the accelerant.

Look around you,too many investors are loosing too much money

Markets are getting nervous and investors are getting itchy. Too many assets have lost too much money in a very short period of time.

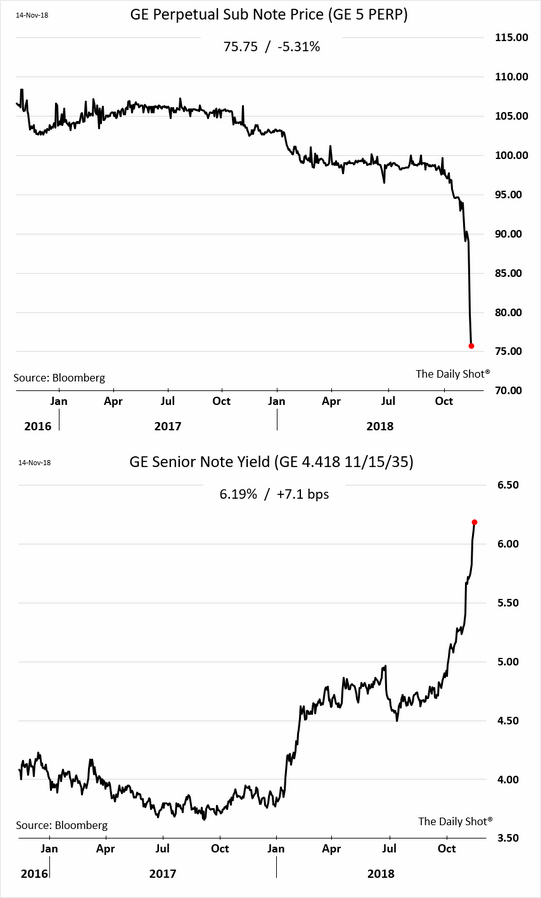
General Electric bonds are still investment grade with BBB+ ratings and are part of lot of fixed income portfolios. Below is the price of perpetual bond and bond yield

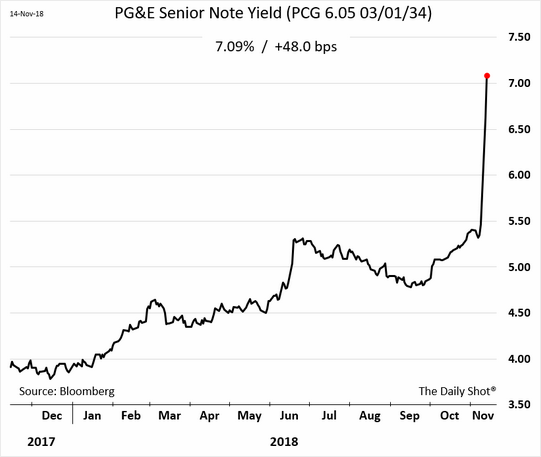
PG&E is Californian utility company and not the only one to see these kind of losses……. don’t know why ? massive fire in California and all utility companies have drawn down their bank limits.

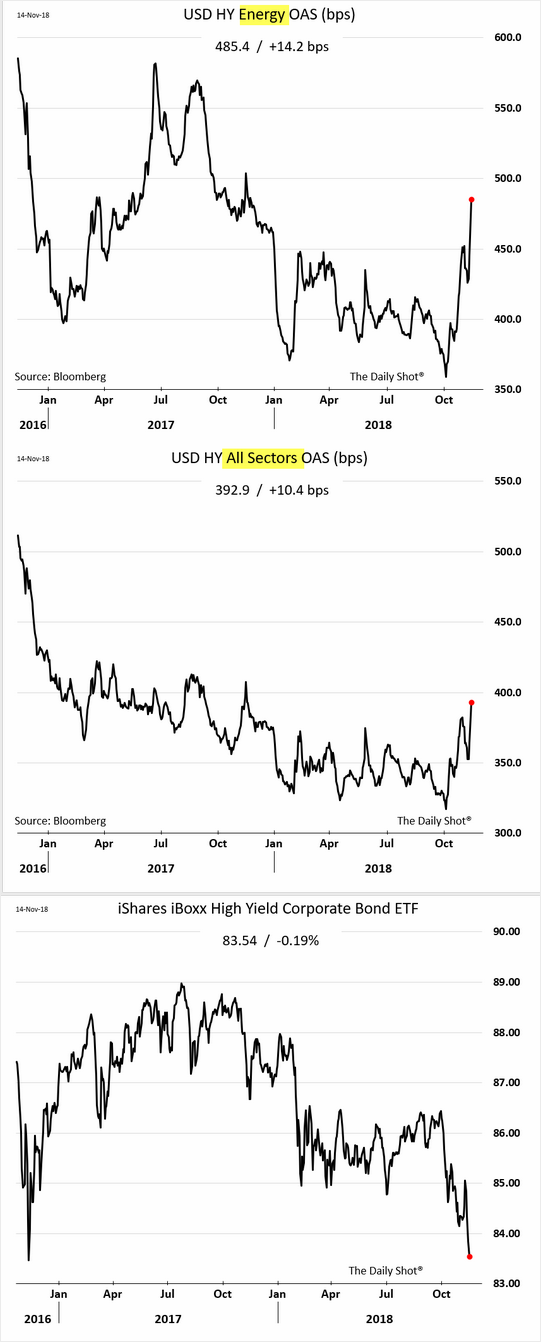
Everybody knows about the losses in crude oil complex. below is the chart of high yield energy/corporate bond index ( see the spread widening over treasuries) and price of the ETF tracking these assets.

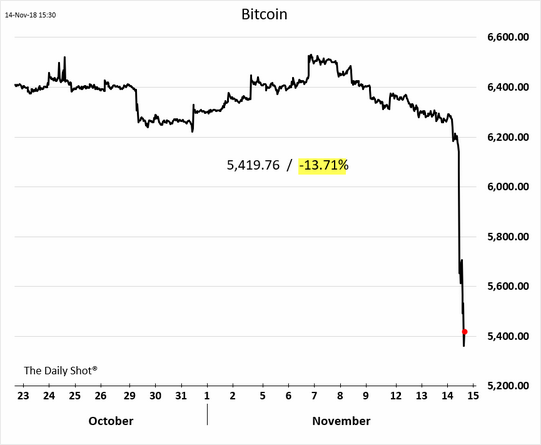
Bitcoin, blockchain anyone… well the entire cryptocurrency crashed yesterday and yes…. there are investors who are still invested in this asset

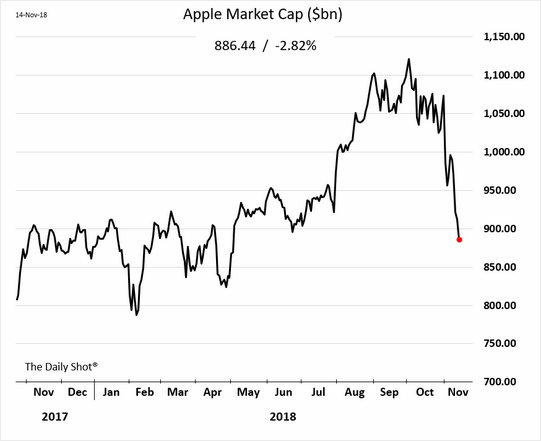
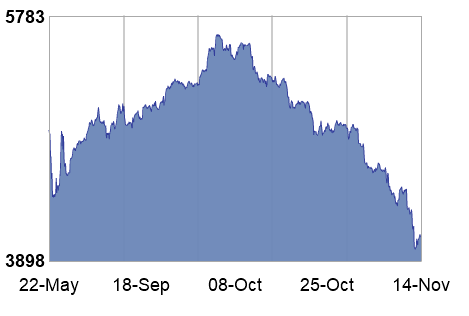
Finally everybody’s favourite stock apart from Amazon and since the prices were going up, investors pushed the prices up more and made it a trillion dollar marketcap….. but I guess consumers are finally tapped out. The fall is more severe in supply chain of APPLE.

When so many assets loose so much money then investors become more risk averse and start cutting on positions leading to vanishing of liquidity and widening of bid/offer spreads.

why the Indian consumer never wins?

Satyakam Gautam writes…”Since 1st oct when brent touched USD 86 levels, it has fallen to current $65 levels. Assuming landed cost as $65 USD/INR at 72.5, per gallon cost is 4712 INR per gallon”.

The Nov contract for MCX crude oil ( which captures crude oil in Indian Rupee) fell from a high of 5600 in oct to almost 4000 today …..a loss of almost 40% . 


Per litre cost is 712/159= INR 29.63 . Add Oil marketing companies margin and freight cost of Rs 3.82 per litre. Becomes 33.45. Add central excise of Rs19.48 per litre, it becomes 52.93. Add 3.66 commission to dealers, it becomes
56.59. Add 27% state VAT

Per litre cost comes at 71.87.

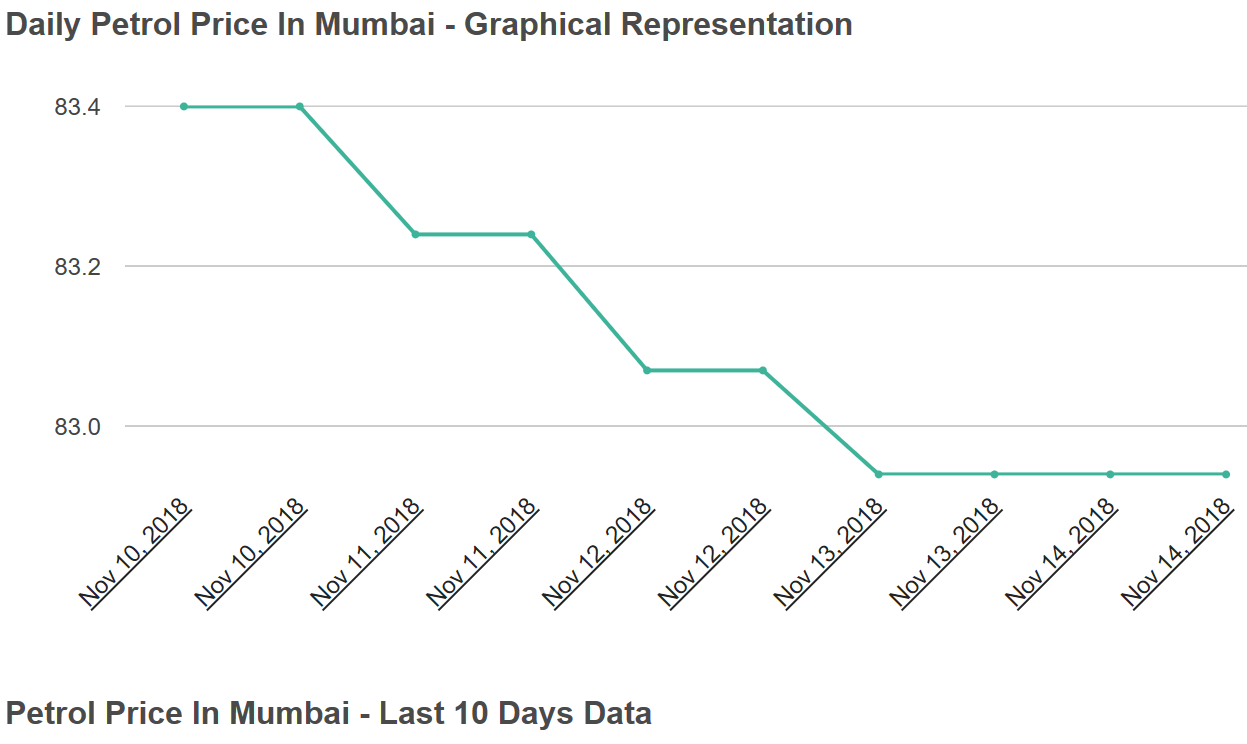
But today’s petrol price in Mumbai is 83 down only 5% from the high seen few days back

Well central govt is happy, state govts are happy, omc’s are happy ,but the customer is clueless how can this be happening. Then some Eloquent north block bureaucrat might tweet GOVT cant reduce prices because it affects fiscal deficit. Really. If the choice is between filling govt coffers to do wasteful revenue expenditure or letting retail prices truly mimic global prices which helps in lower input costs, lower CPI, leading to lower cost of capital leading to better utilisation of scant economic resources, the choice is pretty clear.

Conclusion

It  does not matter whether brent is at 35 or at 85, the uninformed Indian petro consumer has no choice but to shell out same so that govt can keep on doing wasteful expenditure. So much respect for consumer and that too from govt itself.

what is the correlation between CRUDE and DOLLAR?

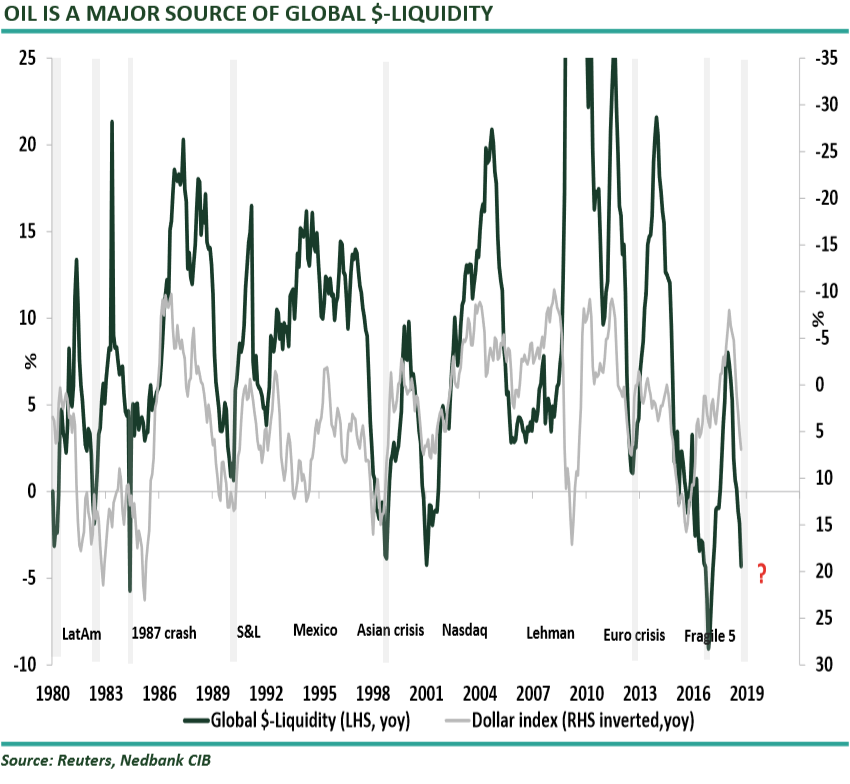
Mehul Daya and Neel Heyneke of Ned Bank Writes” The link between the oil price, the US dollar and Global $-Liquidity was born after the collapse of the Bretton-Woods system (the gold standard) in the 1970s. The official agreement between the US and Saudi Arabia to standardise the trading of oil in US dollars for geo-political and economic reasons resulted in oil becoming part of the monetary system. Shortly after this, many other oil-producing nations also began to invoice oil in US dollars. Today, this is what we know as the petrodollar system. This was the single most important factor for propelling the US dollar as the world’s reserve currency. The oil price became a major source of Global $-Liquidity. As the oil price rises, petrodollar balances around the world rise. Oil-producing nations then recycle their excess US dollars back into the US economy (purchasing US assets) or into the offshore dollar banking system (Eurodollar). From this perspective, the financial system would be flooded with US dollars, leading to a weaker US dollar and easier financial conditions (the opposite is true as well).

Hence, NEDBANK is concerned that the falling oil price would put further pressure on Global $Liquidity and exacerbate US dollar shortages, triggering another US dollar bull phase.

JOBS crisis in India- R jagannathan

R Jagannathan’s book, The Jobs Crisis in India, is a must-read for any serious student of economics. It offers a 360 degree view of India’s job crisis. The language used is simple and devoid of jargon, which makes an otherwise dry subject an interesting read even for a beginner.

The book is an account of a real problem in India that some fail to understand, and some pretend not to.

Book Summary below

jobscrisisinindia-181107171525 (1)