Charts that Matter- Volume 4

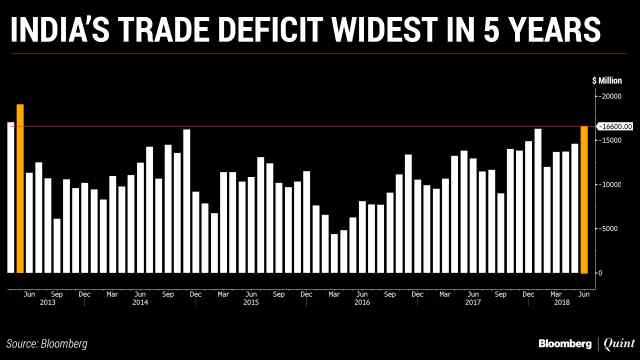
1. India Trade deficit and imports at 5 year high.Oil is obviously the major culprit but useless electronic imports are also responsible for this surge.Trade deficit for Q1 FY 19 close to $ 45B indicating a CAD of 2.5% of GDP.So unless Oilprices come down we will see a general weakening of rupee


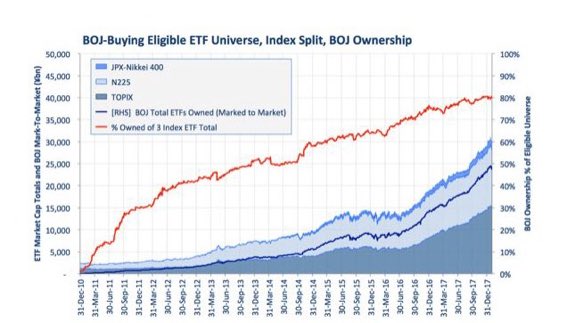
2. This charts shows the Bank of Japan now owns 80% of the eligible equityindex ETFs!All big monetary experiments start with Japan and this one is for history books. BOJ already owns so much of domestic bonds that there are days when not a single trade takes place in JGB’s.

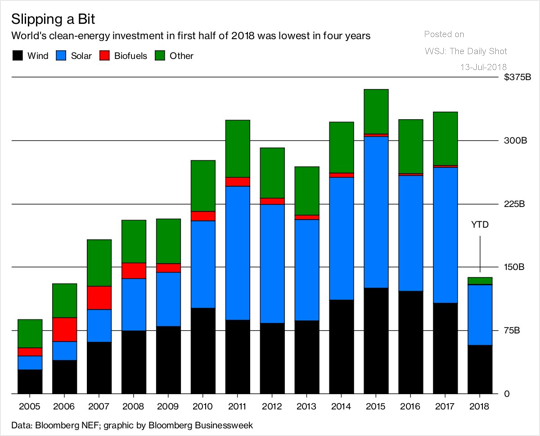
3. Global Clean energy investment are lowest in last four years.With surge in oil prices, the investment in clean energy should have gone up this year.I believe most of these investments were never profitable in first place and relied upon govt subsidies to make a business case.

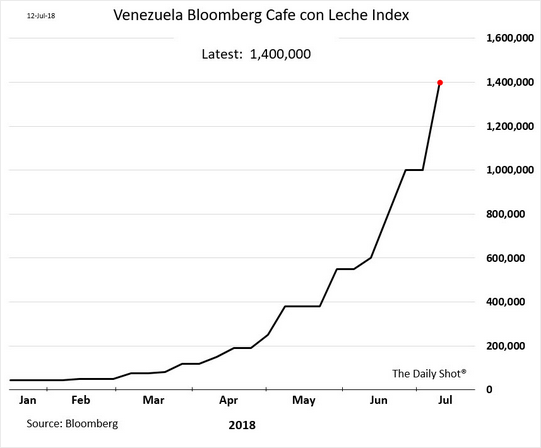
4. This is different kind of monetary madness ,coupled with socialism and corruption gone horribly wrong leading to modern day hyperinflation. There is joke in Venezuela about Maduro diet as 75% of venezuelans population has lost on average 9kg of weight in last 1 year as prices of things rise much faster than the incomes.Below is price of one cup of coffee in Bolivar

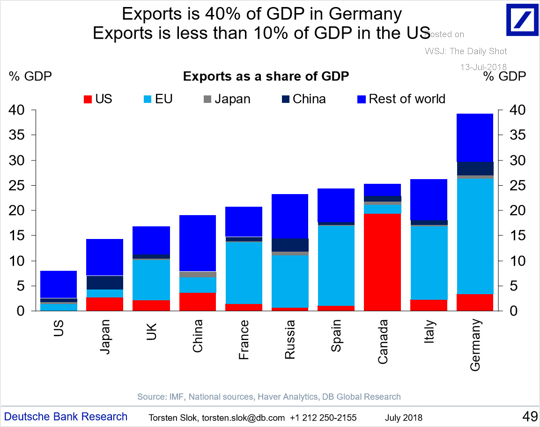
5.The trade fight is not between China and US. Biggest looser is actually Germany which mostly depends on exports for its growth. Germany is having added headwind of aging population .

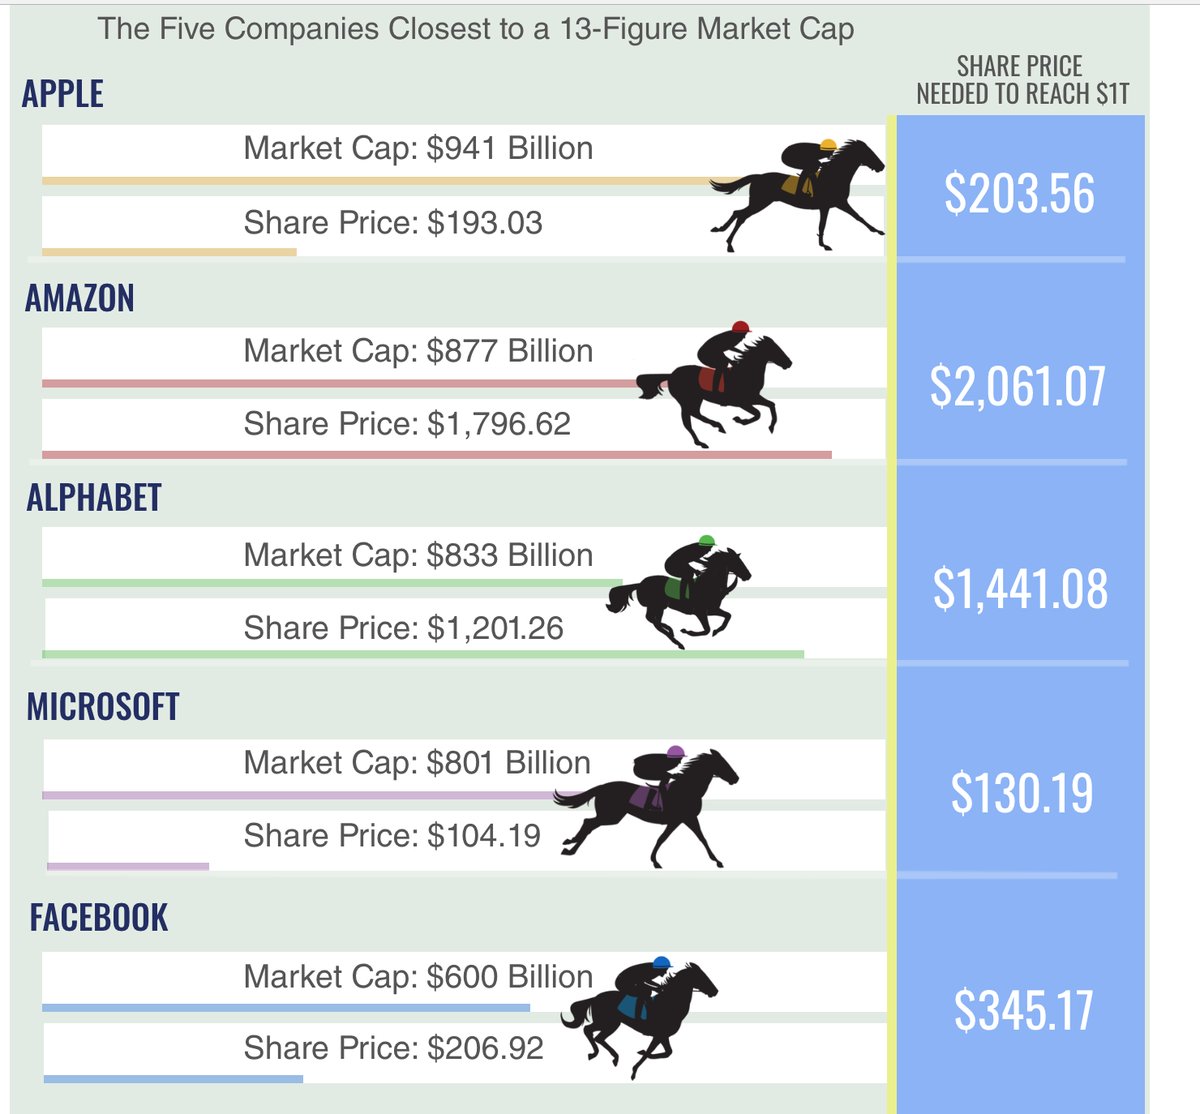
6. The race to a trillion dollar marketcap is on. Here is what share price Amazon or Apple would need to hit to reach the milestone. Would anyone bet on the underdogs? Google, Microsoft or Facebook.

Markets and economies always make a long term high towards events like big bang IPO , Tallest Building , hosting of olympics etc.

whats bigger than trillion dollar market cap?

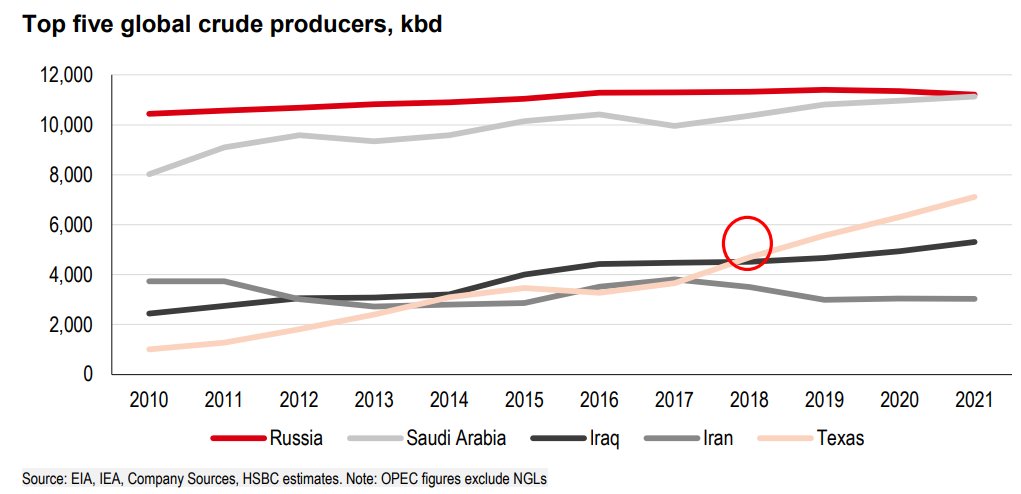
7. Times.. they are changing .Texas will overtake Iran and Iraq as the world’s third biggest “global” crude oil producer this year, says HSBC .American oil is different and better than rest . It is the lightest, purest oil produced in the world, as well as the most valuable and easiest to refine.

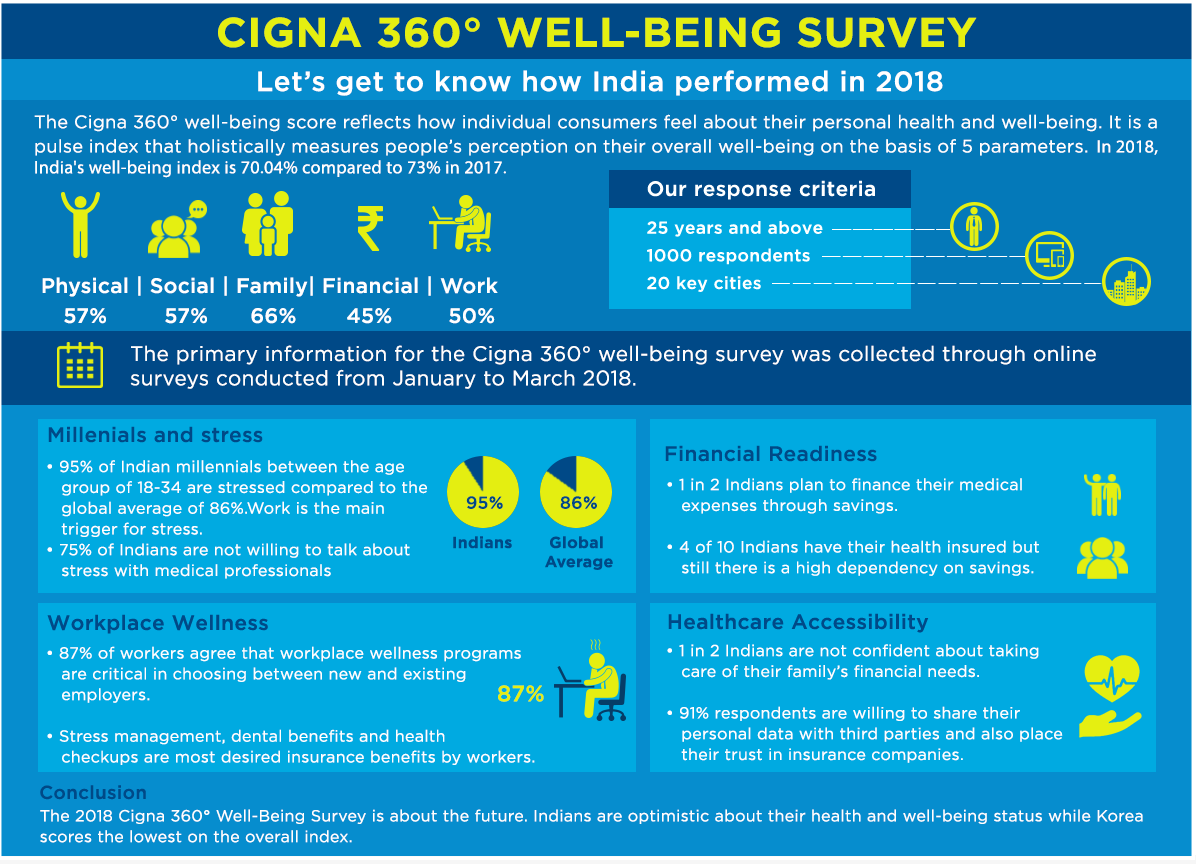
Indians stressed due to work and finances, says CignaTTK Health Insurance survey

1.About 89 per cent of those surveyed in India said they suffer from stress, compared to the global average of 86 per cent
2.Work and finances are the key reasons for stress, with millennials (18-34 years) suffering more than other groups: 95 per cent millennialls reported feeling most stressed and least able to cope.
3.Nearly, 75 per cent of respondents in India do not feel comfortable talking to a medical professional about their stress; cost is a barrier to seeking professional help.
4.In the Social pillar, over 50 per cent of those surveyed from India said they do not spend sufficient time with friends or have enough time for hobbies.

Charts that Matter- volume 3

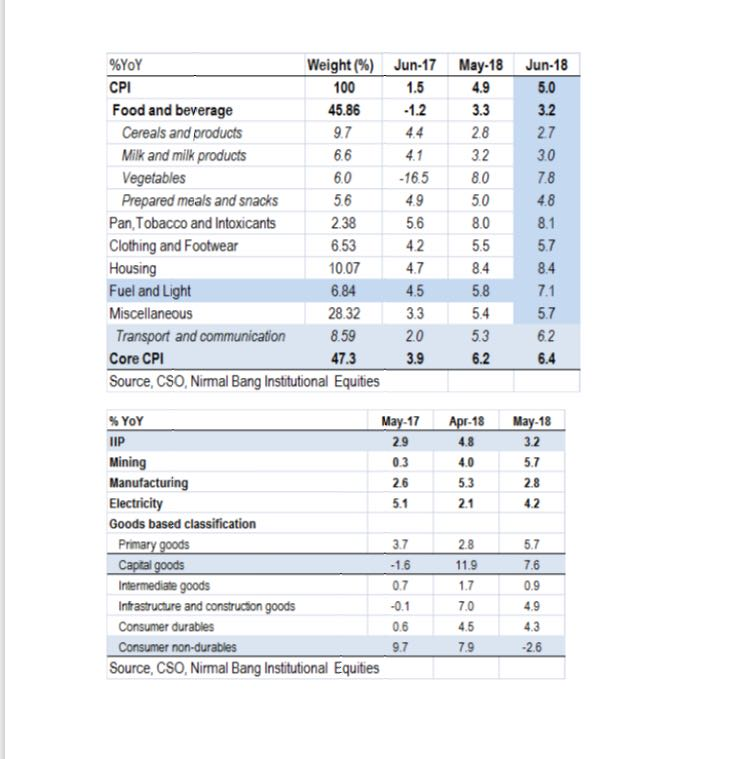
1.India CPI rises to 5% & IIP slows to 3.2%. The downside surprise came from Food inflation whereas core inflation stood at 6.45%.The IIP slowdown can be attributed to consumer non durables.Expect one more rate hike in H2 2018 but MPC to stay on hold in August policy.

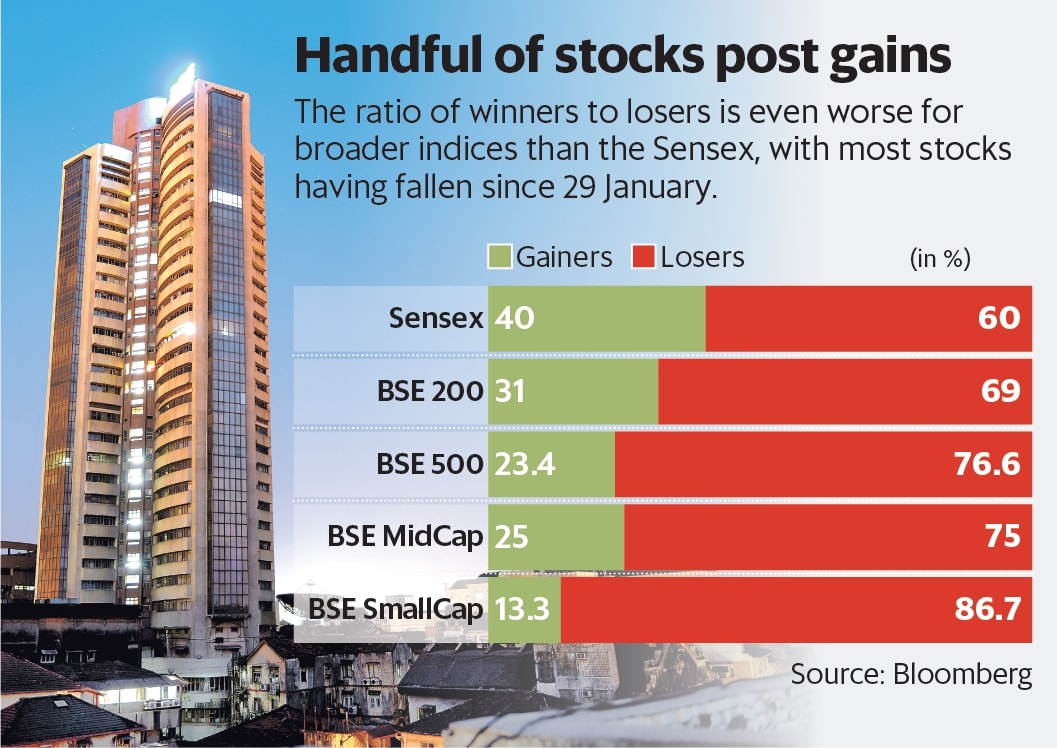
2.Indian benchmark equity indices recorded new highs on Thursday, but the rally is tilted in favour of a handful of stocks, and is far from being a broad-based one. This is classic sign of late stage bull market

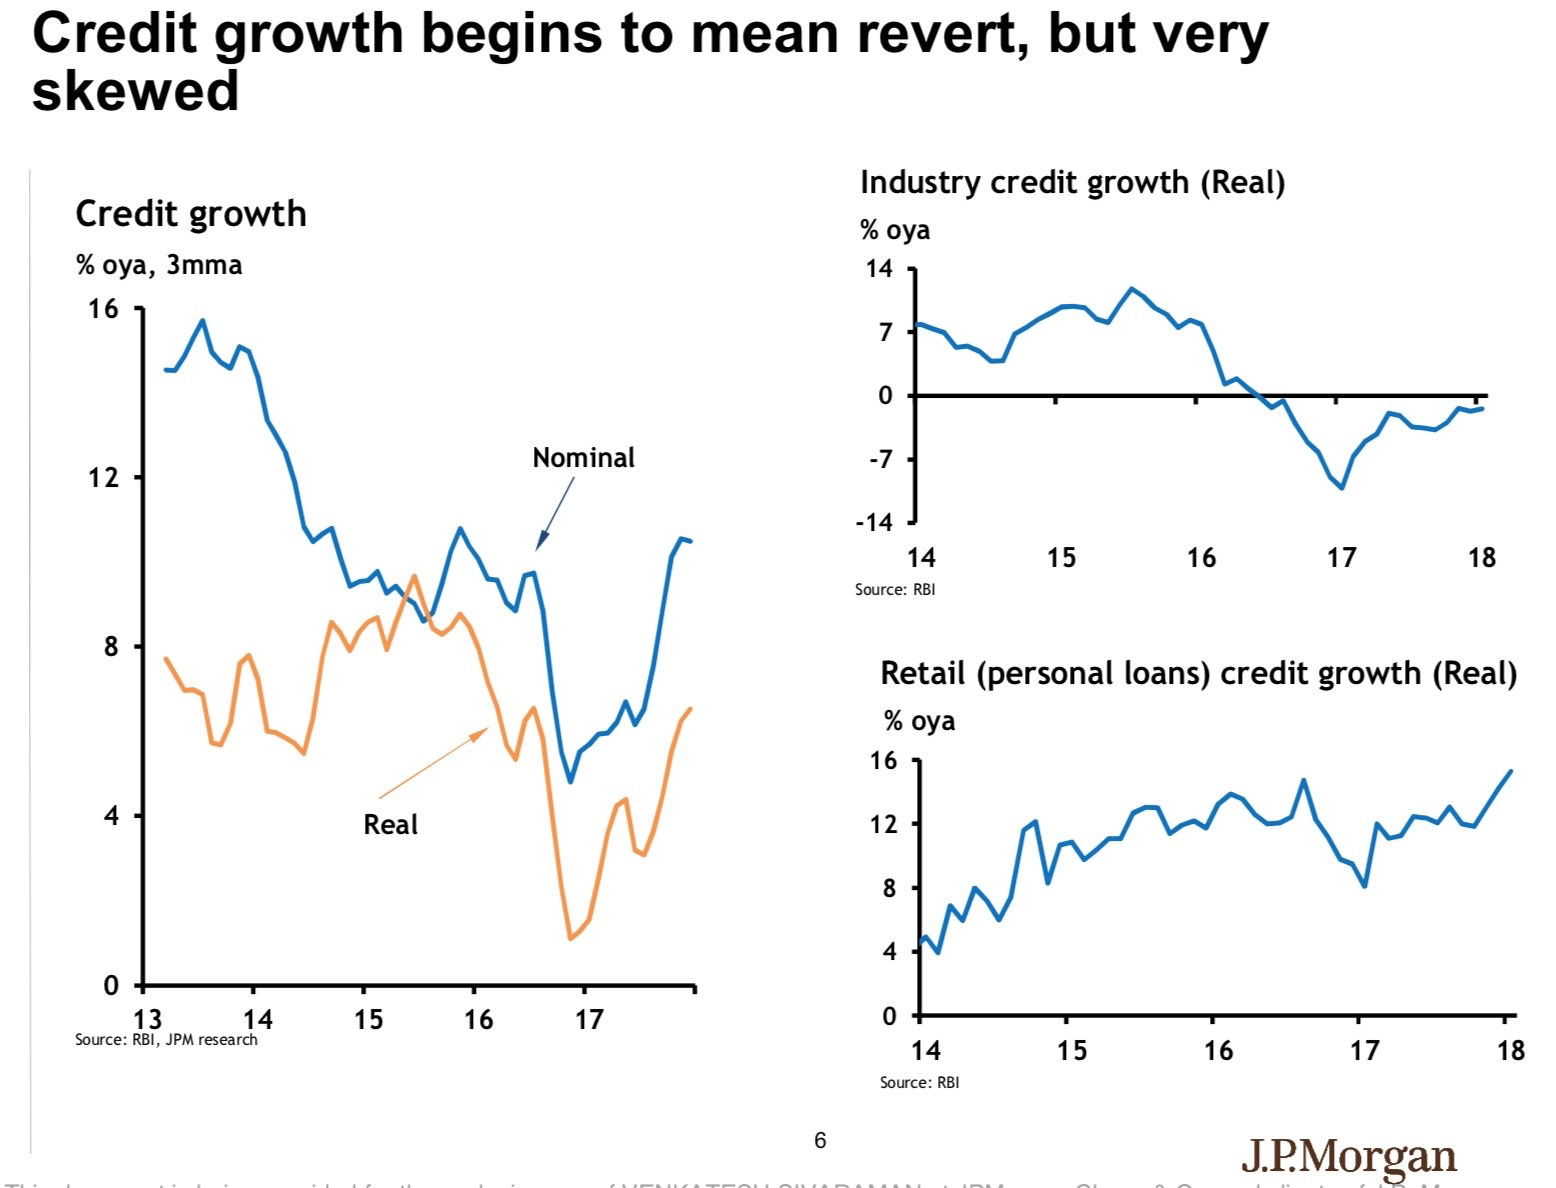
3.India credit growth is still retail driven, Household continue to leverage . Corporate credit growth still restricted to working capital

4.Macro-Economic Dashboard – Most indicators continue to be in green

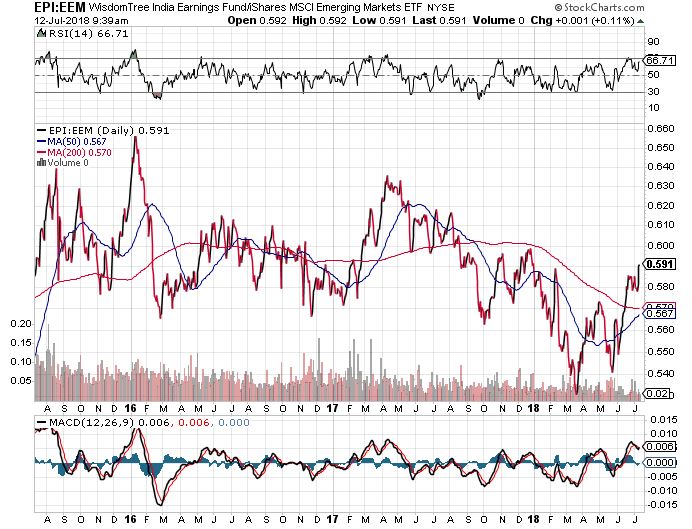
5.India outperforming other EMs. A strong dollar favors India over other EMs. Oil falling is cherry on top.

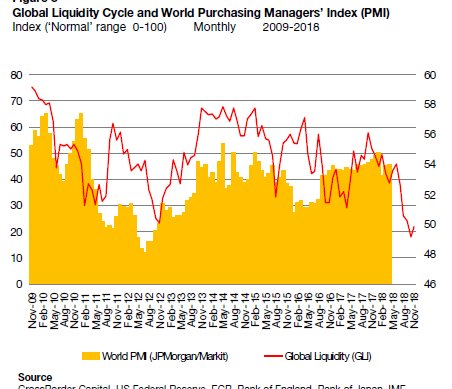
6.Global Liquidity Latest: The Risk Cycle Has Peaked…Are Economies Next? as PMI and Liquidity dips

7.One story about Turkey is the falling Lira and weak BoP. But in many respects that story is a symptom, not the cause. The real story is that 2017 saw a government-led lending boom, boosting growth big time. The credit impulse has now turned negative,weighing on growth big time.India is also doing some of that stuff to boost growth, if private sector does not pick up the slack we could also end up in trouble in 2019.

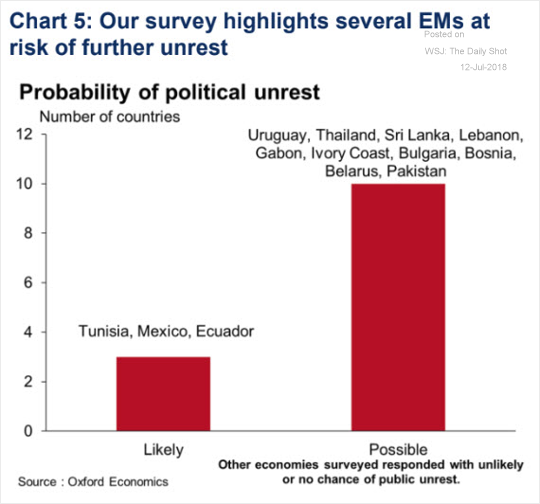
8.Two of our neighbours are on this list and one can actually create serious trouble to divert attention

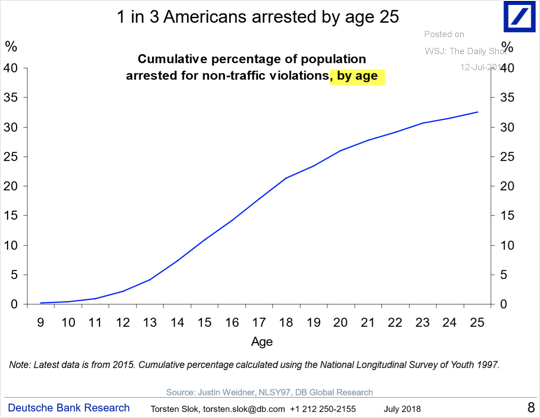
9.Speechless!!!!

Charts That Matter- Volume 2

1.While India’s overall population would grow for another 20-30 years, much of the growth would happen in poorer states, resulting in a huge spike in internal migration. Kerala or Tamil Nadu are far closer to Western Europe in terms of the fertility rate, and the Gangetic belt closer to Africa. A tiff similar to the ongoing international backlash against migration may play out within India

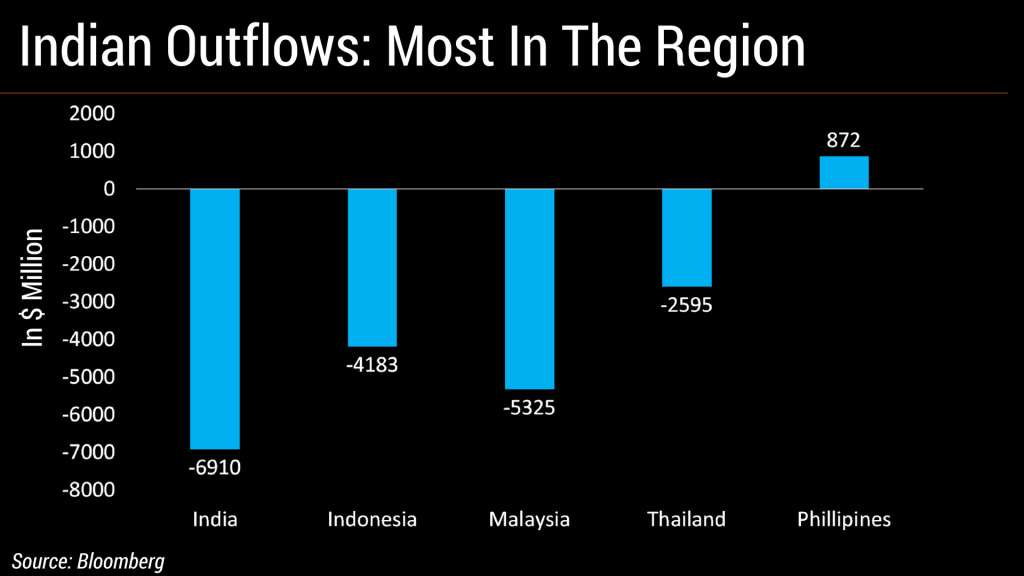
2.India has seen the highest foreign fund outflows among its emerging south and southeast Asian peers so far this year as the rupee depreciates and global trade tensions escalate.Equity market is holding up purely on SIP flows whereas bond yields are bearing the brunt of added outflows from domestic investors

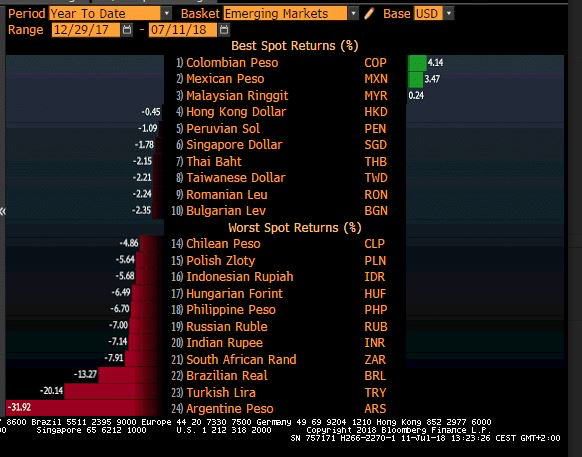
3.The Foreign outflows can also be seen from the lens of currency depreciation. All countries which have seen significant depreciation have seen worsening macros or political instability

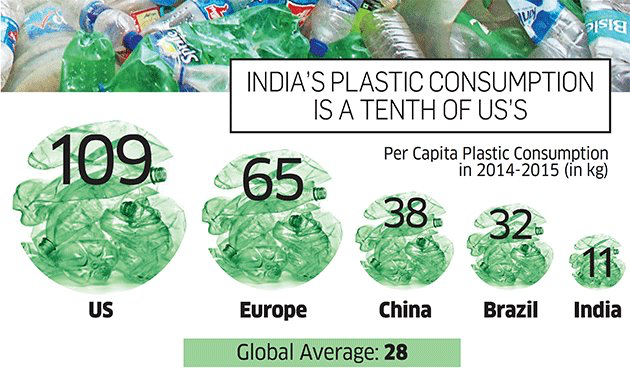
4.Lot of debate on plastic consumption in India, but our consumption is barely 1/10 that of US .

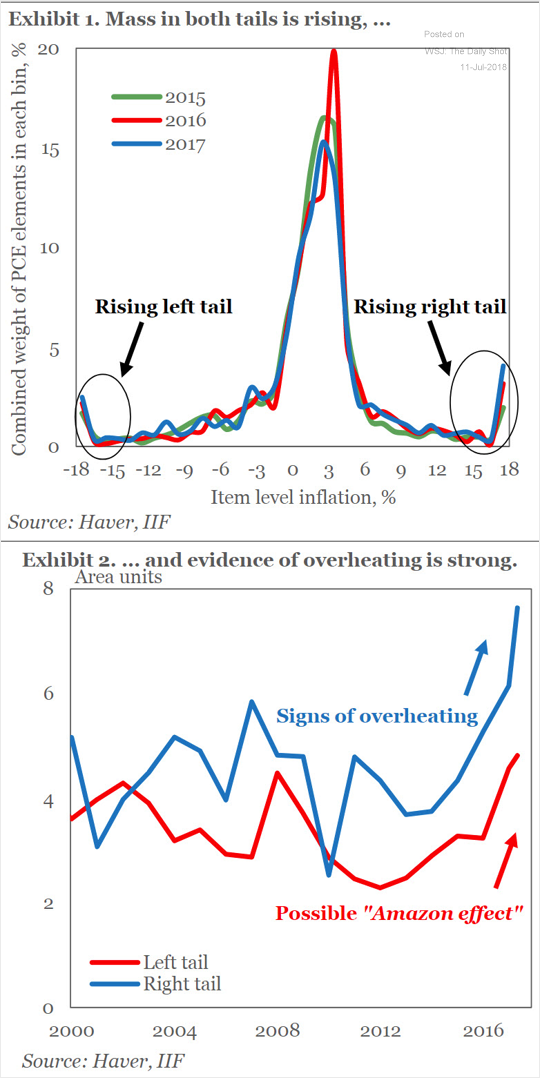
5.Amazon effect on inflation fading as overheating concerns start cropping up.
Below is a chart of US consumer inflation distribution by item. Both “tails” are on the rise. IIF attributes the lower tail to the “Amazon effect.” The upper tail, however, shows “signs of overheating.”
This can be a significant driver of Global inflation

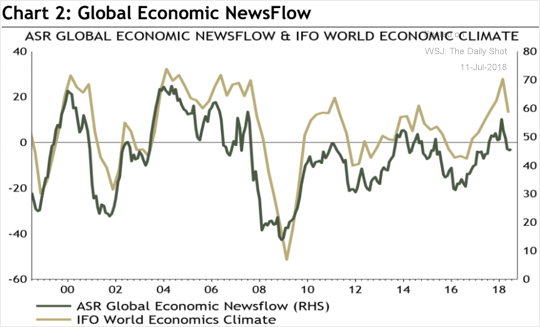
6.But the below proprietary chart from Absolute strategy research on Economic news flow points to a coming global slowdown.If I combine global slowdown with inflation concerns then it points to STAGFLATION

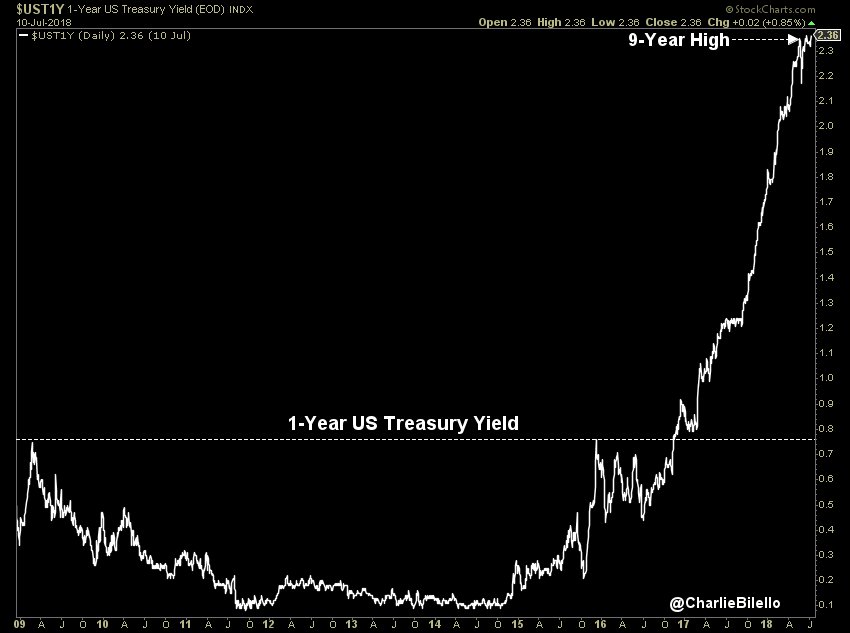
7.The US 1 year yield is at a 9 year high making , highest in the developed world increasing the allure of USD
July ’09: 0.45%,July ’10: 0.30%,July ’11: 0.17%,July ’12: 0.20%,July ’13: 0.13%,July ’14: 0.11%,July ’15: 0.28%
July ’16: 0.50%,July 17: 1.20%
Today: 2.36%

Charts that matter

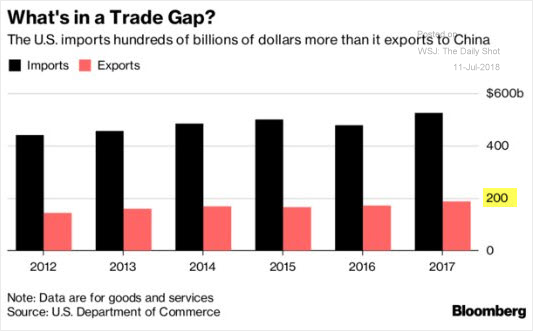
What’s so special about $200bn? China doesn’t import that much from the US, making a tit-for-tat tariff-based retaliation impossible.So how will china retaliate?

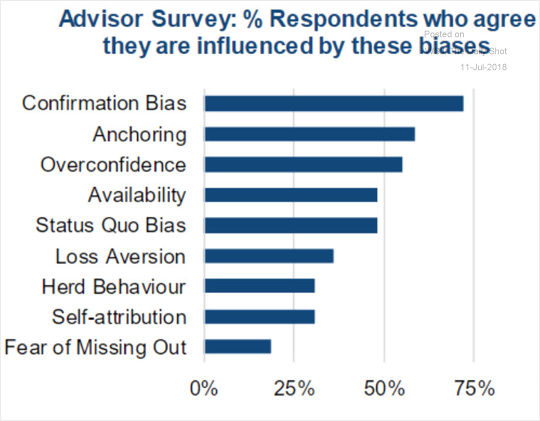
what are the most common investor biases? Apart from confirmation Bias , I always thought it is FOMO ( Fear of missing out)

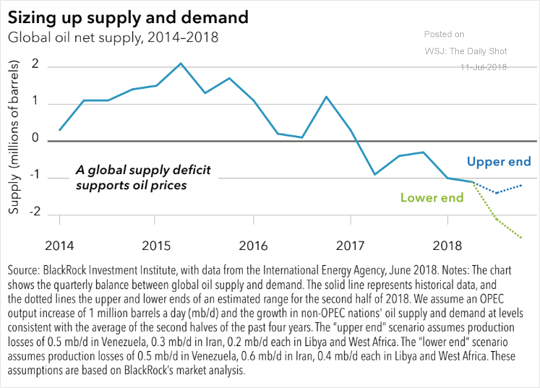
Global crude oil markets are expected to remain in deficit.This is why prices can remain stubbornly high for sometime to come.

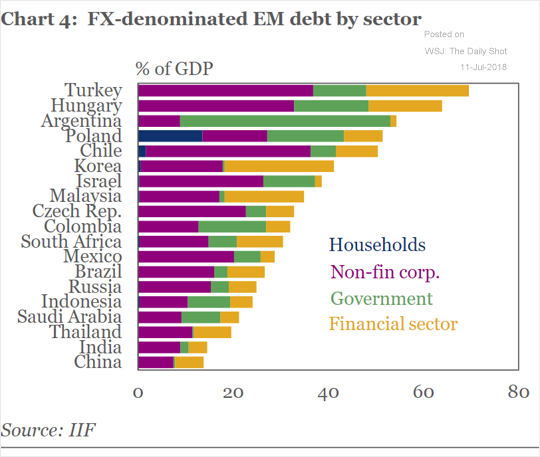
FX denominated debt…. India is way down, thanks to our prudent central bank

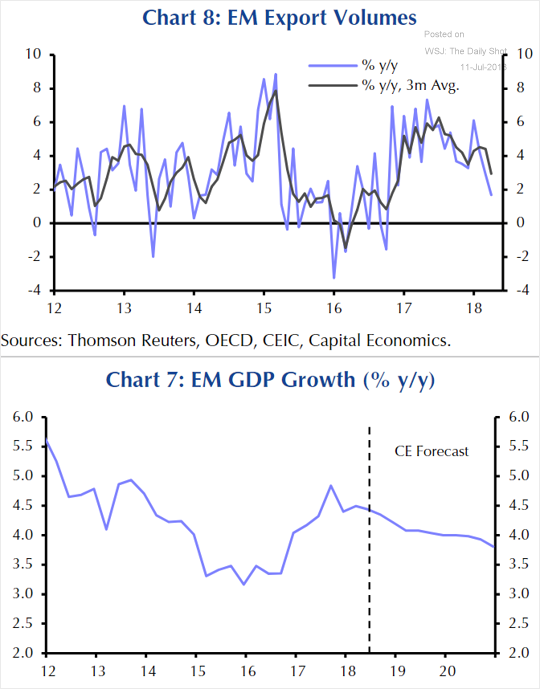
EM exports growth is slowing. India export volume was already struggling even during good time of EM export growth.

Dr Copper is also signalling slowdown ahead. King of base metal is a leading indicator of Global growth

Russian Oligarchs and Indian “Bollygarchs”

The way oligarchs is associated with Russia, some people are associating word “Bollygarchs” with India. Both mean same but probably it gives a’ filmy twist’ to an otherwise menacing term for common man.

The last three decades have seen an extraordinary explosion of wealth at the top of Indian society. In the mid-1990s, just two Indians featured in the annual Forbes billionaire list, racking up around $3bn between them. But against a backdrop of the gradual economic re-opening that began in 1991, this has quickly changed. By 2016, India had 84 entries on the Forbes billionaire list. Its economy was then worth around $2.3tn, according to the World Bank. China reached that level of GDP in 2006, but with just 10 billionaires to show for it. At the same stage of development, India had created eight times as many.

Now the billionaire club has swelled to 119 members,according to Forbes magazine. Last year their collective worth amounted to $440bn – more than in any other country, bar the US and China. By contrast, the average person in India earns barely $1,700 a year. Given its early stage of economic development, India’s new hyper-wealthy elite have accumulated more money, more quickly, than their plutocratic peers in almost any country in history.

Nonetheless, India remains a poor country. In 2016, to be counted among its richest 1% ,Indians required assets of just $32,892, according to research from Credit Suisse. Meanwhile, the top 10% of earners now take around 55% of all national income – the highest rate for any large country in the world.

Raghuram Rajan  – asked an even more pointed question about his country’s tycoon class: “If Russia is an oligarchy, how long can we resist calling India one?”

The nexus between business and politics lies at the heart of this problem of India’s billionaire Raj, namely the boom-and-bust cycle of its industrial economy. In recent decades, China went on the largest infrastructure building spree in history, but almost all of it was delivered by state-backed companies. By contrast, India’s mid-2000s boom was dominated almost exclusively by its private-sector tycoons, giving the industrialists and the conglomerates they run a position of outsized importance in India’s economic development.
Bollygarchs borrowed huge sums from state-backed banks and invested with gleeful abandon, in one of the largest deployments of private capital since America built its railroad network 150 years earlier. But when India’s good times came to an end after the global financial crisis, the tycoons’ hubris was exposed, leaving their businesses over-stretched and struggling to repay their debts. In 2017, 10 years on from the crisis, India’s banks were still left holding at least $150bn of bad assets.

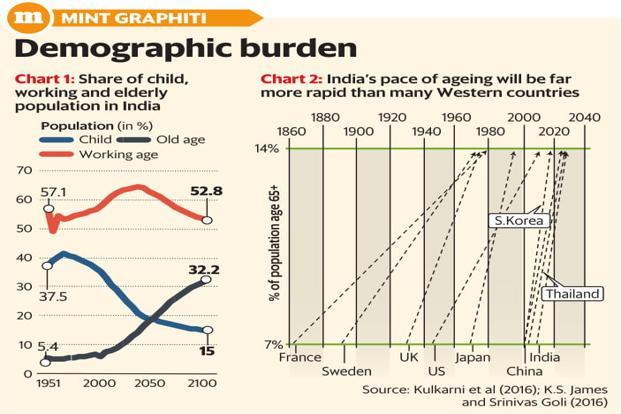
“The main danger with extreme inequality is that if you don’t solve this through peaceful and democratic institutions then it will be solved in other ways … and that’s extremely frightening,( honestly this is my biggest worry as indians get more educated but with less opportunities of employment leading to demographic dividend turning into demographic challenge) as French economist Thomas Piketty has said of India’s future, pointing to likely rising future tensions between the wealthy and the rest.

Meanwhile, as democracy falters in the west, so its future in India has never been more critical. To make this transition, India’s billionaire Raj must become a passing phase, not a permanent condition. India’s ambition to lead the second half of the “Asian century” – and the world’s hopes for a fairer and more democratic future – depend on getting this transition right.

Excerpt fromThe Billionaire Raj: A Journey Through India’s New Gilded Age by James Crabtree

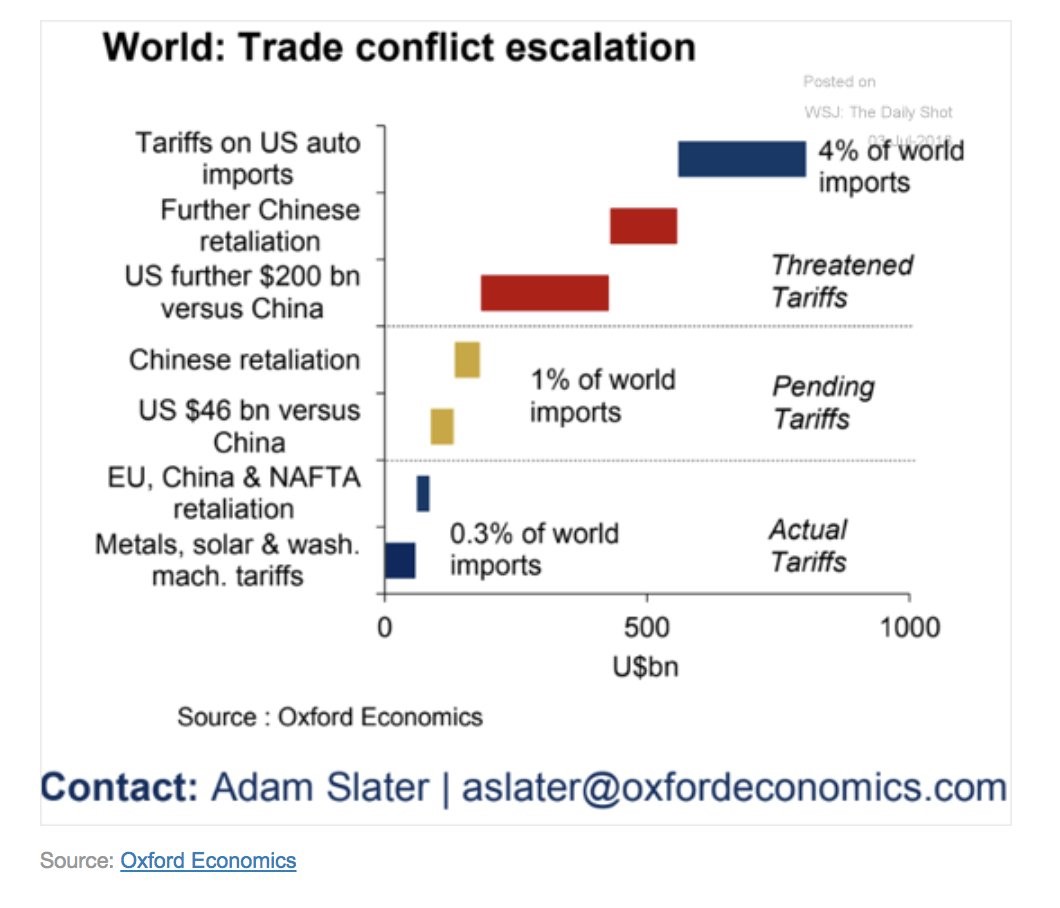
Tariff Barriers only 0.3% of world imports

The Oxford Economics chart below shows the effect tariffs, pending tariffs, potential tariffs will have on global trade.


The current and pending tariffs will have a small impact on global trade growth, but the threatened tariffs will have a medium sized impact on trade which could cause a temporary but sizable decline in trade. The scary part is the threats keep increasing which means the potential for a recession caused by tariffs is getting more likely (it still has a low probability now).

Rupee at 70 and clamour for NRI bonds

In case Dollar continues to appreciate it is but natural that INR will depreciate in line with other currencies and in due course it may hit 70. what is more interesting is that fear of Rupee weakness is coupled with clamour of NRI bonds.

Last time we did NRI bonds, India import cover was down to less than 7 months of import but today our macros are nowhere in that position. But NRI bond is also a drain on exchequer . When India did last NRI bond issue in 2013 Indians basically subsidised NRI’s to the tune of approx USD 3 billion for shoring up our Rupee and not to forget the huge commision earned by intermediaries.

https://www.livemint.com/Money/hDO2Z9mn59fzSM9bsEPHnM/Rupee-may-hit-70Dollar-mark-this-week-say-bankers.html


Market view……is the Coast clear?

Global investing….Thought process for investing over next couple of  months

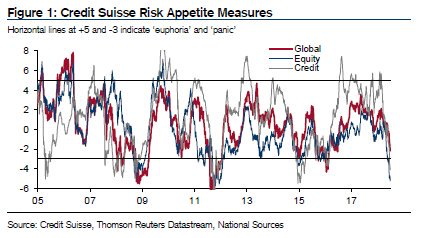
The CSFB Risk appetite has completely collapsed.

The first scare of trade war behind us ………more will be coming but later .

US Market action on Friday was positive with huge positive breadth, the day trade war was actually implemented

…. Sell the rumor ….Buy the fact

Dollar Index has successfully tested 95 zone but not breached it…..it will breach ,but not yet. Any fall in dollar index towards 91-92 will give breather to equity markets.

US and European bond yields have also retraced from high leading to easy monetary condition.

Emerging Markets could be bottoming near term http://blog.knowledgeleaderscapital.com/?p=14473. US markets including US small Cap (Russell 2000) and Nasdaq may see a new high as capital continues to move back top to US. (Small cap and Tech stocks relatively unhurt by trade war hence taking the market lead)
Inflation is building….
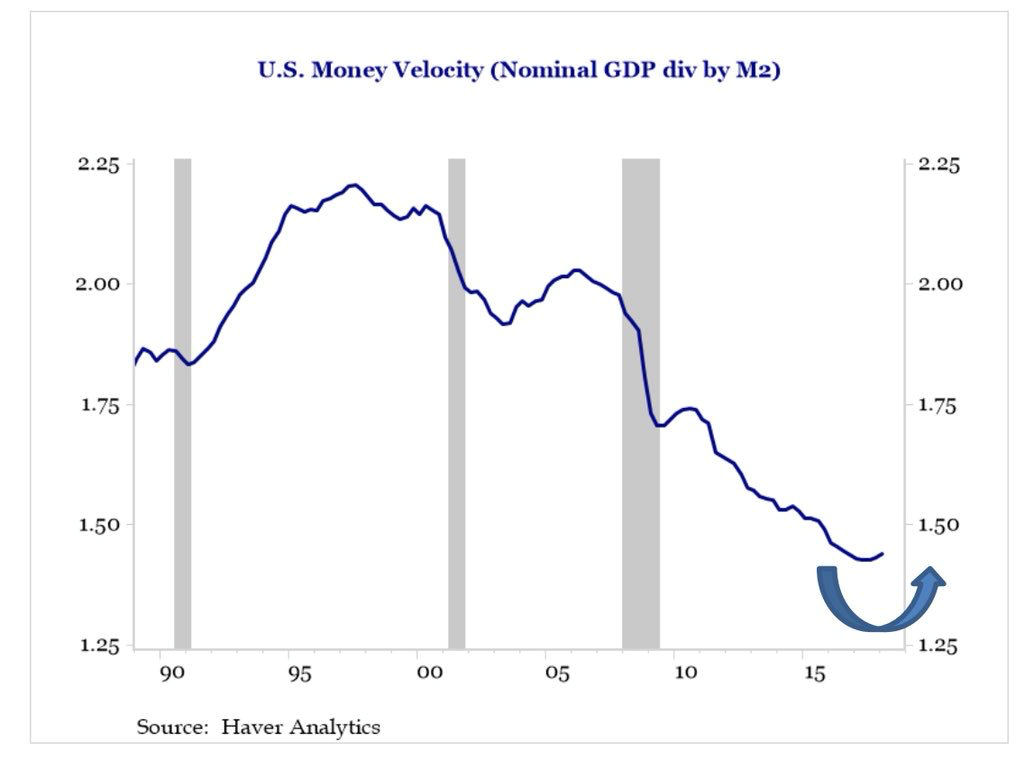
Velocity of money rising in US leading to easier monetary condition .Good sign of growth and Dollar funding


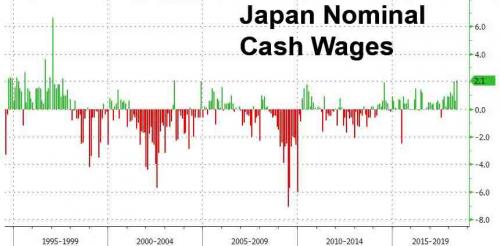
Japanese nominal wage growth at 24 years high

Orders for heavy trucks that haul trailers loaded with anything from junk food to oil-field equipment across the US skyrocketed 141% in June compared to a year ago, to 41,800 orders, making it the highest June ever recorded, according to transportation data provider FTR.
https://wolfstreet.com/2018/07/06/class-8-heavy-truck-orders-2018/.

Initial stages of inflation is good for equities.

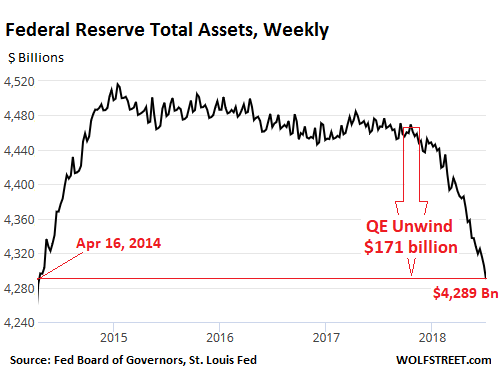
The only concern I have is FED continuing Quantitative tightening….but there is no taper for couple of weeks

when I combine  various indicators,sentiment, market positioning and fear index, it looks like  world equity markets and precious metals are putting a trade able bottom. As long dollar trade unwinds Emerging equities and Emerging market bonds will get a breather and probably both will rally together.

The above is just a tactical view. My medium to long term view ( 1-5 years) on assets outside US is universally negative. I believe capital is headed back to US ( more on this later)and it will lead to significant selloff in global equities and global bonds. This capital reallocation will be positive for US Dollar and I expect dollar index to rally by 110-120 from current levels of 95 .

Hence any coming weakness in dollar is an opportunity for investors to reduce risk , illiquid assets and move back to safety of Cash.

History of Market Bubbles and crashes

Tulip Mania of 1637
• The Tulip mania was one of the first recorded speculative bubbles in history,

• It all started in the late 1500s when a local botanist named Carolus Clusius started to notice that some of the petal colors of the tulip flower began to change colors and this created unique patterns that were quite interesting in shape.

• As word got out, more and more people were intrigued and eventually Tulip brokerages were formed in an effort to facilitate trade for investors.

• The prices for these tulips started to rise to extraordinary levels by the mid 1620’s. In fact, some investors where trading their real estate holdings in exchange for certain highly sought after Tulip bulbs such as the Semper Ausustus.

• Later that year, as some individuals and investors began to take profit and sell their tulip holdings, prices started to fall. As prices fell, more people began to sell their stock of tulips. In addition to those who sold for profit, late investors started to get nervous and they too fearing a decline in price of tulips fueled the collapse.

South Sea Bubble of 1720
• The South Sea Bubble involved an international British trading firm that was given exclusive authority to trade with the Spanish colonies in the West Indies and South America as part of an agreement with the British government after the War of the Spanish Succession.

• The South Sea company was able to sell shares to the public and in addition to the highly lucrative trading profits, investors would also earn a 6% return on their capital which was to be paid directly by the British government.

• During this time, the stock price for the South Sea company was souring. In fact, by the summer of 1720, the share price of the company peaked to over £1000. But the company’s profits were nowhere in line with the public image it had created for itself.

• And so eventually as the promises made were not coming to fruition, selling ensured and prices began to drop. Within a span of a few months, the share price for the South Sea company fell by over 85%.

The Stock Market Crash of 1929
• The Stock Market Crash of 1929 was the worst stock market decline in percentage terms wiping away almost 90% of the value of the Dow Jones Index within four years.

• Prior to the share market crash of 1929, the economy was in full swing and booming. And with the advent of a concept called “margin”, many people who had never before invested in the stock market became active participants.

• Brokerage firms were now financing investment in the stock market with just 15 % or 20% down. Even banks joined in, and used depositors’ funds to buy stocks on margin. All of this frenzy led to share price overvaluations, as more and more investors jumped into the market.

• As soon as the stock market plunged it wiped out most if not all of the equity of leveraged investors and forced many to liquidate other assets to meet their obligations. In addition, many banks were bankrupt overnight, as they gambled their depositors’ funds in the market, and many only had 5% or 10% left to pay depositors’ claims

• It would not be until 25 years later, in 1954 that the Dow Jones would reach 383, the previous high prior to the Crash of 1929.

Black Monday – Stock Market Crash of 1987 • The infamous day Monday, October 19, 1987 is known as Black Monday. This is the day when equity markets around the world were shaken by a widespread selling frenzy.

• The Dow Jones plunged over 500 points, which account for a historic single day drop of 22%.

• And by the end of the month, most Stock Markets around the world were in disarray. The Australian market was down 41%, the Hong Kong market was down 45%, the United Kingdom market was down 26%, and the worst hit was the New Zealand market which had fell almost 60% from its recent high.

• Many professionals have put much of the blame on computerized programs that created large quantities of sell orders in the market, and triggering stop loss levels one after another, which eventually spiraled out of control.

Asian Financial Crisis of 1997
• The Asian financial crisis began with the collapse of the Thai baht, resulting from the Thai government’s inability to support its currency peg to the US Dollar. The Thai baht became a floating currency and devalued sharply as the country was on the verge of bankruptcy.

This crisis spread to other Southeast Asian nations as well including Indonesia, Philippines, Malaysia, and South Korea among others.

• The International Monetary Fund (IMF) was forced to deal with this ongoing crisis, and created a bailout package consisting of over $ 100 billion to help stabilize the region

Internet (Dot Com) Bubble of 2000
• During the mid 1990’s as the Internet was becoming mainstream, it created enormous opportunities for online companies. Both private and institutional money was pouring into online ventures like never before.

• Many internet startups were routinely being valued based on 75% or more growth over the coming 5 year period.

• By the end of first quarter of 2000, investors started to become wary of the exorbitant valuations, and things went downhill from there. Stocks began to fall, particularly in the technology sector, and the Dot Com dreams of many entrepreneurs came to an abrupt end.

• The majority of stocks and indices fell sharply until the market finally bottomed in 2002. During this period, the market wiped away over 5 trillion dollars in wealth, destroying the dreams and savings of many investors along the way.

Housing and Subprime Crisis of 2008
• The story begins back in the 1990’s when the US government started to create programs that would make buying a home more affordable, especially for those with less than perfect or troubled credit.

• As Main Street mortgage brokers were writing a historic number of new mortgages, Wall Street also got in on the action. They started to create and promote mortgage backed securities (MBS), which is a security comprised of a pool of mortgages.

• Wall Street introduced a new type of credit derivative called credit default swaps. Credit Default Swaps were similar to insurance policies. They were designed to protect against a company’s default. But a major flaw with CDS was that they were not regulated, and as such, premium writers were not required to segregate and allocate a reserve, as typical insurance companies are required to do.

• All of these factors lead to a highly over-leveraged environment that was susceptible to systemic risk.

• There was a period of 3 weeks between September and October 2008 wherein the Dow Jones Industrial Average sank more than 3500 points from its recent high. This was a huge stock market drop and accounted for more than a 30% decline in the value of the Dow.

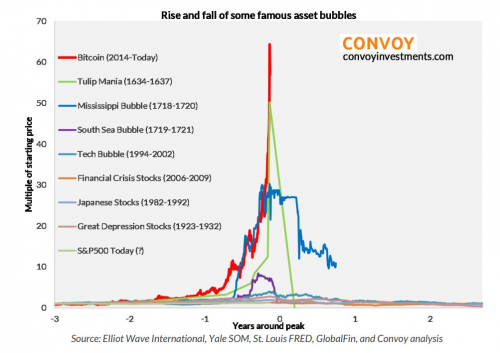
The Biggest Bubble of all time……Bitcoin Bubble

We witnessed the rise and fall of biggest bubble of all time as depicted by the almost vertical line in the chart at the top .

The concentration of money chasing an asset class and the resultant increase in supply of bubble asset determines the madness .

The supply constraint was responsible for this parabolic rise in Bitcoin .

The trigger for epic collapse was the regulatory overreach .

Bitcoin had threatened the monopoly of govt and its ability to print fiat money.