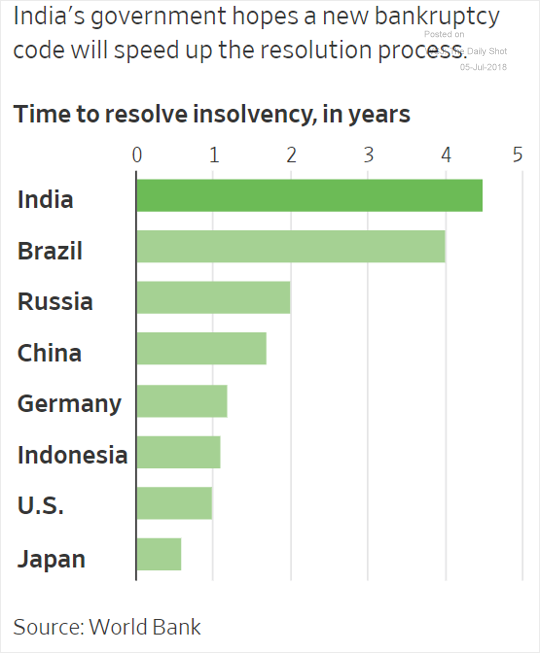
India speeding up bankruptcy resolution

Hence there is lot of expectation from new bankruptcy code which sets a tight timetable for a defaulting company to deal with its debt: If it doesn’t come up with a solution in nine months, the company is liquidated. In May, Bhushan Steel Ltd, became the first of a group of large defaulters pushed into the bankruptcy court by the central bank to be resolved under the new rules. It was sold for $5.2 billion, and creditors recovered almost two-thirds of what they were owed.
“New investors have come in, taken out the old investors and the banks can get on with business.”
An insolvency industry—which has been waiting years for distressed assets to come on the market—is at last emerging in India, and the law has prompted more distressed debt funds to come to the country.

The teething trouble are already there and new code is  already facing legal challenges. Some cases are expected to drag well beyond the 270-day deadline as controlling shareholders and bidders contest points in court.

All the gains in stock Market can be attributed to 4% of listed stocks

There is a  4% rule as it pertains to retirement. It goes like this: If you begin retirement, withdrawing 4% of your savings and adjust each following year’s withdrawals for inflation, your money should last 30 years. It may be the most widely accepted and most often cited rule of personal finance.
There is another relatively new 4% rule.
In January of 2017, Hendrik Bessembinder, who is in the finance department of Arizona State’s business school, released an initial draft of a whitepaper he titled, “Do Stocks Outperform Treasury Bills?”
From 1926 to 2015 the average monthly return on a T-Bill was 0.38%, or roughly 4.56% annually. Surely stocks do better than  Treasury Bills, right? Turns out, most stocks fail to outperform T-Bills.
To reach this conclusion, Bessembinder looked at every single stock listed on all major exchanges .From 1926 through 2015. That’s over 26,000 stocks. He found that only 42.1% of them had returns that exceeded a T-Bill and that more than half had negative returns. The best 86 stocks, or roughly .33% of all stocks ever traded on one of the three major exchanges, accounted for half of all the gains in the stock market.
What’s more, all the gains generated by the stock market can be attributed to the best 1,000 stocks. That is, of the 26,000 stocks Bessembinder researched, just 4% account for every penny of wealth the stock market has ever created. The bottom 96%? Nothing. This is the other 4% rule.
As Bessembinder writes, “This study highlights that non-diversified stock investments are subject to the very real risk that they will fail to include the relatively few stocks that, ex post [based on actual results], generate very large cumulative returns.” Most education in the field of investing emphasizes diversification as a means of reducing risk. Bessembinder re-frames diversification as a means of capturing the full returns of the market. Fail to diversify and you could miss out on the small percentage of stocks that generate long-term wealth.

The implications of Bessembinder’s findings are many. It should make you think twice about how investing is depicted in the financial media. Most importantly, it should shift your focus from which stocks to pick to how you can capture the full returns of the market in as efficient a manner as possible.
 

Interest in Mutual fund declines to one year low

Google trends throws out some interesting trends. The web search for mutual funds is now at a year low.The interest was highest in the first week of this calender year and has been sliding since then.

Numbers represent search interest relative to the highest point on the chart for the given region and time. A value of 100 is the peak popularity for the term. A value of 50 means that the term is half as popular. A score of 0 means that there was not enough data for this term.The current value is 45 which is less than half of 100 seen in first week of january.

Bond market signal and equity market hope

Inflation Targeting and farm loan waiver are two opposite objective but this will only lead to higher inflation and at some point of time stagflation as farm loan waiver does not create any asset with a cashflow by which the debt can be paid. Since bond market is more rational , it is already punishing state development loan ( SDL) yield and crowding out private investment. Equity market is still hoping for this govt spending and free money to be converted into earnings and to some extent it might happen but revenue spending can only take you so far. so what will be standing between an equity market rally and moderating overheating economy will be pace of central bank tightening.

https://www.livemint.com/Politics/NF80IIhIUrSxsKlfDftCcM/Farm-loan-waivers-to-touch-40-billion-by-2019-elections-Re.html

BOJ tapers quitely ..follows FED

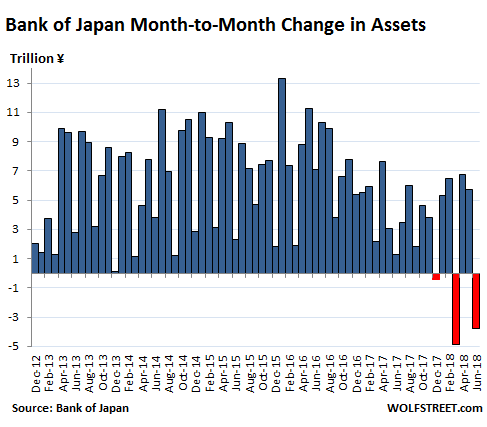
One more central banker takes away the punch bowl without any announcement.In June, total assets on the Bank of Japan’s balance sheet dropped by ¥3.79 trillion yen ($34 billion) from May, to ¥537 trillion ($4.87 trillion). It was the third month-over-month drop in seven months, and the first such drops since late 2012, when the Abenomics-designed blistering “QQE” (Qualitative and Quantitative Easing) kicked off.So three months out of last seven months BOJ has contracted its balancesheet


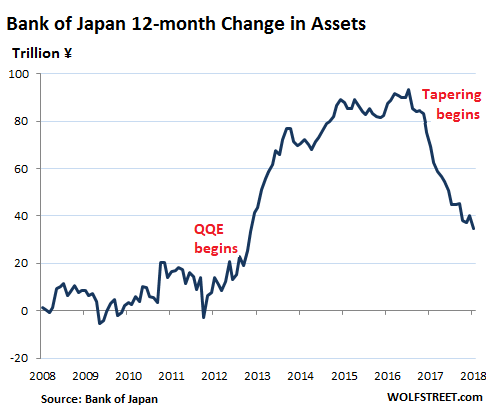
During peak QQE, in the 12-month period ended December 31, 2016, the BOJ added ¥93.4 trillion (about $846 billion) to its balance sheet. Over the 12-month period ended June 30, 2018, it added only ¥34.9 trillion to its balance sheet. That’s a 63% plunge from the peak.
This chart shows this rolling 12-month change in the balance sheet, going back to the Financial Crisis.In other words, the BOJ has started to let some government securities mature and roll off the balance sheet without replacement – much like the Fed’s QE unwind.


somewhere central bankers are realising that they are responsible for this inequality because their policies only helped rich becoming richer through asset markets and that is why its a matter of time we will see heightened volatility across asset markets as the central bank put ia wavering.

Markets Predicting Geopolitics

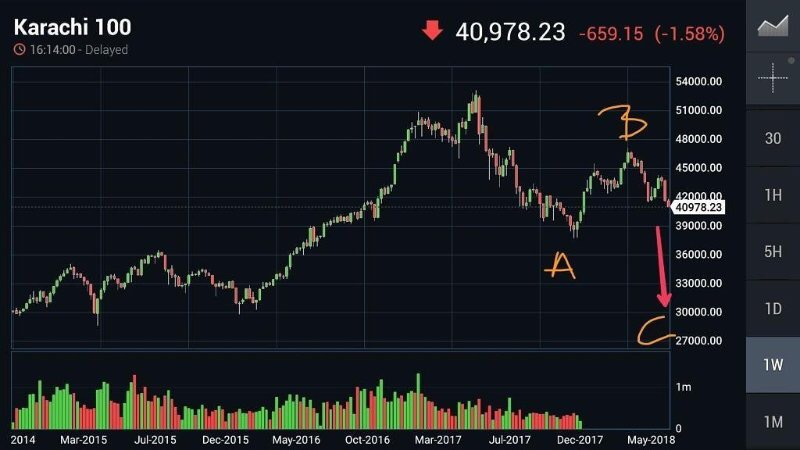
Karachi stock exchange is like a falling knife and as Rohit from indiacharts writes ….. this ugly looking charts should make us sit back and think about its geopolitics implication. Afterall it is time tested strategy to pin the blame of economic turmoil on foreign power .

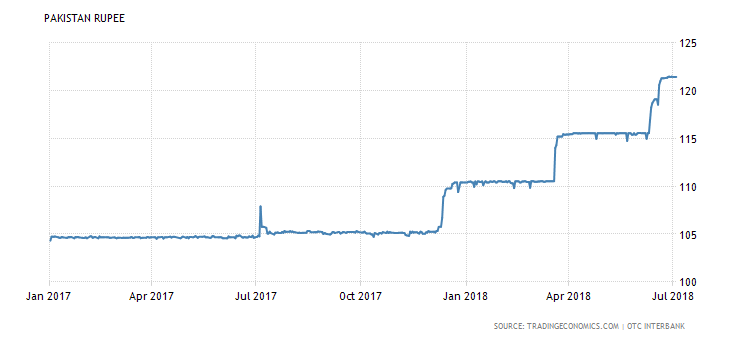
on a seperate note Pakistan Rupee has gone through three devaluation is last one year and it seems it is not done yet

This is one more variable to an already complex market

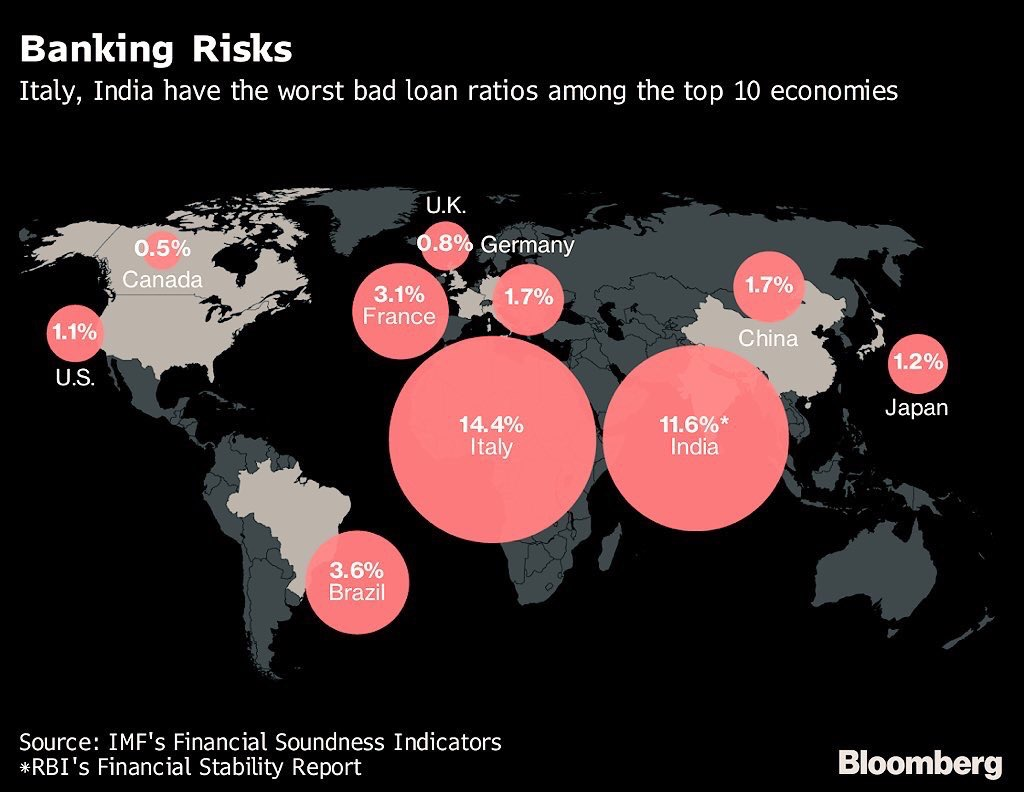
India NPL problem second highest in world

The chart says it all.

Realistically speaking there are only two ways of tackling this problem
1. Inflate away the debt ……accept higher inflation……..inflation reduces the value of debt and increases the value of asset….. currency takes a knock ……making India theoritically cheaper for foreigners… but inflation hurt only poor people

2. Extend and Pretend……makes it a long drawn process… muddle through economy……credit creation suffers as banking capital is slowly wiped away……..economy sees subpar growth for many years

Historically, Emerging Markets have chosen option 1 .India cannot choose option 1 now because it is bound by inflation targeting…..and option 2 is very painful.

Simultaneous rise in these three asset classes is big trouble

I am worried about signals emanating from outside as well as within the country. Rising oil prices and sticky core inflation could lead India towards stagflation.
By this stage of the cycle, corporate capex should have picked – which hasn’t happened, and Govt spending should be reducing – which is not: the question therefore is whether we are in day 3 or perhaps already in day 5 of this test match (market cycle)
With a fundamental shift in US policies, countries dependent on global trade or dollar funding can run into serious trouble.
Simultaneous rise in US dollar, US bond yields and US equity markets will spell significant trouble for many economies and markets – and we are already seeing signs of all three asset classes rising in unison.

(My Last interview before i left BNP Paribas}

http://www.wealthforumtv.com/FundTalkBNPParibas.html#.Wzy3-vZuLIU

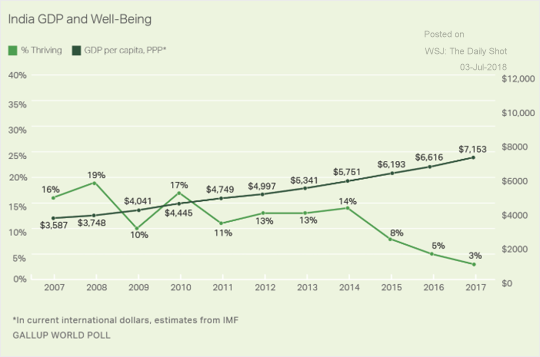
Indians well being diverging from its GDP

The new Gallup poll finds Indians unhappy.  The GDP per Capita, in India, when adjusted by Purchasing Power Parity is equivalent to 34 percent of the world’s average and is marching upwards ,but somewhere around 2014 the trendline of well being diverged from the still upward trending per capita GDP.

India becoming oligopoly and it is bad for job creation

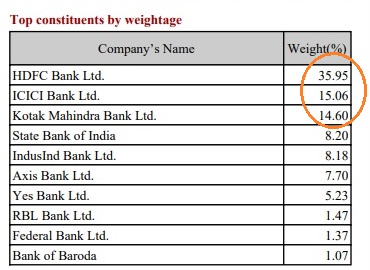
It is very concerning to note that across sectors India is becoming a oligolopy.Telecom industry is poster boy of oligoloply where five companies got decimated and countless jobs lost. Banking has been one of the fastest growing industry but it is interesting to find that only three constituent account for around 65% of an index.

conclusion

  1. If you are trading bank nifty you are basically taking a call on three stocks
  2. The more succesfull and big a bank becomes the more it will automate ( hdfc bank has increased the size of Balancesheet by more than 20% in last one year but the headcount is down by 10%)