What I read this week

Engineered to fail: Are IT recruits untrainable because they cheat in college?

It all started with a statement by Srinivas Kandula, chief executive of information technology major Capgemeni India, at a business event in Mumbai earlier this month.At the event, Kandula said: “I am not very pessimistic, but it is a challenging task and I tend to believe that 60-65 per cent of them [IT recruits] are just not trainable.” Then Dheeraj Sanghi, a professor at the Indraprastha Institute of Information Technology-Delhi, wrote a blog post on the quality of the country’s information technology engineers attributing this to alleged copying in engineering institutions across the country. The professor, who has also taught at the Indian Institute of Technology-Kanpur, wrote that information technology and computer science students in India are falling behind because they have not learnt much in engineering college. He wrote: “I have always been amazed at the Indian software industry. That it can grow so fast and become so big despite the abysmal quality of education in our colleges. “A lot of people have talked about poor quality curriculum, poor quality faculty, poor infrastructure, poor school education, and so on. I disagree. There is a much simpler explanation for this: Copying in our colleges, besides laziness.”

Read More

https://scroll.in/article/830400/are-information-technology-recruits-not-trainable-because-they-cheat-in-college-even-in-iitsRead More


India sales manager index .. at odds with GDp data

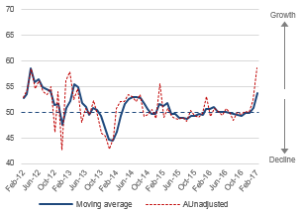
The Sales Managers Index provide the earliest monthly data on the speed and direction of Indian economic activity. The Indian Sales Managers Index for February, shows the after effects of the December demonetisation policy which was intended to crack down on corruption and “black money”. The February Headline SMI has fallen to an index level of 60.2 in unadjusted terms, the lowest level in over 3 years. Managers are reporting a big drop in monthly sales for both the consumer and industrial sectors, with small to medium size businesses that predominantly deal with cash transactions, being hardest hit. February SMI data suggests an erratic situation for Indian businesses as they meet market challenges with considerably lower levels of confidence, slower monthly sales and higher prices caused by the currency situation. This data by worldeconomics is contrary to the GDP numbers published by Govt this week which shows that demonetisation did not have any adverse impact on the economy ……..strange indeed

Read More

http://worldeconomics.com/SMI/India-SalesManagersIndex.efp


Art Bubble bursting……Russian Billionaire Takes 74% Loss on $85 Million Gauguin

Russian billionaire Dmitry Rybolovlev paid €54 million or $85 million for a landscape by Paul Gauguin in a private transaction in June 2008. This week in an auction, he incurred a whopping 74% loss on his store of value “investment” as reported by Bloomberg: The Gauguin was one of four Rybolovlev pieces offered for sale on Tuesday. Another work, a Mark Rothko painting, will be auctioned March 7. Rybolovlev — with a fortune of about $9.8 billion according to the Bloomberg Billionaires Index — invested about $2 billion in 38 works, from Leonardo da Vinci to Pablo Picasso. They were procured privately by Swiss art dealer Yves Bouvier, known for creating a network of tax-free art storage warehouses in Singapore and Luxembourg.

He has already sold three for a loss totalling an estimated $100 million. The five works at Christie’s, all estimated below their purchase prices, were expected to deepen the loss. In May 2015, bouvier warned about the bubble in the  fine art “investment market or indeed the Hyperinflation in Art Investment Market after a Picasso sold for $179 million.

https://www.bloomberg.com/news/articles/2017-02-28/that-85-million-painting-bought-as-an-investment-now-down-74

These are the biggest tax havens of earth

In some places around the world, even rich residents don’t pay income taxes.

An analysis of personal top income tax rates released Thursday by Howmuch.net revealed that residents of some countries — many of which are in the Middle East — don’t pay any income taxes at all. The analysis cross-referenced the country’s top personal income tax rates with gross domestic product per capita to highlight countries with both low taxes and a healthy economy.

While Bermuda has “the most extreme combination of tax rate and GDP per capita in the world,” it’s got other downsides like a high cost of living, a 14.5% payroll tax for some employers and high customs duties that are typically 25%. The Cayman Islands also have a high GDP per capita and no personal income tax, though companies do have to provide pensions for employees, the report reveals. Many of the countries on the list of tax havens are in the Middle East. While the governments in these countries may not tax income, “these countries often have significant oil resources which are taxed by the government,” the report reveals. In Qatar, for example, oil and gas businesses get taxed at a 35% rate. UAE is also a favourite destination for millionaires leaving India for greener pastures.

Read More

http://www.marketwatch.com/story/top-10-tax-havens-around-the-world-2016-02-11
Bank credit growth collapses

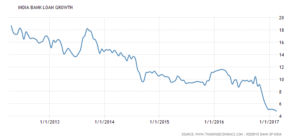
The Bank credit increased 4.8 percent year-on-year in the two weeks to February 17th 2017. Loan Growth in India averaged 12.48 percent from 2012 until 2017, reaching an all time high of 18.70 percent in April of 2012 and a record low of 4.80 percent in February of 2017.


It is possible some of bank credit growth for higher rated corporates got substituted via commercial papers, subscribed by mutual funds hence not a part of bank credit growth rate.Still, it is not a sign of healthy economy and certainly not of an economy which is gowing at 7% . Rbi might have shifted its monetary stance to neutral but weak credit growth means bond yield might remain at current levels for some more time.

Snap is more valuable than these household names

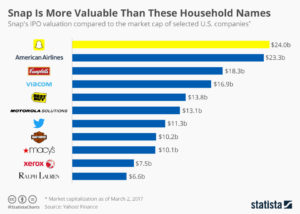
Snap’s IPO valuation of $24 billion is quite a tall order for a company that has never turned a profit and warned investors that it never might. The company is now valued at 59 times its total revenue for 2016. Even for a fast-growing tech company that is a lot. Facebook in comparison has a price-to-sales ratio of around 14.

As Statista chart illustrates, Snap is now valued considerably higher than many American household names. That includes companies such as Ralph Lauren and Harley-Davidson that have been around for decades and probably will be for decades to come.


why Warren Buffett is so reluctant to call stocks a “BUBBLE”

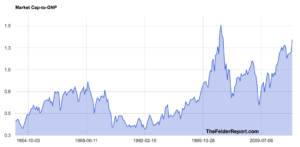
On a macro basis, quantification doesn’t have to be complicated at all. Below is a chart, starting almost 80 years ago and really quite fundamental in what it says. The chart shows the market value of all publicly traded securities as a percentage of the country’s business–that is, as a percentage of GNP. The ratio has certain limitations in telling you what you need to know. Still, it is probably the best singble measure of where valuations stand at any given moment. And as you can see, nearly two years ago the ratio rose to an unprecedented level. That should have been a very strong warning signal.
Today, this measure is very nearly as high as it was at the peak of the dotcom mania. So you would think that this would naturally serve, in the words of Mr. Buffett, as yet another “very strong warning signal.”


Equity is the last man standing?

Lets start with Art

Art Market Bubble Bursting – Gauguin Priced At $85 Million Collapses 74%. Russian billionaire Dmitry Rybolovlev paid €54 million or $85 million for a landscape by Paul Gauguin (featured below) in a private transaction in June 2008. Yesterday, he incurred a whopping 74% loss on his store of value “investment” as reported by Bloomberg.

This painting was worth $85 million in 2008.

Bond Curve Flattening

Curve Watchers Anonymous is taking a hard look at the yield curve in light of the now odds-on market view of a March rate hike.

Before looking at the data below, where do you think rates are relative to January 2014? Up, down, or sideways?

Duration         1-Jan-14              1-Mar-17                  Direction
30 Year            3.96                     3.06                          -0.90
10 Year             3.04                    2.46                           -0.58
5 Year               1.75                     1.99                             0.24
2 Year               0.38                    1.29                             0.91
1 Year                0.13                    0.92                            0.79
30 Days            0.07                    0.63                            0.56

The 2-30 spread flattened by a whopping 181 basis points in just over two years.

The 2-10 spread flattened by 149 basis points.

Not to worry, despite poor economic reports, Fed governors have stated: “This is a surprisingly strong economy.”

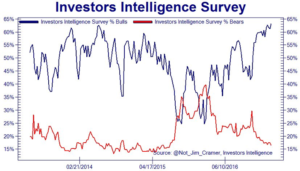
And this is from CNBC “Wednesday’s strong showing for the stock market came as the Investors Intelligence survey of newsletter writers showed extreme bullishness again. The percentage of equity bulls came in at 63.1%, up from 61.2% in the prior week and the highest level since 1987. The survey is used as a contrarian indicator because excessive bullishness has been seen at or near market tops in the past”.

As Martin Armstrong writes, it is all about capital flow
“This European crisis is pushing up the Dow and capital flows from smart money is starting to vacate Europe headed into the Dow for that is where “big money” always hides. Of course, domestically, they are attributing this as always to just local issues now praising Trump’s speech as optimistic”

So Art bubble deflating, yield curve flattening, Equity investors overtly bullish and big capital hiding in dow.

Equity is the last man standing ….. lets see how long it lasts


Private consumption expenditure behind stellar GDP numbers?

The Central Statistical Office surprised the nation on Tuesday evening when it released advanced estimates of Gross Domestic Product growth for the October-December quarter. Despite widespread economic disruption caused by the Union government’s demonetisation move on November 8, the GDP figures have registered a robust growth of 7% in the third quarter. This defies predictions by most economists that weak consumption would drag the rate down well below that figure.

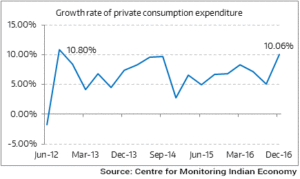
GDP when measured by expenditure method is obtained by adding private consumption expenditure, government consumption expenditure, investments and net exports (imports minus exports). The private consumption expenditure forms a bulk of the GDP measured through this method and this is what has grown by 10% in Oct dec period .

This when 86% of all valid currency notes were demonetised on November 8 and Indians were under tremendous pressure from arbitrary limits on bank and ATM withdrawals. How did people consume so much when there was an acute scarcity of cash?

I forgot they went on this spending binge by taking loans ,after all it is not necessary that people spend their hard earned money on consumption they can also take loans…… right?

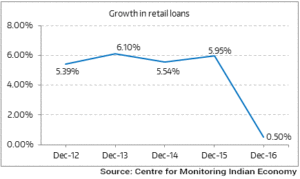
Oops even growth in retail loans collapsed during oct-dec perios

So my guess is there is preponement of future purchases out of cash remaining with household. if it is true then it is clearly a case of upfronting the GDP

Indian Sales Fall as Demonetisation Effects Hit Small and Medium Size Businesses

The Sales Managers Index provide the earliest monthly data on the speed and direction of Indian economic activity.

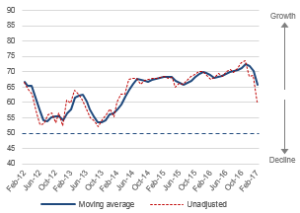
The Indian Sales Managers Index (SMI) http://worldeconomics.com/SMI/India-SalesManagersIndex.efp for February, shows the after effects of the December demonetisation policy which was intended to crack down on corruption and “black money”. The February Headline SMI has fallen to an index level of 60.2 in unadjusted terms, the lowest level in over 3 years

Headline sales manager Index

Managers are reporting a big drop in monthly sales for both the consumer and industrial sectors, with small to medium size businesses that predominantly deal with cash transactions, being hardest hit.

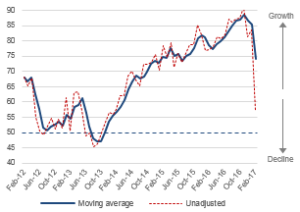
Sales growth Index

Prices are rising for both services and manufacturing sector

Price charged Index

February SMI data suggests an erratic situation for Indian businesses as they meet market challenges with considerably lower levels of confidence, slower monthly sales and higher prices caused by the currency situation.

HSBC Balancesheet…..Always shrinking

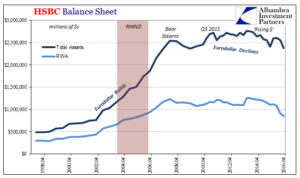
HSBC is yet another bank that shows very well what is wrong with the global economy, because what is wrong is entirely about more than just the post-crisis era. We talk about a “dollar” shortage and there clearly is one, but the saga of HSBC demonstrates that this chronic shortage is just a symptom of the wider problem. The history of the bank’s balance sheet is one that is immediately recognizable in so many other forms:

The problem with HSBC today as author writes is a shortage of Eurodollar. In an indebted world and fractional banking system there is no scope for shrinkage of balancesheet.

Will India be left behind in new Industrial revolution?

Robot Invasion Map

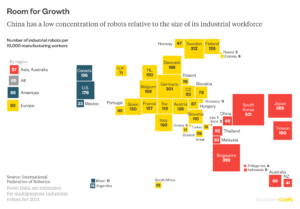
This map-like infographic from Bloomberg shows the ratio of industrial robots to human workers by country and region.

Larger boxes mean more robots per human factory worker. By this measure, four Asian countries stand out for their highly automated industries: Singapore, South Korea, Japan, and Taiwan. Within Europe, Germany leads. The US has proportionally more robots than Canada, and the machines barely have a toehold in South America. The main point here is who’s missing: China has barely begun to automate. This can’t persist if Beijing wants to retain its export volumes. Chinese companies are now in a headlong rush to install industrial automation technologies, and the trend will likely accelerate .

what about India?


More Layoffs Likely As India’s Manufacturing Sales Shrink

Despite the government’s efforts to attract investment under its Make-in-India campaign, sales of manufactured goods fell 3.7% during 2015-16–the first decline in seven years–sparking fears of layoffs and debt default in the months to come.

Spurred by a global slowdown and lack of demand, sales of manufactured goods were falling even before demonetisation, affecting sectors ranging from textiles to leather to steel.

As a result, in the six months to September 2016, engineering major Larsen & Toubro laid off some 14,000 employees. Companies such as Microsoft, IBM and Nokia were also reported to have cut back on their workforce in 2016–albeit on a smaller scale–blaming sluggish demand for downsizing.