Most important Chart in the world

The most important chart to watch right now is the US 10yr Yield

rising bond yields will put pressure on “Long Bond proxy” .. the Tech sector and could accelerate the move into Value and Emerging Markets

( chart courtesy allstar charts)

But who is most exposed to rising rates?

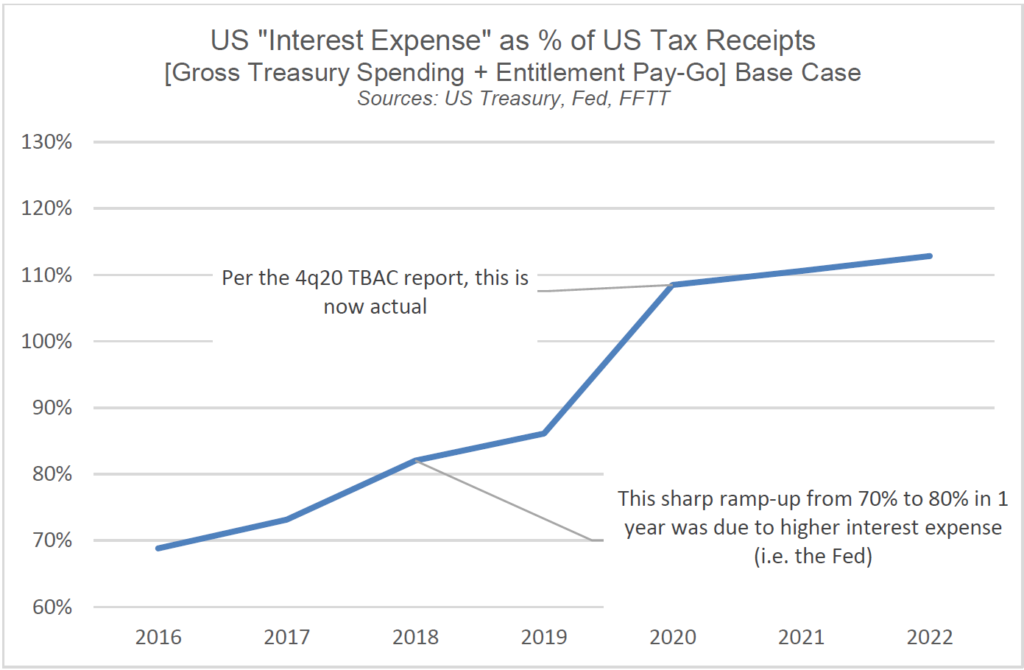
No it is not US households, neither it is US corporations but it is US govt

As Luke Gromen writes in FFTT

Fed is trapped and they cannot allow free markets to function because rising rates

This time is different

I believe that rising commodity demand will not be met by increase in supply for a long period and we are headed for “Higher for longer” commodity prices.

They are not increasing Capex but giving back the cash

This one from Glencore presentation yesterday on state of copper mining

However, investments in mining exploration are at a 62-year low!

Industry leaders and insiders are raising the alarm on crude oil prices.

Look at the size of demand

and the demand which will come because of US infrastructure bill which most investors are not taking it seriously.

I am quite impressed by the credentials of Infrastructure czar

“India Indicator” Better Than “Buffett Indicator”- JC Parets

If you’re ignoring the Indian Stock Market, I think you’re doing yourself a huge disservice.

Even if you never plan on trading stocks in India at any point in your life, it doesn’t matter. There’s amazing information coming from there.

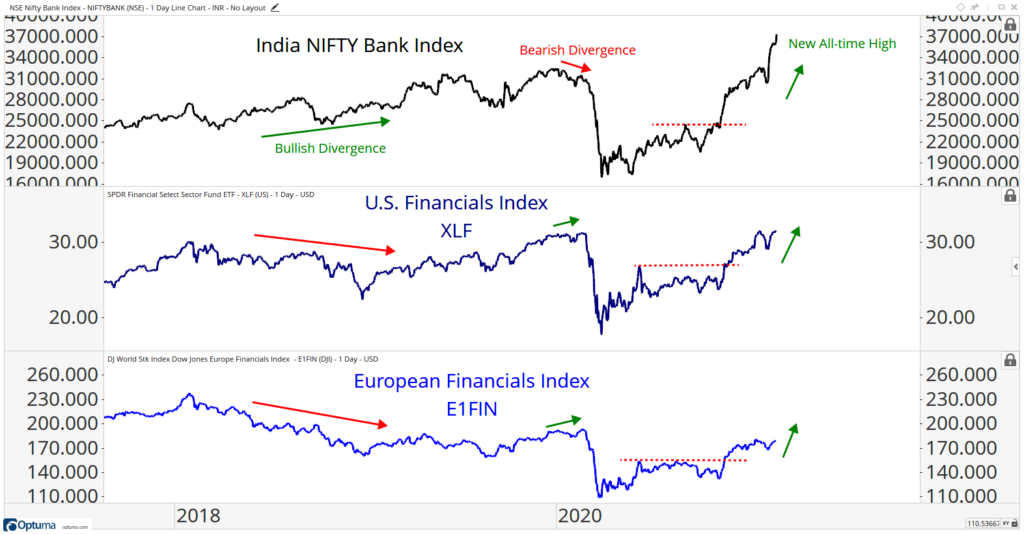
For example, take a look at that relative strength in Indian Bank stocks before US Stocks, and Stocks in general, rallied throughout 2019. That was an epic rally, if you recall.

The Indian Banks had already been telling us that it was coming!

Then Fast forward to Q1 2020 when US Financials made new highs along with European Banks. But Indian Bank stocks were already warning otherwise, for months before stocks finally crashed.

Full post below

Emerging Markets crisis investing- Verdad Capital

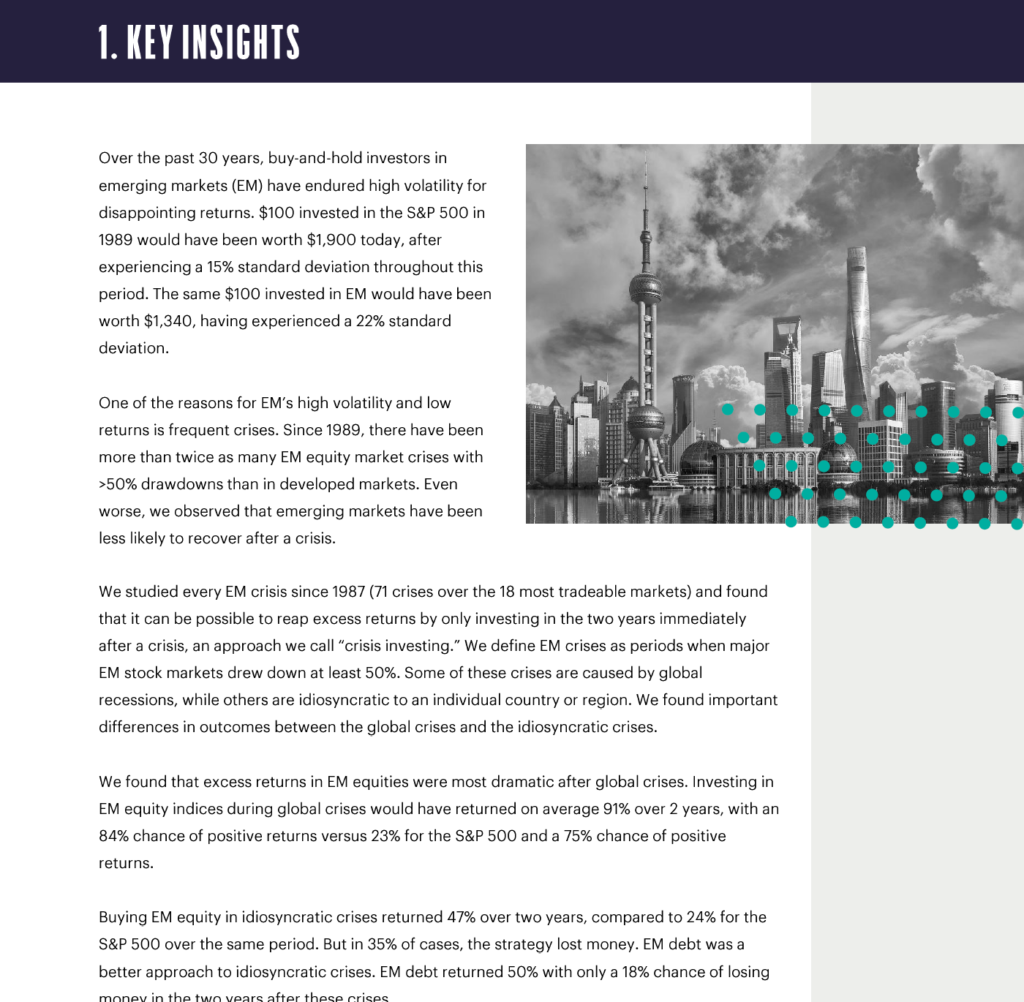
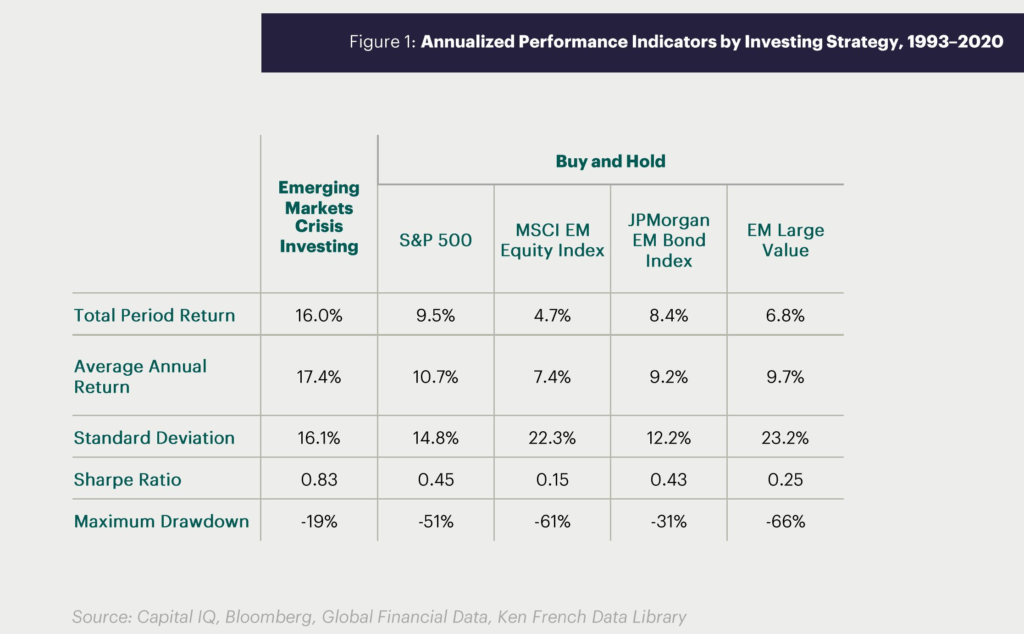
This is a brilliant paper on “when is the best time to invest in Emerging markets” and the author concludes that EM gives best returns after a global crisis.

Here is the return

Full paper below

https://static1.squarespace.com/static/5db0a1cf5426707c71b54450/t/601da88946f6aa3a2d177c28/1612556446187/Emerging+Markets+Crisis+Investing.pdf

Ignoring energy Transition realities

I read a piece by Goehring & Rozencwajg you may also access the commentary here on supply demand mismatches commodities in general and specifically on some of my favorite topics like OIL, AGRI, URANIUM, COPPER, GOLD

Main Points

On Alternate Energy

Vaclav Smil, Distinguished Professor Emeritus in the Faculty of Environment at the University of Manitoba, is the best energy scholar we have ever read, in our opinion. In his Energy Transitions, he notes that historically a new energy source takes between 40–60 years to gain significant market share. The current proposals assume wind and solar will make comparable gains in only 20 years. Ambitious plans often carry ambitious budgets, and the green energy transition is no exception. Using extremely aggressive cost saving assumptions, a widespread move to renewable power is expected to cost $70 tr over 20 years, nearly $50 tr more than if we stayed on the current trajectory. Unfortunately, our research tells us this additional spending will not even come close to generating the expected reduction in global carbon.

Electric vehicles will likely not deliver the necessary carbon reduction either. In Norway, electric vehicle sales have gone from zero to nearly 60% penetration between 2010 and 2019. Despite such a dramatic shift away from oil, Norway’s carbon intensity has declined by 10% compared with 11% in the US where EVs remain less than 2% of all vehicle sales.

Wind and solar are extremely inefficient generators of electricity due to their low energy density and their intermittency. In the coming weeks, we will release a podcast that goes into much greater detail about these shortcomings. In summary, a solar panel likely only dispatches between 12 and 20% of its rated capacity due to the intermittency of sunshine. A wind turbine is somewhat better, but still less than 25%. As a result, excess capacity must be built to generate the necessary electricity. Moreover, the power must be “buffered” by a storage system to smooth out the inherent variability coming from both short-term dislocations (clouds and periods of calm), as well as different patterns between day and night.

On Oil

Regarding demand, we believe 2021 will see a huge rebound. Although the financial press has made little comment, oil consumption in China, India, and now Brazil has made new highs. If our models of emerging market oil demand are correct, 2021 will see global oil demand surpass its pre-COVID highs as the successful roll-out of vaccines gets underway. As we progress through the year, we expect a structural gap between supply and demand will emerge, eventually approaching nearly three million barrels per day, even once all OPEC+ curtailed oil is brought back onto the market. Given that oil prices should recover strongly in 2021 and that oil-related investments remain undervalued, we recommend maximum exposure in this space.

On Copper

China today is pushing to become a leader in generating electricity from renewable sources, an extremely copper intensive exercise. This alone could add several hundred thousand tonnes of incremental copper consumption annually. Also, China, has announced huge investments in their data center and cloud computing industries, both extremely copper and power intensive

On Precious Metals

We continue to believe this gold bull market will be driven by Western investors, as opposed to the 1999–2011 gold bull market, which was driven almost entirely by investors from India and China. The recent slacking of Western demand, as measured by the physical ETFs we follow, gives us more evidence that a potential lengthy period of sideways price action in both gold and silver prices is now taking place.

On Uranium

Despite the bullish outlook (and the Q4 rally), 2020 in many ways, was a frustrating year for uranium investors. Spot prices were strong between January and May, rallying from $24 to $34 per pound before retracing half the advance to end the year at $30.20 per pound on much lower volumes. Term prices rallied from $32 to $36 per pound between December and January and have been stable since on extremely depressed contracted volumes. Concerns over COVID related demand forced many term fuel buyers to the sidelines. US utilities are only 2% uncovered in 2021, but this level jumps to 35% by 2025, suggesting fuel buyers are vulnerable to any rise in price. With the recent speculation of delayed US reactor retirements, we believe we may see fuel buyers finally reenter the term contract market sometime in 2021.

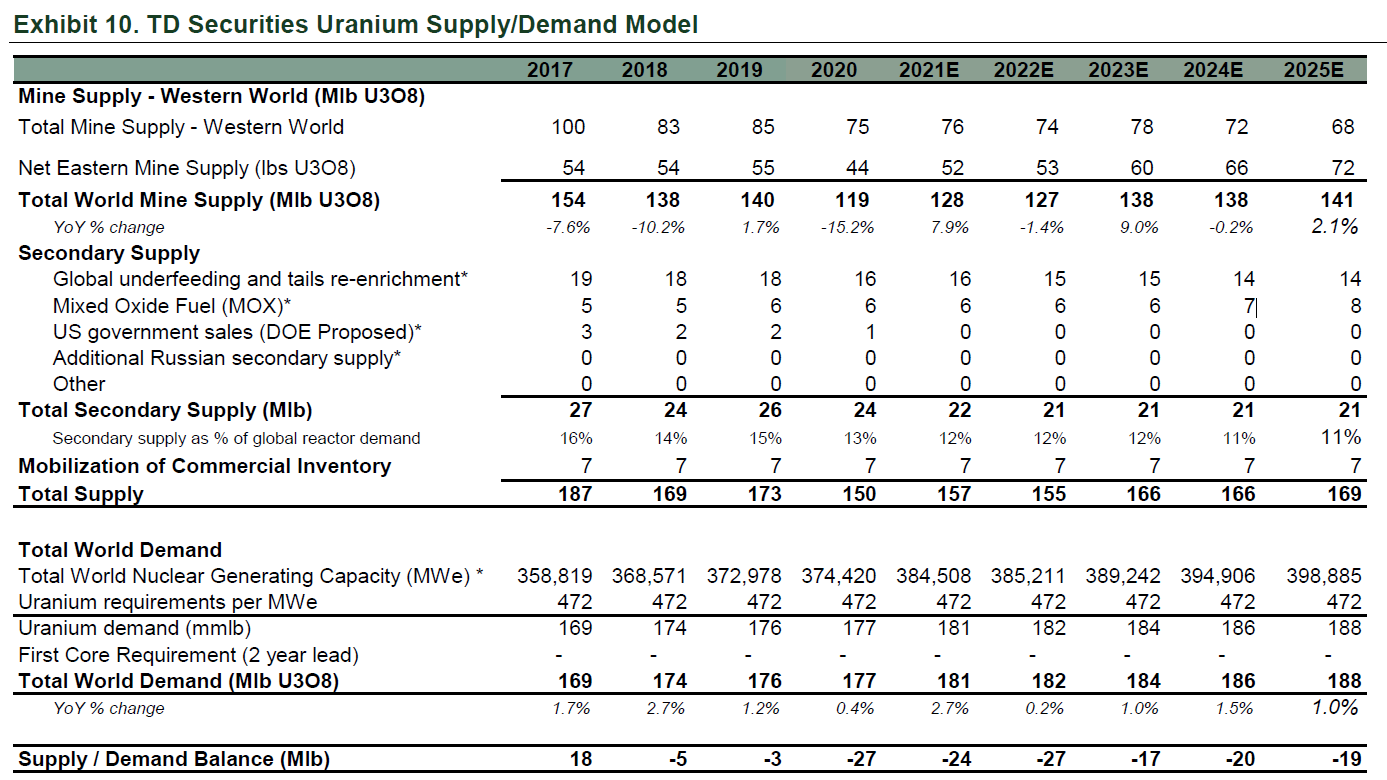
Turning to supply and demand, trends exhibited in 2020 continue to be very bullish. Since nuclear reactors represent baseload capacity—much more so than natural gas plants—and rely on multi-year fueling programs, global demand was less impacted by COVID-19 than other areas in global energy markets. We estimate that global demand was only off 1%—or 1.2-mm pounds. Mine supply on the other hand was greatly impacted by curtailed production at Kazatomprom and the suspension of operations at Cameco’s flagship Cigar Lake due to COVID cases among employees. In total, global mine supply was down 20 mm pounds or 14%. After restarting in September, production at Cigar Lake was yet again suspended in December and remains shut as of today, implying continued tightness into the first months of 2021. Global uranium inventories likely drew in excess of 30 mm pounds in 2020 and we anticipate further draws this year as well.

The coming global agriculture crisis

Over the last four years, global agriculture has sat on a knife’s edge. Extremely strong grain demand, sourced from the developing world, has been met with extremely favorable global growing conditions resulting in bumper crops. Because of favorable weather, global grain markets have been able to accommodate strong demand with little in the way of upside price pressure. However, we believe this is now changing.

”Grain inventories have now been drawn down to levels that could easily slip into dangerous zones if weather in the 2021 northern hemispheric growing season becomes even slightly problematic, which we believe it may. The first signs of drought conditions have already emerged in Brazil, the wheat growing region of the Former Soviet Union, and in the US Midwest. Northeast China’s wheat growing region is currently suffering extremely cold weather causing severe damage to their winter wheat crop.

Once in a life time opportunity

I will start with a disclaimer….I am already invested in “Uranium” for last 9 months

why is this “once a life time” opportunity”

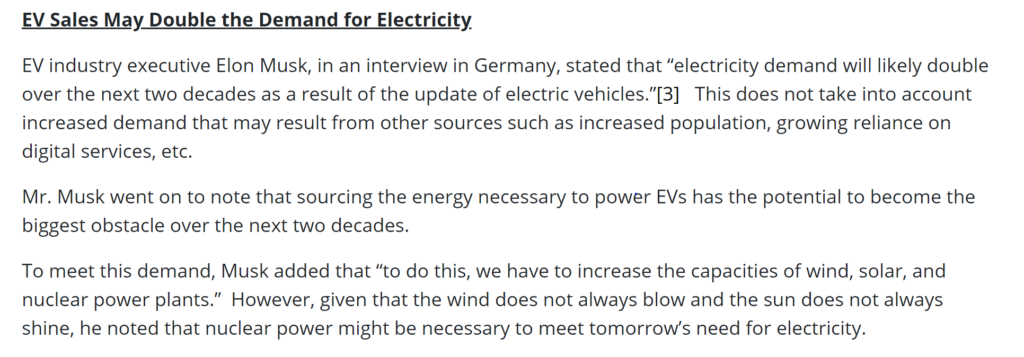
Every asset is about demand and supply. Let me tell you a little bit about “Demand”

Below is Elon Musk in an interview dated 7th Feb 2021.

and lets talk about supply “Deficit”

Image

but there is no point buying an asset if you are the only one buying it.. however good the fundamentals are…YOU NEED A MISSIONARY

We finally got our missionary

Below is a tweet storm by one and only Hugh Hendry this weekend

Brave New world

The next war will be fought over “chips” and “Rare earth Metals”

And who is the biggest buyer of chips in thworld

Image

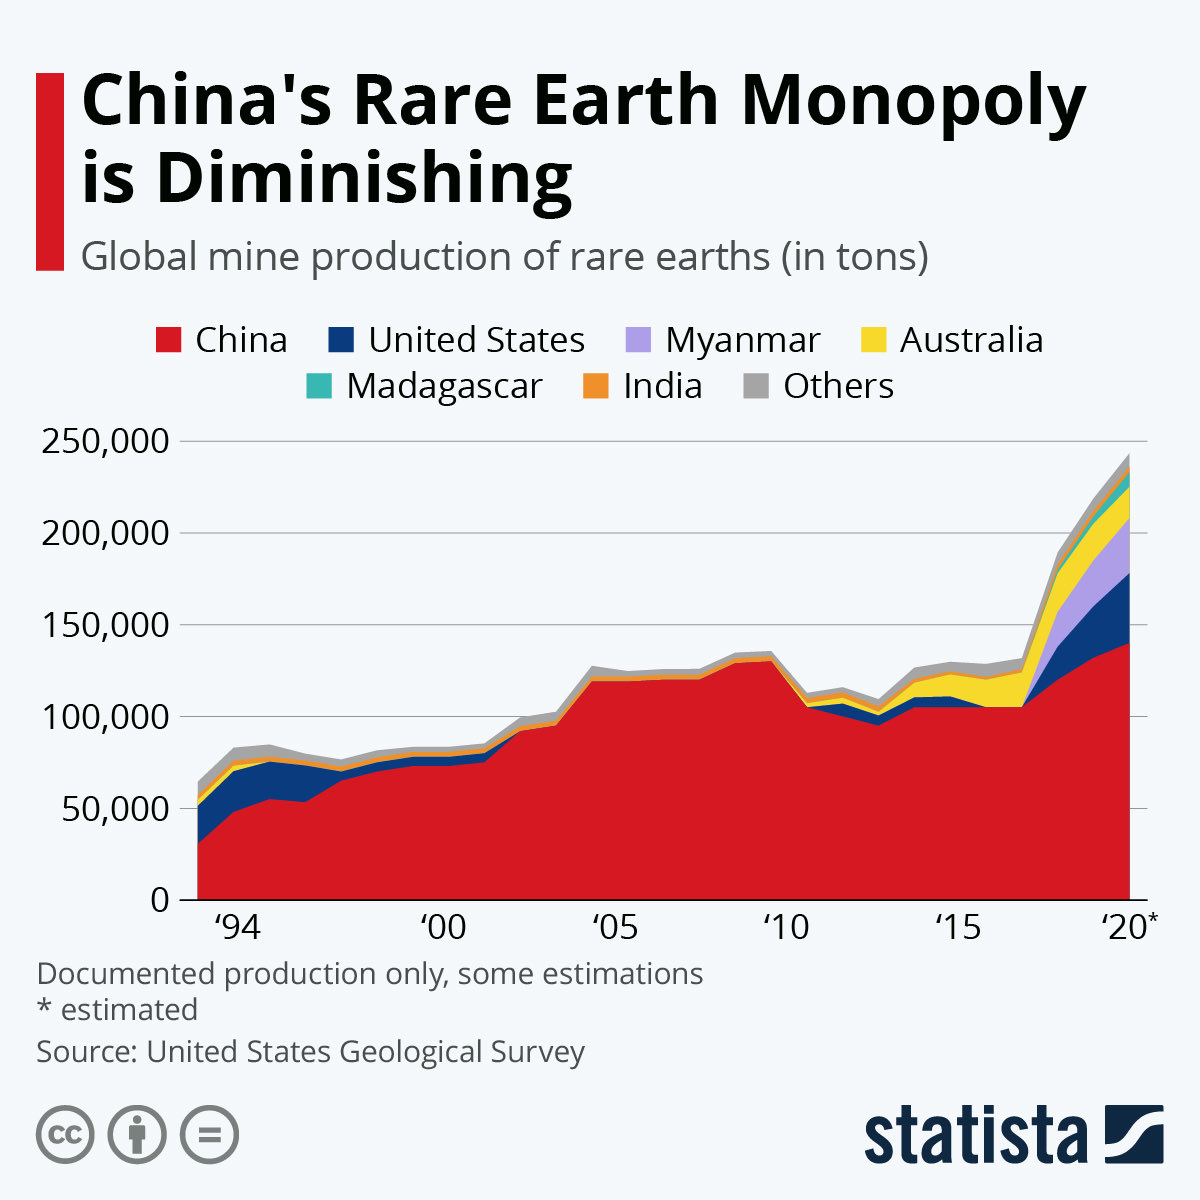
Next is Rare earth metals…

and Myanmar coup just in time. Honestly, most people cant place Myanmar on the map but today Myanmar is one of the most important countries in the world from geopolitical point of view… why?

Look at the following chart

Image

Bond Market Threatens Indian Equity Rally

India is the first country among major economies where Bond market vigilantes are rising from ashes

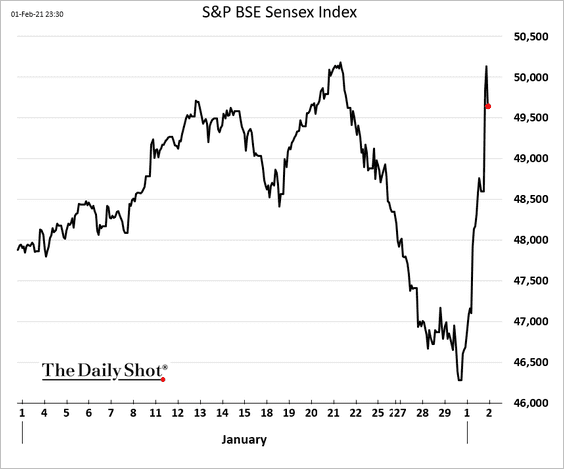
Indian govt announced the budget this Monday and the following headlines from Bloomberg is the only one you need to read to visualize the size of budget and extent of market borrowings

as a result the following reaction from SENSEX was a foregone conclusion

but not so fast

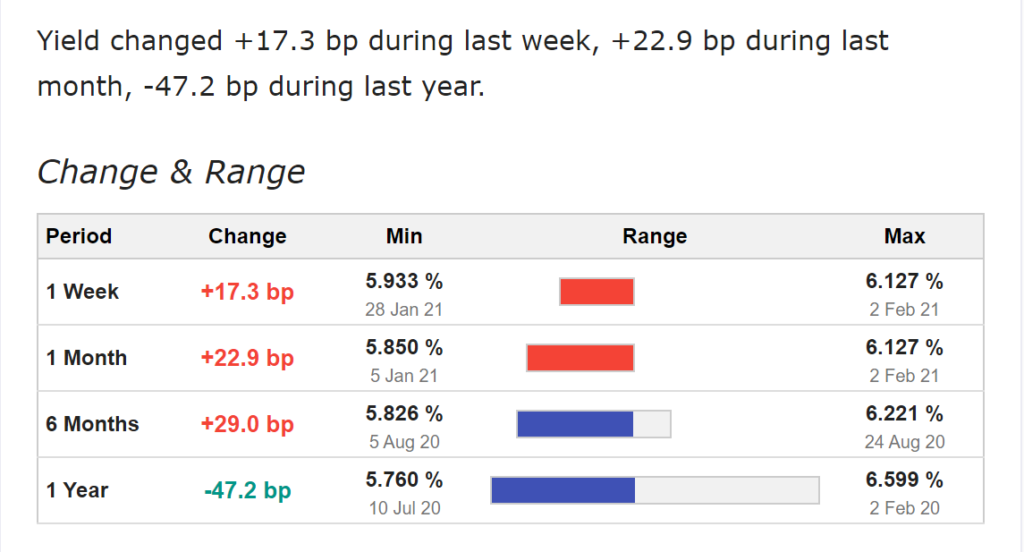
Indian bonds sold off hard with bond market not at all liking the extent of spending and revolting by raising the borrowing cost for govt.

I have often commented in past that till the time bond market oblige… equity markets get a free pass.

Another 30-40 BP increase in Indian 10 year bond yield will start to weigh heavily on equity valuations.

Bond market has spoken, either monetize the deficit and put a lid on bond yields which should be massively bullish for real and financial assets in the short run at the cost of longer run inflation

or

watch rising yields jeopardize government borrowing plans by raising the yields and in turn slowing down the economic momentum even before govt get a chance to kickstart their spending program.

Equity Market will just be the collateral damage

With #silversqueeze trending on Twitter, it appears that this week’s market spectacle may well be in the silver market.

by Sahil Bloom on twitter

A perfect moment for a thread on the Hunt Brothers and their alleged attempt to corner the silver market…

1/ First, let’s set the stage.

The Hunt Brothers – Nelson Bunker Hunt, William Herbert Hunt, and Lamar Hunt – were the sons of Texas tycoon H.L. Hunt.

H.L. Hunt had amassed a billion-dollar fortune in the oil industry.

He died in 1974 and left that fortune to his family.

2/ After H.L.’s passing, the Hunt Brothers had taken over the family holdings and successfully managed to expand the Hunt empire.

By the late 1970s, the family’s fortune was estimated to be ~$5 billion.

In the financial world, the Hunt name was as good as gold (or silver!).

3/ But the 1970s were a turbulent time in America.

Following the oil crisis of the early 1970s, the U.S. had entered a period of stagflation – a dire macroeconomic condition characterized by high inflation, low growth, and high unemployment.

4/ The Hunt Brothers – particularly Nelson Bunker and William Herbert – believed that the inflationary environment would persist and destroy the value of their family’s holdings.

To hedge this risk, they turned to silver.

They began buying the metal at ~$3 per ounce in 1973.5/ Not a conservative bunch, in the mid-late 1970s, the Hunt Brothers began more aggressively buying physical silver.

But it didn’t stop there.

They started buying all of the available silver futures contracts as well.

6/ Typically, these futures contracts are settled in cash, meaning the buyer (the Hunts) just receives cash for whatever the contract is worth at expiry.

But the Hunts were not typical – they wanted the silver!

So planes were loaded and shuttled silver to vaults in Switzerland.

7/ In addition to using their personal cash fortunes to execute this buying, the Hunt Brothers began aggressively leveraging their position.

They used margin (primer below) to expand their buying power in the market.

Their silver position ballooned.

8/ With the flood of demand from the Hunt Whale, silver prices began to rise.

At this point, it was rumored that this was more than a simple bet on silver as a hedge against paper currency.

The Hunt Brothers were attempting – rather successfully – to corner the silver market. 

9/ Cornering a market means an individual or entity acquires enough shares or ownership to manipulate the market price.

The individual backs the market into a corner – the market has nowhere to run.

The cornering party has full control over it.

It seemed like the Hunt’s plan. 

10/ In addition to their prolific buying, the Hunts brought other investors, some of Saudi origin, into the trade.

As prices climbed, a short squeeze was on.

11/ The price of silver skyrocketed from $6 per ounce in early 1979 to over $49 per ounce in early 1980 (a 700%+ spike!).

The Hunt position was now worth ~$5 billion.

They were believed to control 2/3 of the available market – intentionally or not, they had cornered the market.

12/ With prices at all-time highs, the silver frenzy was in full effect.

The price rise was so dramatic that Tiffany’s took out a full-page ad in the @nytimes deriding the Hunt Brothers for their actions and their impact on pushing mom-and-pop silver buyers out of the market.

13/ At this point, the government took notice.

And if there is one thing we learned in the last week, it’s that the rules of the game can be changed at any time.

Unfortunately for the Hunt Brothers, the rules of the game were about to change and pull the rug from under them. 

14/ In January 1980, Federal regulators stepped in.

In “Silver Rule 7,” regulators increased the margin requirements on silver futures, meaning purchasers would need to post additional collateral to support their loans.

The rules had changed – the Hunts were now the hunted. 

15/ What followed was a classic, leverage-induced downward spiral.

The price of silver began to fall.

The Hunt Brothers were issued margin calls on their loans.

To meet the margin calls, they had to sell silver.

The selling dropped the price, leading to more margin calls. 

16/ On March 27, 1980, when news broke that the Hunt Brothers had been unable to meet a $100+ million margin call, the silver market collapsed 50% to under $11 per ounce.

The government even grew worried about the systemic risk to the system if the Hunt’s brokers went under. 

17/ Given their other business interests, the Hunt Brothers were able to secure a rescue package of $1.1 billion from a variety of banks in order to meet their obligations.

While they did later declare bankruptcy to protect certain assets, the family fortune generally survived.

18/ Throughout the government and legal proceedings that followed the incident, the Hunt Brothers denied any wrongdoing.

They maintained that their silver purchases were not an attempt to corner the market but a legitimate investment in a hedge against fiat destruction.

19/ So as the world once again turns its gaze to the silver market, I hope the story of the Hunt Brothers provides an interesting historical backdrop for this week’s show.

As always, do your research and never take undue risks! 

Setting the Stage for an Oil Crisis

Via gorozen.com/blog

We believe we are on the cusp of a global energy crisis. Like most crises, the fundamental causes for this crisis have been brewing for several years but have lacked a catalyst to bring them to the attention of the public or to the average investor. The looming energy crisis is rooted in the underlying depletion of the US shales along with the chronic disappointments in non-OPEC supply in the rest of the world. The catalyst is the coronavirus.

2021.01-GRBlog224-linkedin

The initial phase of the crisis that took prices negative is behind us and the next phase which, should take prices much higher, is in its infancy. Global energy markets in general, and oil markets in particular, are slipping into a structural deficit as we speak. We believe energy will be the most important investment theme of the next several years and the biggest unintended consequence of the coronavirus.

Investors’ focus has shifted to how quickly supply can be brought back to meet recovering demand. While most investors believe the lost production will be easily brought back online, our models tell us something vastly different. While OPEC+ production will likely rebound, non-OPEC+ supply will be extremely challenged. Instead of recovering, our models tell us that non-OPEC+ production is about to decline dramatically from today’s already low levels.

Thus far, the slowdown in non-OPEC+ production has come entirely from proactively shutting in existing production. These wells were mostly old and only marginally economic before prices collapsed in 2020. Going forward, production will be impacted by a different and longer-lasting force. Low prices led producers to curtail nearly all new drilling activity. As recently as March 13th, 2020, there were 680 rigs drilling for oil in the United States. In less than four months, the US oil directed rig count fell by 75% to 180 – the lowest level on record.

Shale wells enjoy strong initial production rates but suffer from sharp subsequent declines. Basin production falls quickly unless new wells are constantly drilled and completed to offset the base declines. Considering US shale production was already falling sequentially back in November of 2019 when the rig count was above 700. Today’s 373 rigs all but guarantee production will collapse going forward.

Low prices have led to a sharp drilling slowdown in the rest of the world as well. Between February and June of 2020, the non-US rig count fell by 40% to 800 – also the lowest on record. We have often written about the depletion problem facing the non-OPEC+ world outside of the US shales. Over the last decade, this group has seen production decline slowly and steadily as a dearth of new large projects has not been enough to offset legacy field depletion. By laying down half their rigs, this group ensured that future production would be materially impacted.

Analysts continue to focus their attention on what has already happened (the shutting-in of existing production) instead of looking at what is yet to come. The unprecedented drilling slowdown is only now starting to impact production. Going forward, supply will plummet leaving the market in an extreme deficit starting now.

This blog was an excerpt from our broader white paper Top Reasons to Consider Oil-Related Equities. If you are interested in reading more about this topic, please download the white paper below.

Reasons to Consider Oil-Related Equities