This is the special edition of charts from Indiacharts monthly long short report.
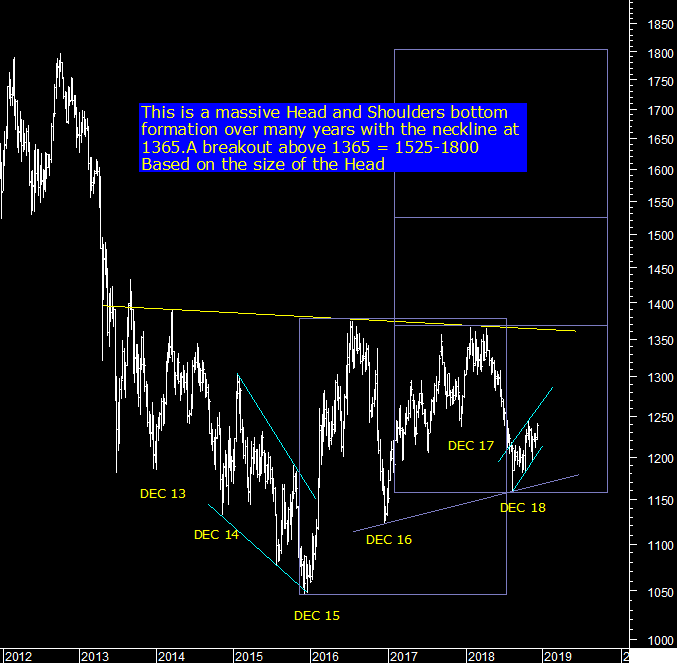
Below is Gold chart in US Dollar.
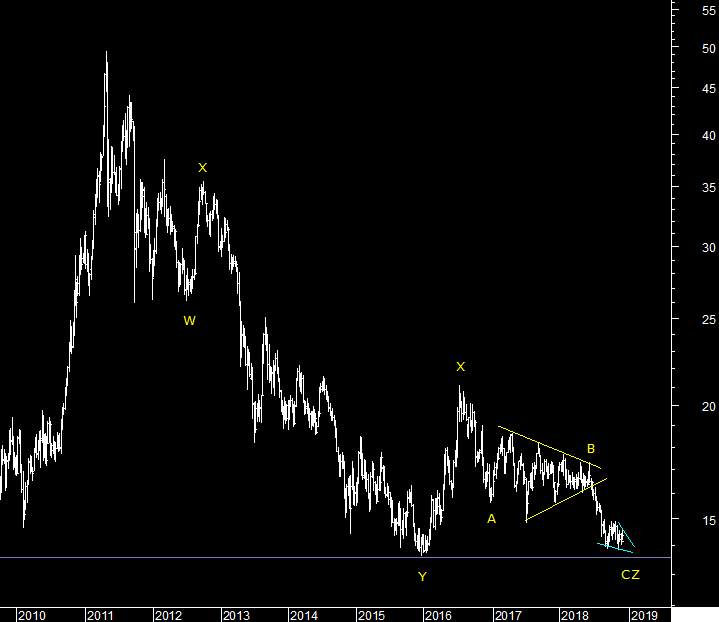
Silver is at a near double bottom at 13.76-14$ and waiting for a price confirmation. Once prices breakout then we should see silver join gold on the upside and go back to test the high near X near 21$ to start with.
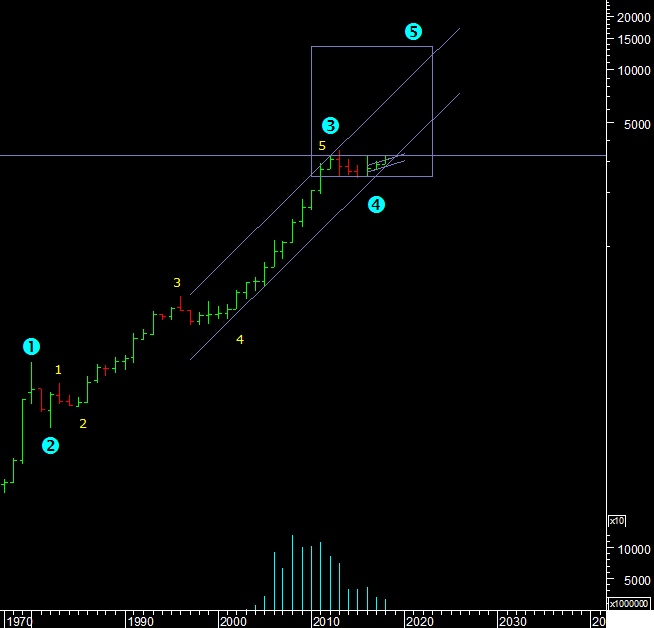
Rohit writes….So if Gold comed is going to kick off what does Gold Mcx look like long term? The MCX chart back dated to 1970 is here. The chart shows that we completed wave 4 long term in 2015. Since then this is the third year the Gold is closing positive even as the gains are small. The prices have held up much better in rupee terms because of the USDINR going up in 2013 and then again this year, the currency devaluations biggest beneficiary is gold. Now 32500 and 35075 are the two levels to breakout above. Where is 5=1 from the low in 2015? It is above 80,000 rupees. This is a yearly chart.
Conclusion
In short we maybe looking at down dollar and up Commodities for the next few years if this plays out. Stay tuned. But we are certainly looking at gold taking a head start as seasonality has kicked in, December is the best time for Gold to bottom out based on historical evidence. If the H&S bottom is done then this maybe the last chance to get in at these levels.
My two cents
I have a bias towards Gold simply because it cannot be printed at will and is a hedge against political stupidity. I do think a big rally is coming in precious metals but I am not sure Dollar rally is over as yet.
For full report subscribe
https://www.indiacharts.com/icjpages/index.php/subnow/levels